Noja Airbnb Market Analysis 2025: Short Term Rental Data & Vacation Rental Statistics in Cantabria, Spain
Is Airbnb profitable in Noja in 2025? Explore comprehensive Airbnb analytics for Noja, Cantabria, Spain to uncover income potential. This 2025 STR market report for Noja, based on AirROI data from April 2024 to March 2025, reveals key trends in the niche market of 148 active listings.
Whether you're considering an Airbnb investment in Noja, optimizing your existing vacation rental, or exploring rental arbitrage opportunities, understanding the Noja Airbnb data is crucial. Understanding the local regulations is key to maximizing your short term rental income potential. Let's dive into the specifics.
Key Noja Airbnb Performance Metrics Overview
Monthly Airbnb Revenue Variations & Income Potential in Noja (2025)
Understanding the monthly revenue variations for Airbnb listings in Noja is key to maximizing your short term rental income potential. Seasonality significantly impacts earnings. Our analysis, based on data from the past 12 months, shows that the peak revenue month for STRs in Noja is typically August, while February often presents the lowest earnings, highlighting opportunities for strategic pricing adjustments during shoulder and low seasons. Explore the typical Airbnb income in Noja across different performance tiers:
- Best-in-class properties (Top 10%) achieve $3,203+ monthly, often utilizing dynamic pricing and superior guest experiences.
- Strong performing properties (Top 25%) earn $1,915 or more, indicating effective management and desirable locations/amenities.
- Typical properties (Median) generate around $1,051 per month, representing the average market performance.
- Entry-level properties (Bottom 25%) see earnings around $603, often with potential for optimization.
Average Monthly Airbnb Earnings Trend in Noja
Noja Airbnb Occupancy Rate Trends (2025)
Maximize your bookings by understanding the Noja STR occupancy trends. Seasonal demand shifts significantly influence how often properties are booked. Typically, Augustsees the highest demand (peak season occupancy), while April experiences the lowest (low season). Effective strategies, like adjusting minimum stays or offering promotions, can boost occupancy during slower periods. Here's how different property tiers perform in Noja:
- Best-in-class properties (Top 10%) achieve 55%+ occupancy, indicating high desirability and potentially optimized availability.
- Strong performing properties (Top 25%) maintain 41% or higher occupancy, suggesting good market fit and guest satisfaction.
- Typical properties (Median) have an occupancy rate around 24%.
- Entry-level properties (Bottom 25%) average 14% occupancy, potentially facing higher vacancy.
Average Monthly Occupancy Rate Trend in Noja
Average Daily Rate (ADR) Airbnb Trends in Noja (2025)
Effective short term rental pricing strategy in Noja involves understanding monthly ADR fluctuations. The Average Daily Rate (ADR) for Airbnb in Noja typically peaks in November and dips lowest during September. Leveraging Airbnb dynamic pricing tools or strategies based on this seasonality can significantly boost revenue. Here's a look at the typical nightly rates achieved:
- Best-in-class properties (Top 10%) command rates of $216+ per night, often due to premium features or locations.
- Strong performing properties (Top 25%) achieve nightly rates of $163 or more.
- Typical properties (Median) charge around $127 per night.
- Entry-level properties (Bottom 25%) earn around $106 per night.
Average Daily Rate (ADR) Trend by Month in Noja
Get Live Noja Market Intelligence 👇

Explore Real-time Analytics
Airbnb Seasonality Analysis & Trends in Noja (2025)
Peak Season (August, July, June)
- Revenue averages $2,890 per month
- Occupancy rates average 53.5%
- Daily rates average $163
Shoulder Season
- Revenue averages $1,199 per month
- Occupancy maintains around 22.8%
- Daily rates hold near $160
Low Season (January, February, March)
- Revenue drops to average $620 per month
- Occupancy decreases to average 17.3%
- Daily rates adjust to average $165
Seasonality Insights for Noja
- The Airbnb seasonality in Noja shows highly seasonal trends requiring careful strategy. While the sections above show seasonal averages, it's also insightful to look at the extremes:
- During the high season, the absolute peak month showcases Noja's highest earning potential, with monthly revenues capable of climbing to $3,987, occupancy reaching a high of 77.8%, and ADRs peaking at $170.
- Conversely, the slowest single month of the year, typically falling within the low season, marks the market's lowest point. In this month, revenue might dip to $468, occupancy could drop to 13.1%, and ADRs may adjust down to $153.
- Understanding both the seasonal averages and these monthly peaks and troughs in revenue, occupancy, and ADR is crucial for maximizing your Airbnb profit potential in Noja.
Seasonal Strategies for Maximizing Profit
- Peak Season: Maximize revenue through premium pricing and potentially longer minimum stays. Ensure high availability.
- Low Season: Offer competitive pricing, special promotions (e.g., extended stay discounts), and flexible cancellation policies. Target off-season travelers like remote workers or budget-conscious guests.
- Shoulder Seasons: Implement dynamic pricing that balances peak and low rates. Target weekend travelers or specific events. Offer slightly more flexible terms than peak season.
- Regularly analyze your own performance against these Noja seasonality benchmarks and adjust your pricing and availability strategy accordingly.
Best Areas for Airbnb Investment in Noja (2025)
Exploring the top neighborhoods for short-term rentals in Noja? This section highlights key areas, outlining why they are attractive for hosts and guests, along with notable local attractions. Consider these locations based on your target guest profile and investment strategy.
| Neighborhood / Area | Why Host Here? (Target Guests & Appeal) | Key Attractions & Landmarks |
|---|---|---|
| La Playa | The main beach of Noja, known for its golden sands and family-friendly atmosphere. A popular spot for tourists during the summer months, making it ideal for Airbnb rentals. | Playa de Ris, Playa de Trengandín, Resorts and beach clubs, Water sports activities, Scenic coastal walks |
| Noja Town Center | The charming center of Noja, featuring traditional Cantabrian architecture and local shops. Provides guests with easy access to local culture, dining, and amenities. | Parish Church of San Pedro, Local markets, Restaurants and cafes, Cultural festivals, Historical walking tours |
| San Miguel | A quiet residential area close to the beach, perfect for families and those looking for a peaceful getaway. Ideal for longer stays and offers a relaxing atmosphere. | Natural landscapes, Parks and gardens, Scenic views of the coast, Proximity to local amenities, Family-friendly activities |
| Arenal de Sonabia | A picturesque area known for its natural beauty and stunning cliffs. Great for outdoor enthusiasts and those looking to be close to nature while enjoying the beach. | Clifftop views, Hiking trails, Cascadas de Bolao, Bird watching, Beach access |
| Las Marismas | A natural reserve area offering unique biodiversity. Attracts nature lovers and offers a different experience from the typical beachside stay. | Birdwatching, Walking paths, Nature photography, Educational tours, Local flora and fauna |
| Torre de la Horadada | A historic tower area that offers both beach access and cultural significance. Perfect for guests interested in history and scenic views. | Torre de la Horadada, Historical tours, Cultural heritage, Scenic coastline, Local seafood restaurants |
| Costa Quebrada | Famous for its dramatic cliffs and beaches, it is a favorite for those seeking adventure sports and natural beauty. Ideal for a more active vacation. | Surfing spots, Cliffside hiking, Beautiful beaches, Wildlife photography, Picnic areas |
| Valle de Noja | A serene valley area offering tranquility away from the busier beach spots. Ideal for nature lovers and those seeking relaxation. | Biking trails, Nature parks, Quiet retreats, Scenic views, Countryside activities |
Understanding Airbnb License Requirements & STR Laws in Noja (2025)
With 11% of listings showing registration in 2025, understanding potential Airbnb license requirements is crucial in Noja. Always verify the latest short term rental regulations and Airbnb license requirements directly with local government authorities for Noja to ensure full compliance before hosting.
(Source: AirROI data, 2025, based on 11% licensed listings)
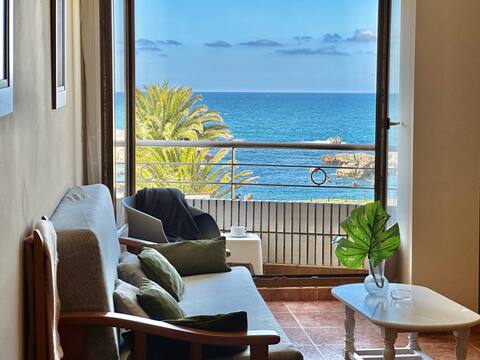
Top Performing Airbnb Properties in Noja (2025)
Benchmark your potential! Explore examples of top-performing Airbnb properties in Nojabased on Trailing Twelve Month (TTM) revenue. Analyze their characteristics, revenue, occupancy rate, and ADR to understand what drives success in this market.
Salceda flat
Entire Place • 2 bedrooms
Beautiful Villa with Private Pool and Beach
Entire Place • 4 bedrooms
Apartamento con vista al mar - Pineda 6404
Entire Place • 2 bedrooms
Next to the beach with garden - La Hojarasca 6820
Entire Place • 5 bedrooms

Apt on the front line - El Camarote 6019
Entire Place • 2 bedrooms
In Noja with parking space
Entire Place • 2 bedrooms
Note: Performance varies based on location, size, amenities, seasonality, and management quality. Data reflects the past 12 months.
Top Performing Airbnb Hosts in Noja (2025)
Learn from the best! This table showcases top-performing Airbnb hosts in Noja based on the number of properties managed and estimated total revenue over the past year. Analyze their scale and performance metrics.
| Host Name | Properties | Grossing Revenue | Stay Reviews | Avg Rating |
|---|---|---|---|---|
| Apartamentos Cantabria | 37 | $460,976 | 119 | 2.42/5.0 |
| Rebeca | 4 | $68,581 | 134 | 3.69/5.0 |
| Ignacio | 1 | $43,598 | 12 | 4.75/5.0 |
| Aranzazu | 1 | $40,146 | 6 | 4.67/5.0 |
| Rosa Maria | 1 | $33,389 | 14 | 4.43/5.0 |
| Luis Angel | 1 | $28,662 | 25 | 4.84/5.0 |
| Breynorsa | 3 | $27,010 | 176 | 4.68/5.0 |
| Laura | 3 | $24,567 | 23 | 4.80/5.0 |
| Jessica | 1 | $23,439 | 11 | 4.64/5.0 |
| Host #57411953 | 1 | $20,953 | 0 | 0.00/5.0 |
Analyzing the strategies of top hosts, such as their property selection, pricing, and guest communication, can offer valuable lessons for optimizing your own Airbnb operations in Noja.
Dive Deeper: Advanced Noja STR Market Data (2025)
Ready to unlock more insights? AirROI provides access to advanced metrics and comprehensive Airbnb data for Noja. Explore detailed analytics beyond this report to refine your investment strategy, optimize pricing, and maximize your vacation rental profits.
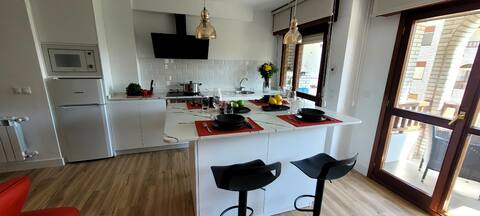
Explore Advanced MetricsNoja Short-Term Rental Market Composition (2025): Property & Room Types
Room Type Distribution
Property Type Distribution
Market Composition Insights for Noja
- The Noja Airbnb market composition is heavily skewed towards Entire Home/Apt listings, which make up 99.3% of the 148 active rentals. This indicates strong guest preference for privacy and space.
- Looking at the property type distribution in Noja, Apartment/Condo properties are the most common (88.5%), reflecting the local real estate landscape.
Noja Airbnb Room Capacity Analysis (2025): Bedroom Distribution
Distribution of Listings by Number of Bedrooms
Room Capacity Insights for Noja
- The dominant room capacity in Noja is 2 bedrooms listings, making up 64.9% of the market. This suggests a strong demand for properties suitable for couples or solo travelers.
- Together, 2 bedrooms and 3 bedrooms properties represent 84.5% of the active Airbnb listings in Noja, indicating a high concentration in these sizes.
- A significant 24.4% of listings offer 3+ bedrooms, catering to larger groups and families seeking more space in Noja.
Noja Vacation Rental Guest Capacity Trends (2025)
Distribution of Listings by Guest Capacity
Guest Capacity Insights for Noja
- The most common guest capacity trend in Noja vacation rentals is listings accommodating 4 guests (38.5%). This suggests the primary traveler segment is likely small families or groups.
- Properties designed for 4 guests and 5 guests dominate the Noja STR market, accounting for 58.8% of listings.
- 33.1% of properties accommodate 6+ guests, serving the market segment for larger families or group travel in Noja.
- On average, properties in Noja are equipped to host 4.9 guests.
Noja Airbnb Booking Patterns (2025): Available vs. Booked Days
Available Days Distribution
Booked Days Distribution
Booking Pattern Insights for Noja
- The most common availability pattern in Noja falls within the 271-366 days range, representing 74.3% of listings. This suggests many properties have significant open periods on their calendars.
- Approximately 95.2% of listings show high availability (181+ days open annually), indicating potential for increased bookings or specific owner usage patterns.
- For booked days, the 31-90 days range is most frequent in Noja (55.4%), reflecting common guest stay durations or potential owner blocking patterns.
- A notable 4.7% of properties secure long booking periods (181+ days booked per year), highlighting successful long-term rental strategies or significant owner usage.
Noja Airbnb Minimum Stay Requirements Analysis
Distribution of Listings by Minimum Night Requirement
1 Night
2 listings
1.4% of total
2 Nights
23 listings
16.3% of total
3 Nights
8 listings
5.7% of total
4-6 Nights
33 listings
23.4% of total
7-29 Nights
30 listings
21.3% of total
30+ Nights
45 listings
31.9% of total
Key Insights
- The most prevalent minimum stay requirement in Noja is 30+ Nights, adopted by 31.9% of listings. This highlights the market's preference for longer commitments.
- Very short stays (1-2 nights) are less common (17.7%), suggesting hosts prefer slightly longer bookings to optimize turnover.
- A significant segment (31.9%) caters to monthly stays (30+ nights) in Noja, pointing to opportunities in the extended-stay market.
Recommendations
- Align with the market by considering a 30+ Nights minimum stay, as 31.9% of Noja hosts use this setting.
- If feasible, allowing 1-night stays, especially midweek or during low season, could capture last-minute bookings, as only 1.4% currently do.
- Explore offering discounts for stays of 30+ nights to attract the 31.9% of the market seeking extended stays.
- Adjust minimum nights based on seasonality – potentially shorter during low season and longer during peak demand periods in Noja.
Noja Airbnb Cancellation Policy Trends Analysis (2025)
Super Strict 30 Days
1 listings
0.8% of total
Flexible
12 listings
10% of total
Moderate
25 listings
20.8% of total
Firm
46 listings
38.3% of total
Strict
36 listings
30% of total
Cancellation Policy Insights for Noja
- The prevailing Airbnb cancellation policy trend in Noja is Firm, used by 38.3% of listings.
- A majority (68.3%) of hosts in Noja utilize Firm or Strict policies, indicating a market where hosts prioritize booking security.
Recommendations for Hosts
- Consider adopting a Firm policy to align with the 38.3% market standard in Noja.
- Regularly review your cancellation policy against competitors and market demand shifts in Noja.
Noja STR Booking Lead Time Analysis (2025)
Average Booking Lead Time by Month
Booking Lead Time Insights for Noja
- The overall average booking lead time for vacation rentals in Noja is 52 days.
- Guests book furthest in advance for stays during July (average 96 days), likely coinciding with peak travel demand or local events.
- The shortest booking windows occur for stays in November (average 11 days), indicating more last-minute travel plans during this time.
- Seasonally, Summer (78 days avg.) sees the longest lead times, while Winter (16 days avg.) has the shortest, reflecting typical travel planning cycles.
Recommendations for Hosts
- Use the overall average lead time (52 days) as a baseline for your pricing and availability strategy in Noja.
- For July stays, consider implementing length-of-stay discounts or slightly higher rates for bookings made less than 96 days out to capitalize on advance planning.
- During November, focus on last-minute booking availability and promotions, as guests book with very short notice (11 days avg.).
- Target marketing efforts for the Summer season well in advance (at least 78 days) to capture early planners.
- Monitor your own booking lead times against these Noja averages to identify opportunities for dynamic pricing adjustments.
Popular & Essential Airbnb Amenities in Noja (2025)
Amenity Prevalence
Amenity Insights for Noja
- Essential amenities in Noja that guests expect include: Washer, TV, Kitchen. Lacking these (any) could significantly impact bookings.
- Popular amenities like Hot water, Iron, Coffee maker are common but not universal. Offering these can provide a competitive edge.
Recommendations for Hosts
- Ensure your listing includes all essential amenities for Noja: Washer, TV, Kitchen.
- Prioritize adding missing essentials: Washer, TV, Kitchen.
- Consider adding popular differentiators like Hot water or Iron to increase appeal.
- Highlight unique or less common amenities you offer (e.g., hot tub, dedicated workspace, EV charger) in your listing description and photos.
- Regularly check competitor amenities in Noja to stay competitive.
Noja Airbnb Guest Demographics & Profile Analysis (2025)
Guest Profile Summary for Noja
- The typical guest profile for Airbnb in Noja consists of primarily domestic travelers (71%), often arriving from nearby Madrid, typically belonging to the Post-2000s (Gen Z/Alpha) group (50%), primarily speaking Spanish or English.
- Domestic travelers account for 70.5% of guests.
- Key international markets include Spain (70.5%) and France (11.2%).
- Top languages spoken are Spanish (37.9%) followed by English (32.1%).
- A significant demographic segment is the Post-2000s (Gen Z/Alpha) group, representing 50% of guests.
Recommendations for Hosts
- Target domestic marketing efforts towards travelers from Madrid and Valladolid.
- Tailor amenities and listing descriptions to appeal to the dominant Post-2000s (Gen Z/Alpha) demographic (e.g., highlight fast WiFi, smart home features, local guides).
- Highlight unique local experiences or amenities relevant to the primary guest profile.
- Consider seasonal promotions aligned with peak travel times for key origin markets.
Nearby Short-Term Rental Market Comparison
How does the Noja Airbnb market stack up against its neighbors? Compare key performance metrics like average monthly revenue, ADR, and occupancy rates in surrounding areas to understand the broader regional STR landscape.
| Market | Active Properties | Monthly Revenue | Daily Rate | Avg. Occupancy |
|---|---|---|---|---|
| Gautegiz Arteaga | 21 | $2,865 | $293.66 | 38% |
| Labastida/Bastida | 11 | $2,662 | $268.80 | 34% |
| Barrika | 13 | $2,629 | $314.61 | 41% |
| Dima | 11 | $2,422 | $332.91 | 42% |
| Erandio | 16 | $2,361 | $164.90 | 56% |
| Getaria | 41 | $2,325 | $210.17 | 39% |
| Leioa | 11 | $2,208 | $252.81 | 38% |
| Ibarrangelu | 15 | $2,191 | $216.43 | 39% |
| Quintanilla Vivar | 12 | $2,167 | $186.62 | 41% |
| Bilbao | 1,224 | $2,165 | $158.98 | 50% |