Los Corrales de Buelna Airbnb Market Analysis 2025: Short Term Rental Data & Vacation Rental Statistics in Cantabria, Spain
Is Airbnb profitable in Los Corrales de Buelna in 2025? Explore comprehensive Airbnb analytics for Los Corrales de Buelna, Cantabria, Spain to uncover income potential. This 2025 STR market report for Los Corrales de Buelna, based on AirROI data from April 2024 to March 2025, reveals key trends in the niche market of 20 active listings.
Whether you're considering an Airbnb investment in Los Corrales de Buelna, optimizing your existing vacation rental, or exploring rental arbitrage opportunities, understanding the Los Corrales de Buelna Airbnb data is crucial. Leveraging the low regulation environment is key to maximizing your short term rental income potential. Let's dive into the specifics.
Key Los Corrales de Buelna Airbnb Performance Metrics Overview
Monthly Airbnb Revenue Variations & Income Potential in Los Corrales de Buelna (2025)
Understanding the monthly revenue variations for Airbnb listings in Los Corrales de Buelna is key to maximizing your short term rental income potential. Seasonality significantly impacts earnings. Our analysis, based on data from the past 12 months, shows that the peak revenue month for STRs in Los Corrales de Buelna is typically July, while February often presents the lowest earnings, highlighting opportunities for strategic pricing adjustments during shoulder and low seasons. Explore the typical Airbnb income in Los Corrales de Buelna across different performance tiers:
- Best-in-class properties (Top 10%) achieve $3,480+ monthly, often utilizing dynamic pricing and superior guest experiences.
- Strong performing properties (Top 25%) earn $2,186 or more, indicating effective management and desirable locations/amenities.
- Typical properties (Median) generate around $1,422 per month, representing the average market performance.
- Entry-level properties (Bottom 25%) see earnings around $1,086, often with potential for optimization.
Average Monthly Airbnb Earnings Trend in Los Corrales de Buelna
Los Corrales de Buelna Airbnb Occupancy Rate Trends (2025)
Maximize your bookings by understanding the Los Corrales de Buelna STR occupancy trends. Seasonal demand shifts significantly influence how often properties are booked. Typically, Septembersees the highest demand (peak season occupancy), while December experiences the lowest (low season). Effective strategies, like adjusting minimum stays or offering promotions, can boost occupancy during slower periods. Here's how different property tiers perform in Los Corrales de Buelna:
- Best-in-class properties (Top 10%) achieve 61%+ occupancy, indicating high desirability and potentially optimized availability.
- Strong performing properties (Top 25%) maintain 55% or higher occupancy, suggesting good market fit and guest satisfaction.
- Typical properties (Median) have an occupancy rate around 39%.
- Entry-level properties (Bottom 25%) average 24% occupancy, potentially facing higher vacancy.
Average Monthly Occupancy Rate Trend in Los Corrales de Buelna
Average Daily Rate (ADR) Airbnb Trends in Los Corrales de Buelna (2025)
Effective short term rental pricing strategy in Los Corrales de Buelna involves understanding monthly ADR fluctuations. The Average Daily Rate (ADR) for Airbnb in Los Corrales de Buelna typically peaks in August and dips lowest during January. Leveraging Airbnb dynamic pricing tools or strategies based on this seasonality can significantly boost revenue. Here's a look at the typical nightly rates achieved:
- Best-in-class properties (Top 10%) command rates of $273+ per night, often due to premium features or locations.
- Strong performing properties (Top 25%) achieve nightly rates of $163 or more.
- Typical properties (Median) charge around $103 per night.
- Entry-level properties (Bottom 25%) earn around $87 per night.
Average Daily Rate (ADR) Trend by Month in Los Corrales de Buelna
Get Live Los Corrales de Buelna Market Intelligence 👇

Explore Real-time Analytics
Airbnb Seasonality Analysis & Trends in Los Corrales de Buelna (2025)
Peak Season (July, September, August)
- Revenue averages $2,466 per month
- Occupancy rates average 68.0%
- Daily rates average $160
Shoulder Season
- Revenue averages $1,783 per month
- Occupancy maintains around 33.3%
- Daily rates hold near $152
Low Season (January, February, November)
- Revenue drops to average $848 per month
- Occupancy decreases to average 24.6%
- Daily rates adjust to average $141
Seasonality Insights for Los Corrales de Buelna
- The Airbnb seasonality in Los Corrales de Buelna shows highly seasonal trends requiring careful strategy. While the sections above show seasonal averages, it's also insightful to look at the extremes:
- During the high season, the absolute peak month showcases Los Corrales de Buelna's highest earning potential, with monthly revenues capable of climbing to $2,533, occupancy reaching a high of 73.1%, and ADRs peaking at $163.
- Conversely, the slowest single month of the year, typically falling within the low season, marks the market's lowest point. In this month, revenue might dip to $659, occupancy could drop to 17.8%, and ADRs may adjust down to $139.
- Understanding both the seasonal averages and these monthly peaks and troughs in revenue, occupancy, and ADR is crucial for maximizing your Airbnb profit potential in Los Corrales de Buelna.
Seasonal Strategies for Maximizing Profit
- Peak Season: Maximize revenue through premium pricing and potentially longer minimum stays. Ensure high availability.
- Low Season: Offer competitive pricing, special promotions (e.g., extended stay discounts), and flexible cancellation policies. Target off-season travelers like remote workers or budget-conscious guests.
- Shoulder Seasons: Implement dynamic pricing that balances peak and low rates. Target weekend travelers or specific events. Offer slightly more flexible terms than peak season.
- Regularly analyze your own performance against these Los Corrales de Buelna seasonality benchmarks and adjust your pricing and availability strategy accordingly.
Best Areas for Airbnb Investment in Los Corrales de Buelna (2025)
Exploring the top neighborhoods for short-term rentals in Los Corrales de Buelna? This section highlights key areas, outlining why they are attractive for hosts and guests, along with notable local attractions. Consider these locations based on your target guest profile and investment strategy.
| Neighborhood / Area | Why Host Here? (Target Guests & Appeal) | Key Attractions & Landmarks |
|---|---|---|
| El Parque Natural de las Marismas de Santoña, Victoria y Joyel | Beautiful natural park known for its diverse wildlife and stunning landscapes. Ideal for nature lovers and those looking for outdoor activities such as bird watching and hiking. | Las Marismas Nature Reserve, Birdwatching trails, Beach areas, Local seafood restaurants, Scenic viewpoints |
| Comillas | Charming coastal town known for its modernist architecture and beaches. Attracts tourists interested in culture, history, and seaside relaxation. | El Capricho (Gaudí's building), Comillas Beach, Palacio de Sobrellano, Historical Town Center, Cultural festivals |
| San Vicente de la Barquera | Picturesque fishing village with stunning coastal views and rich maritime heritage. Great for tourists seeking a blend of beach, culture, and nature. | San Vicente Beach, Santa Marina Beach, Historic fishing port, Castillo del Rey, Local seafood restaurants |
| Cabuérniga | Quaint village in the valley with access to hiking trails and natural beauty. Attracts those looking for a peaceful retreat and authentic local experiences. | Natural hiking routes, Traditional stone houses, Local artisan shops, Scenic landscapes, Cultural heritage sites |
| Potes | Idyllic town situated in the Picos de Europa mountains, perfect for adventure tourism as well as cultural exploration of the region. | Picos de Europa National Park, Monastery of Santo Toribio, Local cuisine and markets, River Deva activities, Historical architecture |
| Laredo | Popular beach destination known for its lengthy sandy beaches and vibrant summer atmosphere. Ideal for sun-seeking tourists and families. | La Salve Beach, Historical old town, Summer festivals, Maritime promenade, Water sports activities |
| Santillana del Mar | Historical village known for its medieval architecture and proximity to the Altamira Caves. Attractive to history buffs and families. | Altamira Caves, Museum of Altamira, Medieval streets, Animal park, Local handicraft shops |
| Torrelavega | Urban center with a mix of cultural, commercial, and recreational offerings. Attractive for business travelers and city explorers. | Museo de Altamira, Local shopping areas, Cultural events, Parks and gardens, Traditional markets |
Understanding Airbnb License Requirements & STR Laws in Los Corrales de Buelna (2025)
While Los Corrales de Buelna, Cantabria, Spain currently shows low STR regulations, specific Airbnb license requirements might still exist or change. Always verify the latest short term rental regulations and Airbnb license requirements directly with local government authorities for Los Corrales de Buelna to ensure full compliance before hosting.
(Source: AirROI data, 2025, based on 5% licensed listings)
Top Performing Airbnb Properties in Los Corrales de Buelna (2025)
Benchmark your potential! Explore examples of top-performing Airbnb properties in Los Corrales de Buelnabased on Trailing Twelve Month (TTM) revenue. Analyze their characteristics, revenue, occupancy rate, and ADR to understand what drives success in this market.
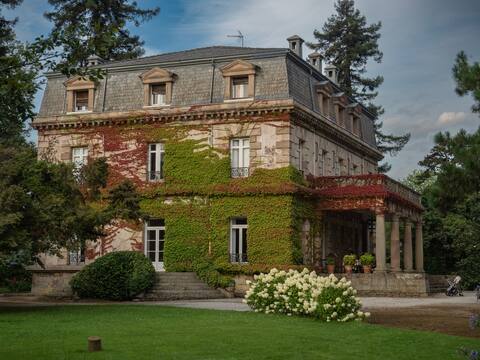
Noble house with gorgeous garden
Entire Place • 10 bedrooms
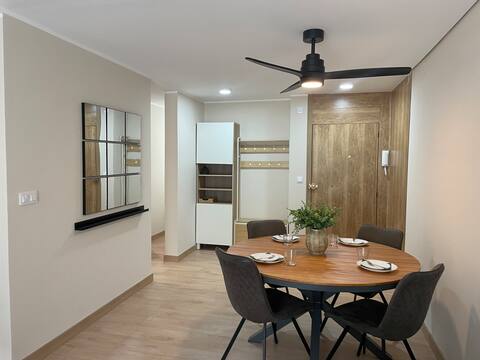
Holiday apartment
Entire Place • 1 bedroom
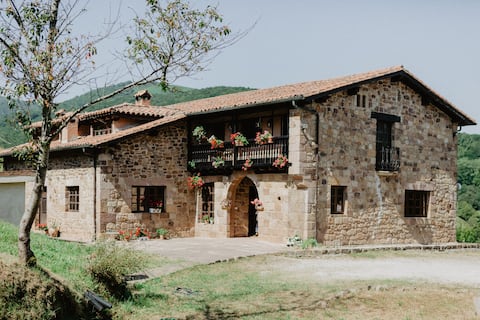
Finca las Bardas Room 2 with view of valley
Private Room • N/A
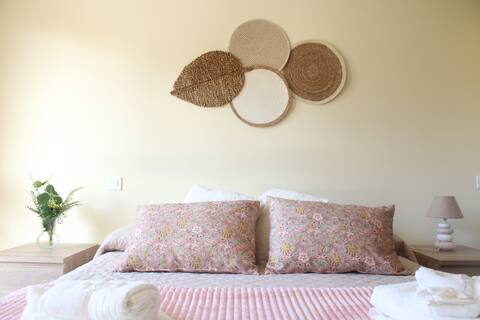
Finca las Bardas Room 1 with view of valley
Private Room • N/A
Piso Santo Domingo
Entire Place • 2 bedrooms
Finca las Bardas Room 4 with view of valley
Private Room • N/A
Note: Performance varies based on location, size, amenities, seasonality, and management quality. Data reflects the past 12 months.
Top Performing Airbnb Hosts in Los Corrales de Buelna (2025)
Learn from the best! This table showcases top-performing Airbnb hosts in Los Corrales de Buelna based on the number of properties managed and estimated total revenue over the past year. Analyze their scale and performance metrics.
| Host Name | Properties | Grossing Revenue | Stay Reviews | Avg Rating |
|---|---|---|---|---|
| Kike | 8 | $66,443 | 221 | 4.79/5.0 |
| Rhea | 4 | $55,414 | 33 | 3.71/5.0 |
| Gabriel | 1 | $34,786 | 7 | 5.00/5.0 |
| Andreea | 1 | $21,408 | 8 | 5.00/5.0 |
| Host #253439437 | 1 | $16,827 | 1 | 0.00/5.0 |
| Carmen | 1 | $13,536 | 10 | 4.50/5.0 |
| Juanluis | 1 | $8,449 | 22 | 4.86/5.0 |
| Patricia | 1 | $7,681 | 11 | 4.82/5.0 |
| R2R Consulting | 1 | $4,071 | 16 | 4.63/5.0 |
| Host #910123 | 1 | $1,475 | 2 | 0.00/5.0 |
Analyzing the strategies of top hosts, such as their property selection, pricing, and guest communication, can offer valuable lessons for optimizing your own Airbnb operations in Los Corrales de Buelna.
Dive Deeper: Advanced Los Corrales de Buelna STR Market Data (2025)
Ready to unlock more insights? AirROI provides access to advanced metrics and comprehensive Airbnb data for Los Corrales de Buelna. Explore detailed analytics beyond this report to refine your investment strategy, optimize pricing, and maximize your vacation rental profits.
Explore Advanced MetricsLos Corrales de Buelna Short-Term Rental Market Composition (2025): Property & Room Types
Room Type Distribution
Property Type Distribution
Market Composition Insights for Los Corrales de Buelna
- The Los Corrales de Buelna Airbnb market composition is heavily skewed towards Private Room listings, which make up 60% of the 20 active rentals. This indicates strong guest preference for privacy and space.
- Looking at the property type distribution in Los Corrales de Buelna, Hotel/Boutique properties are the most common (40%), reflecting the local real estate landscape.
- Houses represent a significant 20% portion, catering likely to families or larger groups.
- The presence of 40% Hotel/Boutique listings indicates integration with traditional hospitality.
Los Corrales de Buelna Airbnb Room Capacity Analysis (2025): Bedroom Distribution
Distribution of Listings by Number of Bedrooms
Room Capacity Insights for Los Corrales de Buelna
- The dominant room capacity in Los Corrales de Buelna is 1 bedroom listings, making up 15% of the market. This suggests a strong demand for properties suitable for couples or solo travelers.
- Together, 1 bedroom and 2 bedrooms properties represent 30.0% of the active Airbnb listings in Los Corrales de Buelna, indicating a high concentration in these sizes.
Los Corrales de Buelna Vacation Rental Guest Capacity Trends (2025)
Distribution of Listings by Guest Capacity
Guest Capacity Insights for Los Corrales de Buelna
- The most common guest capacity trend in Los Corrales de Buelna vacation rentals is listings accommodating 4 guests (15%). This suggests the primary traveler segment is likely small families or groups.
- Properties designed for 4 guests and 6 guests dominate the Los Corrales de Buelna STR market, accounting for 30.0% of listings.
- 20.0% of properties accommodate 6+ guests, serving the market segment for larger families or group travel in Los Corrales de Buelna.
- On average, properties in Los Corrales de Buelna are equipped to host 2.3 guests.
Los Corrales de Buelna Airbnb Booking Patterns (2025): Available vs. Booked Days
Available Days Distribution
Booked Days Distribution
Booking Pattern Insights for Los Corrales de Buelna
- The most common availability pattern in Los Corrales de Buelna falls within the 271-366 days range, representing 55% of listings. This suggests many properties have significant open periods on their calendars.
- Approximately 90.0% of listings show high availability (181+ days open annually), indicating potential for increased bookings or specific owner usage patterns.
- For booked days, the 91-180 days range is most frequent in Los Corrales de Buelna (40%), reflecting common guest stay durations or potential owner blocking patterns.
- A notable 10.0% of properties secure long booking periods (181+ days booked per year), highlighting successful long-term rental strategies or significant owner usage.
Los Corrales de Buelna Airbnb Minimum Stay Requirements Analysis
Distribution of Listings by Minimum Night Requirement
1 Night
10 listings
50% of total
2 Nights
4 listings
20% of total
3 Nights
2 listings
10% of total
4-6 Nights
1 listings
5% of total
7-29 Nights
1 listings
5% of total
30+ Nights
2 listings
10% of total
Key Insights
- The most prevalent minimum stay requirement in Los Corrales de Buelna is 1 Night, adopted by 50% of listings. This highlights the market's preference for shorter, flexible bookings.
- A strong majority (70.0%) of the Los Corrales de Buelna Airbnb data shows acceptance of very short stays (1-2 nights), indicating a dynamic, high-turnover market.
Recommendations
- Align with the market by considering a 1 Night minimum stay, as 50% of Los Corrales de Buelna hosts use this setting.
- Explore offering discounts for stays of 30+ nights to attract the 10% of the market seeking extended stays.
- Adjust minimum nights based on seasonality – potentially shorter during low season and longer during peak demand periods in Los Corrales de Buelna.
Los Corrales de Buelna Airbnb Cancellation Policy Trends Analysis (2025)
Flexible
2 listings
11.8% of total
Moderate
10 listings
58.8% of total
Firm
4 listings
23.5% of total
Strict
1 listings
5.9% of total
Cancellation Policy Insights for Los Corrales de Buelna
- The prevailing Airbnb cancellation policy trend in Los Corrales de Buelna is Moderate, used by 58.8% of listings.
- The market strongly favors guest-friendly terms, with 70.6% of listings offering Flexible or Moderate policies. This suggests guests in Los Corrales de Buelna may expect booking flexibility.
- Strict cancellation policies are quite rare (5.9%), potentially making listings with this policy less competitive unless justified by high demand or property type.
Recommendations for Hosts
- Consider adopting a Moderate policy to align with the 58.8% market standard in Los Corrales de Buelna.
- Using a Strict policy might deter some guests, as only 5.9% of listings use it. Evaluate if potential revenue protection outweighs possible lower booking rates.
- Regularly review your cancellation policy against competitors and market demand shifts in Los Corrales de Buelna.
Los Corrales de Buelna STR Booking Lead Time Analysis (2025)
Average Booking Lead Time by Month
Booking Lead Time Insights for Los Corrales de Buelna
- The overall average booking lead time for vacation rentals in Los Corrales de Buelna is 69 days.
- Guests book furthest in advance for stays during July (average 127 days), likely coinciding with peak travel demand or local events.
- The shortest booking windows occur for stays in December (average 33 days), indicating more last-minute travel plans during this time.
- Seasonally, Summer (88 days avg.) sees the longest lead times, while Winter (47 days avg.) has the shortest, reflecting typical travel planning cycles.
Recommendations for Hosts
- Use the overall average lead time (69 days) as a baseline for your pricing and availability strategy in Los Corrales de Buelna.
- For July stays, consider implementing length-of-stay discounts or slightly higher rates for bookings made less than 127 days out to capitalize on advance planning.
- Target marketing efforts for the Summer season well in advance (at least 88 days) to capture early planners.
- Monitor your own booking lead times against these Los Corrales de Buelna averages to identify opportunities for dynamic pricing adjustments.
Popular & Essential Airbnb Amenities in Los Corrales de Buelna (2025)
Amenity Prevalence
Amenity Insights for Los Corrales de Buelna
- Essential amenities in Los Corrales de Buelna that guests expect include: Hot water. Lacking these (this) could significantly impact bookings.
- Popular amenities like Microwave, Hair dryer, Dishes and silverware are common but not universal. Offering these can provide a competitive edge.
- Warning: Wifi is not universally provided but is considered essential globally. Ensure reliable Wifi is offered.
Recommendations for Hosts
- Ensure your listing includes all essential amenities for Los Corrales de Buelna: Hot water.
- Prioritize adding missing essentials: Hot water.
- Consider adding popular differentiators like Microwave or Hair dryer to increase appeal.
- Highlight unique or less common amenities you offer (e.g., hot tub, dedicated workspace, EV charger) in your listing description and photos.
- Regularly check competitor amenities in Los Corrales de Buelna to stay competitive.
Los Corrales de Buelna Airbnb Guest Demographics & Profile Analysis (2025)
Guest Profile Summary for Los Corrales de Buelna
- The typical guest profile for Airbnb in Los Corrales de Buelna consists of a mix of domestic (59%) and international guests, often arriving from nearby Valencia, typically belonging to the Post-2000s (Gen Z/Alpha) group (50%), primarily speaking Spanish or English.
- Domestic travelers account for 59.1% of guests.
- Key international markets include Spain (59.1%) and France (16.1%).
- Top languages spoken are Spanish (34.8%) followed by English (32.1%).
- A significant demographic segment is the Post-2000s (Gen Z/Alpha) group, representing 50% of guests.
Recommendations for Hosts
- Balance marketing efforts between domestic and international channels based on the guest mix.
- Tailor amenities and listing descriptions to appeal to the dominant Post-2000s (Gen Z/Alpha) demographic (e.g., highlight fast WiFi, smart home features, local guides).
- Highlight unique local experiences or amenities relevant to the primary guest profile.
- Consider seasonal promotions aligned with peak travel times for key origin markets.
Nearby Short-Term Rental Market Comparison
How does the Los Corrales de Buelna Airbnb market stack up against its neighbors? Compare key performance metrics like average monthly revenue, ADR, and occupancy rates in surrounding areas to understand the broader regional STR landscape.
| Market | Active Properties | Monthly Revenue | Daily Rate | Avg. Occupancy |
|---|---|---|---|---|
| Quintanilla Vivar | 12 | $2,167 | $186.62 | 41% |
| Getxo | 126 | $1,960 | $159.40 | 47% |
| Liérganes | 49 | $1,948 | $207.69 | 44% |
| Aiarako kuadrilla/Cuadrilla de Ayala | 22 | $1,936 | $197.35 | 39% |
| Santiurde de Toranzo | 14 | $1,920 | $223.21 | 38% |
| Riotuerto | 15 | $1,897 | $199.60 | 35% |
| Entrambasaguas | 40 | $1,832 | $186.39 | 36% |
| Penagos | 23 | $1,797 | $265.07 | 29% |
| Bareyo | 11 | $1,731 | $190.63 | 46% |
| Villacarriedo | 28 | $1,680 | $281.35 | 35% |