Villaverde Airbnb Market Analysis 2025: Short Term Rental Data & Vacation Rental Statistics in Canary Islands, Spain
Is Airbnb profitable in Villaverde in 2025? Explore comprehensive Airbnb analytics for Villaverde, Canary Islands, Spain to uncover income potential. This 2025 STR market report for Villaverde, based on AirROI data from April 2024 to March 2025, reveals key trends in the niche market of 90 active listings.
Whether you're considering an Airbnb investment in Villaverde, optimizing your existing vacation rental, or exploring rental arbitrage opportunities, understanding the Villaverde Airbnb data is crucial. Understanding the local regulations is key to maximizing your short term rental income potential. Let's dive into the specifics.
Key Villaverde Airbnb Performance Metrics Overview
Monthly Airbnb Revenue Variations & Income Potential in Villaverde (2025)
Understanding the monthly revenue variations for Airbnb listings in Villaverde is key to maximizing your short term rental income potential. Seasonality significantly impacts earnings. Our analysis, based on data from the past 12 months, shows that the peak revenue month for STRs in Villaverde is typically December, while September often presents the lowest earnings, highlighting opportunities for strategic pricing adjustments during shoulder and low seasons. Explore the typical Airbnb income in Villaverde across different performance tiers:
- Best-in-class properties (Top 10%) achieve $4,963+ monthly, often utilizing dynamic pricing and superior guest experiences.
- Strong performing properties (Top 25%) earn $2,860 or more, indicating effective management and desirable locations/amenities.
- Typical properties (Median) generate around $1,684 per month, representing the average market performance.
- Entry-level properties (Bottom 25%) see earnings around $776, often with potential for optimization.
Average Monthly Airbnb Earnings Trend in Villaverde
Villaverde Airbnb Occupancy Rate Trends (2025)
Maximize your bookings by understanding the Villaverde STR occupancy trends. Seasonal demand shifts significantly influence how often properties are booked. Typically, Decembersees the highest demand (peak season occupancy), while June experiences the lowest (low season). Effective strategies, like adjusting minimum stays or offering promotions, can boost occupancy during slower periods. Here's how different property tiers perform in Villaverde:
- Best-in-class properties (Top 10%) achieve 91%+ occupancy, indicating high desirability and potentially optimized availability.
- Strong performing properties (Top 25%) maintain 80% or higher occupancy, suggesting good market fit and guest satisfaction.
- Typical properties (Median) have an occupancy rate around 53%.
- Entry-level properties (Bottom 25%) average 24% occupancy, potentially facing higher vacancy.
Average Monthly Occupancy Rate Trend in Villaverde
Average Daily Rate (ADR) Airbnb Trends in Villaverde (2025)
Effective short term rental pricing strategy in Villaverde involves understanding monthly ADR fluctuations. The Average Daily Rate (ADR) for Airbnb in Villaverde typically peaks in December and dips lowest during May. Leveraging Airbnb dynamic pricing tools or strategies based on this seasonality can significantly boost revenue. Here's a look at the typical nightly rates achieved:
- Best-in-class properties (Top 10%) command rates of $311+ per night, often due to premium features or locations.
- Strong performing properties (Top 25%) achieve nightly rates of $200 or more.
- Typical properties (Median) charge around $99 per night.
- Entry-level properties (Bottom 25%) earn around $64 per night.
Average Daily Rate (ADR) Trend by Month in Villaverde
Get Live Villaverde Market Intelligence 👇

Explore Real-time Analytics
Airbnb Seasonality Analysis & Trends in Villaverde (2025)
Peak Season (December, August, April)
- Revenue averages $2,661 per month
- Occupancy rates average 58.3%
- Daily rates average $146
Shoulder Season
- Revenue averages $2,292 per month
- Occupancy maintains around 53.5%
- Daily rates hold near $146
Low Season (March, June, September)
- Revenue drops to average $1,813 per month
- Occupancy decreases to average 43.8%
- Daily rates adjust to average $144
Seasonality Insights for Villaverde
- The Airbnb seasonality in Villaverde shows moderate seasonality with distinct peak and low periods. While the sections above show seasonal averages, it's also insightful to look at the extremes:
- During the high season, the absolute peak month showcases Villaverde's highest earning potential, with monthly revenues capable of climbing to $2,698, occupancy reaching a high of 64.8%, and ADRs peaking at $148.
- Conversely, the slowest single month of the year, typically falling within the low season, marks the market's lowest point. In this month, revenue might dip to $1,742, occupancy could drop to 40.2%, and ADRs may adjust down to $143.
- Understanding both the seasonal averages and these monthly peaks and troughs in revenue, occupancy, and ADR is crucial for maximizing your Airbnb profit potential in Villaverde.
Seasonal Strategies for Maximizing Profit
- Peak Season: Maximize revenue through premium pricing and potentially longer minimum stays. Ensure high availability.
- Low Season: Offer competitive pricing, special promotions (e.g., extended stay discounts), and flexible cancellation policies. Target off-season travelers like remote workers or budget-conscious guests.
- Shoulder Seasons: Implement dynamic pricing that balances peak and low rates. Target weekend travelers or specific events. Offer slightly more flexible terms than peak season.
- Regularly analyze your own performance against these Villaverde seasonality benchmarks and adjust your pricing and availability strategy accordingly.
Best Areas for Airbnb Investment in Villaverde (2025)
Exploring the top neighborhoods for short-term rentals in Villaverde? This section highlights key areas, outlining why they are attractive for hosts and guests, along with notable local attractions. Consider these locations based on your target guest profile and investment strategy.
| Neighborhood / Area | Why Host Here? (Target Guests & Appeal) | Key Attractions & Landmarks |
|---|---|---|
| Los Cristianos | A popular resort town known for its beautiful beaches and family-friendly atmosphere. It's ideal for tourists looking for amenities and a relaxing seaside experience. | Los Cristianos Beach, Camello Center, Puerto de Los Cristianos, Las Vistas Beach, Nature Monument of Ajuy |
| Playa de las Américas | Famous for its nightlife and entertainment options, this area attracts young travelers looking for fun along with stunning beaches and resorts. | Playa de las Américas Beach, Siam Park, Aqualand Costa Adeje, Veronicas Strip, Torviscas Beach |
| Costa Adeje | An upscale area popular with tourists seeking luxury accommodations and high-end shopping. Perfect for those looking for a premium Airbnb hosting experience. | Playa del Duque, Siam Mall, Jungle Park, La Caleta Beach, El Duque Castle |
| La Laguna | A UNESCO World Heritage site known for its historical architecture and vibrant cultural scene, appealing to tourists interested in history and culture. | Tenerife Auditorium, Pueblo Chico, La Laguna Cathedral, Museum of Science and the Cosmos, Old Town |
| Los Gigantes | Famous for its stunning cliffs and extraordinary views, ideal for tourists looking for scenic beauty and outdoor activities like hiking and boating. | Los Gigantes Cliffs, Marina de Los Gigantes, Playa de Los Gigantes, Punta de Teno, Barranco del Infierno |
| El Médano | A charming beach town popular with windsurfers and kitesurfers, attracting adventure seekers and water sports enthusiasts. | El Médano Beach, Montaña Roja, La Tejita Beach, Torre de El Médano, Wind Surfing |
| Puerto de la Cruz | Known for its gardens and artistic vibe, this area offers a unique experience and is perfect for those wanting a blend of culture and nature. | Lago Martiánez, Botanical Garden, Pueblo Chico, Casa de la Aduana, Orchid Garden |
| Candelaria | A cultural hub known for its basilica and historical significance, attracting visitors interested in spirituality and local culture. | Basilica de Nuestra Señora de Candelaria, Candelaria Beach, Cultural Space - Candelaria, Candelaria’s Market, Plaza de la Patrona de Canarias |
Understanding Airbnb License Requirements & STR Laws in Villaverde (2025)
With 20% of listings showing registration in 2025, understanding potential Airbnb license requirements is crucial in Villaverde. Always verify the latest short term rental regulations and Airbnb license requirements directly with local government authorities for Villaverde to ensure full compliance before hosting.
(Source: AirROI data, 2025, based on 20% licensed listings)
Top Performing Airbnb Properties in Villaverde (2025)
Benchmark your potential! Explore examples of top-performing Airbnb properties in Villaverdebased on Trailing Twelve Month (TTM) revenue. Analyze their characteristics, revenue, occupancy rate, and ADR to understand what drives success in this market.
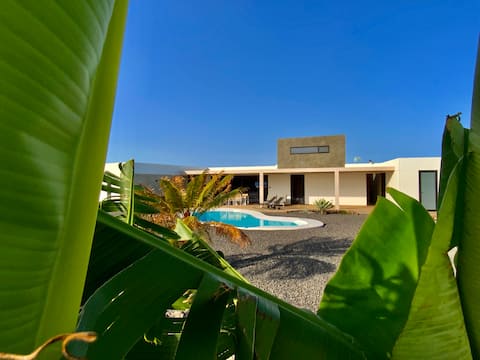
Neonauta 23 - solar heated pool-volcano views
Entire Place • 3 bedrooms
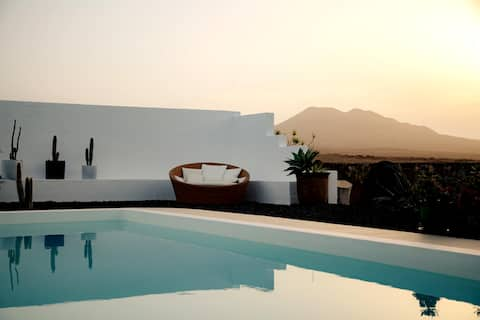
casa guayarmina volcano vews heated pool
Entire Place • 2 bedrooms

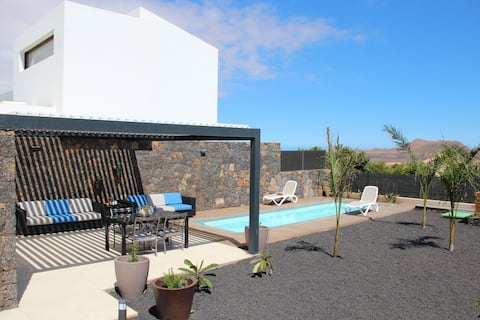
Villa Olimpia with Heated Pool.
Entire Place • 4 bedrooms

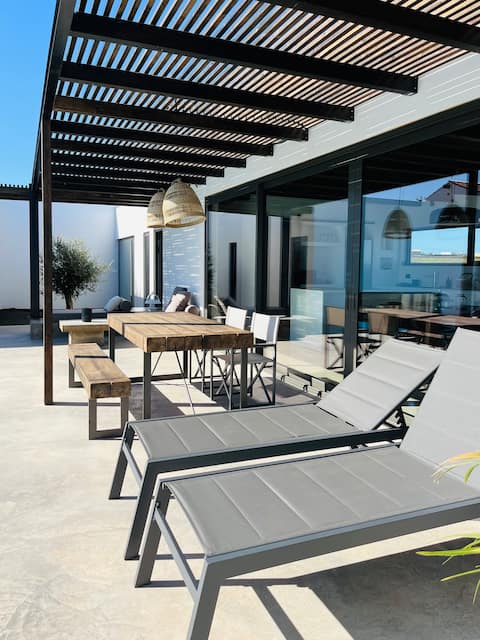
CasaRaphaël : A/C, heated pool, vues, 2km Lajares
Entire Place • 3 bedrooms
Villa La Tabaiba- Bright open spaces, private pool
Entire Place • 2 bedrooms
Villa Borea - AlisiaFuerteventura
Entire Place • 2 bedrooms
Note: Performance varies based on location, size, amenities, seasonality, and management quality. Data reflects the past 12 months.
Top Performing Airbnb Hosts in Villaverde (2025)
Learn from the best! This table showcases top-performing Airbnb hosts in Villaverde based on the number of properties managed and estimated total revenue over the past year. Analyze their scale and performance metrics.
| Host Name | Properties | Grossing Revenue | Stay Reviews | Avg Rating |
|---|---|---|---|---|
| Casa Cocolores | 11 | $135,320 | 123 | 3.54/5.0 |
| Lali | 2 | $121,521 | 127 | 4.91/5.0 |
| Alessia | 3 | $120,371 | 68 | 4.98/5.0 |
| Olga | 3 | $91,311 | 112 | 4.89/5.0 |
| Lucia | 1 | $80,131 | 73 | 4.97/5.0 |
| Marc | 1 | $76,245 | 25 | 4.92/5.0 |
| Gabriel | 1 | $74,989 | 67 | 5.00/5.0 |
| Nora | 1 | $69,373 | 45 | 4.91/5.0 |
| Giovanna | 5 | $64,858 | 18 | 2.79/5.0 |
| Hans | 1 | $62,855 | 41 | 4.85/5.0 |
Analyzing the strategies of top hosts, such as their property selection, pricing, and guest communication, can offer valuable lessons for optimizing your own Airbnb operations in Villaverde.
Dive Deeper: Advanced Villaverde STR Market Data (2025)
Ready to unlock more insights? AirROI provides access to advanced metrics and comprehensive Airbnb data for Villaverde. Explore detailed analytics beyond this report to refine your investment strategy, optimize pricing, and maximize your vacation rental profits.
Explore Advanced MetricsVillaverde Short-Term Rental Market Composition (2025): Property & Room Types
Room Type Distribution
Property Type Distribution
Market Composition Insights for Villaverde
- The Villaverde Airbnb market composition is heavily skewed towards Entire Home/Apt listings, which make up 80% of the 90 active rentals. This indicates strong guest preference for privacy and space.
- Looking at the property type distribution in Villaverde, House properties are the most common (73.3%), reflecting the local real estate landscape.
- Houses represent a significant 73.3% portion, catering likely to families or larger groups.
- The presence of 8.9% Hotel/Boutique listings indicates integration with traditional hospitality.
- Smaller segments like others (combined 2.2%) offer potential for unique stay experiences.
Villaverde Airbnb Room Capacity Analysis (2025): Bedroom Distribution
Distribution of Listings by Number of Bedrooms
Room Capacity Insights for Villaverde
- The dominant room capacity in Villaverde is 1 bedroom listings, making up 36.7% of the market. This suggests a strong demand for properties suitable for couples or solo travelers.
- Together, 1 bedroom and 2 bedrooms properties represent 61.1% of the active Airbnb listings in Villaverde, indicating a high concentration in these sizes.
- A significant 26.6% of listings offer 3+ bedrooms, catering to larger groups and families seeking more space in Villaverde.
Villaverde Vacation Rental Guest Capacity Trends (2025)
Distribution of Listings by Guest Capacity
Guest Capacity Insights for Villaverde
- The most common guest capacity trend in Villaverde vacation rentals is listings accommodating 4 guests (25.6%). This suggests the primary traveler segment is likely small families or groups.
- Properties designed for 4 guests and 2 guests dominate the Villaverde STR market, accounting for 50.0% of listings.
- 25.5% of properties accommodate 6+ guests, serving the market segment for larger families or group travel in Villaverde.
- On average, properties in Villaverde are equipped to host 3.8 guests.
Villaverde Airbnb Booking Patterns (2025): Available vs. Booked Days
Available Days Distribution
Booked Days Distribution
Booking Pattern Insights for Villaverde
- The most common availability pattern in Villaverde falls within the 91-180 days range, representing 31.1% of listings. This suggests many properties have significant open periods on their calendars.
- Approximately 53.3% of listings show high availability (181+ days open annually), indicating potential for increased bookings or specific owner usage patterns.
- For booked days, the 181-270 days range is most frequent in Villaverde (30%), reflecting common guest stay durations or potential owner blocking patterns.
- A notable 46.7% of properties secure long booking periods (181+ days booked per year), highlighting successful long-term rental strategies or significant owner usage.
Villaverde Airbnb Minimum Stay Requirements Analysis
Distribution of Listings by Minimum Night Requirement
1 Night
9 listings
10.8% of total
2 Nights
3 listings
3.6% of total
3 Nights
12 listings
14.5% of total
4-6 Nights
45 listings
54.2% of total
7-29 Nights
7 listings
8.4% of total
30+ Nights
7 listings
8.4% of total
Key Insights
- The most prevalent minimum stay requirement in Villaverde is 4-6 Nights, adopted by 54.2% of listings. This highlights the market's preference for longer commitments.
- Very short stays (1-2 nights) are less common (14.4%), suggesting hosts prefer slightly longer bookings to optimize turnover.
Recommendations
- Align with the market by considering a 4-6 Nights minimum stay, as 54.2% of Villaverde hosts use this setting.
- If feasible, allowing 1-night stays, especially midweek or during low season, could capture last-minute bookings, as only 10.8% currently do.
- Explore offering discounts for stays of 30+ nights to attract the 8.4% of the market seeking extended stays.
- Adjust minimum nights based on seasonality – potentially shorter during low season and longer during peak demand periods in Villaverde.
Villaverde Airbnb Cancellation Policy Trends Analysis (2025)
Flexible
15 listings
19.7% of total
Moderate
17 listings
22.4% of total
Firm
24 listings
31.6% of total
Strict
20 listings
26.3% of total
Cancellation Policy Insights for Villaverde
- The prevailing Airbnb cancellation policy trend in Villaverde is Firm, used by 31.6% of listings.
- A majority (57.9%) of hosts in Villaverde utilize Firm or Strict policies, indicating a market where hosts prioritize booking security.
Recommendations for Hosts
- Consider adopting a Firm policy to align with the 31.6% market standard in Villaverde.
- Regularly review your cancellation policy against competitors and market demand shifts in Villaverde.
Villaverde STR Booking Lead Time Analysis (2025)
Average Booking Lead Time by Month
Booking Lead Time Insights for Villaverde
- The overall average booking lead time for vacation rentals in Villaverde is 69 days.
- Guests book furthest in advance for stays during July (average 102 days), likely coinciding with peak travel demand or local events.
- The shortest booking windows occur for stays in March (average 58 days), indicating more last-minute travel plans during this time.
- Seasonally, Summer (89 days avg.) sees the longest lead times, while Spring (71 days avg.) has the shortest, reflecting typical travel planning cycles.
Recommendations for Hosts
- Use the overall average lead time (69 days) as a baseline for your pricing and availability strategy in Villaverde.
- For July stays, consider implementing length-of-stay discounts or slightly higher rates for bookings made less than 102 days out to capitalize on advance planning.
- Target marketing efforts for the Summer season well in advance (at least 89 days) to capture early planners.
- Monitor your own booking lead times against these Villaverde averages to identify opportunities for dynamic pricing adjustments.
Popular & Essential Airbnb Amenities in Villaverde (2025)
Amenity Prevalence
Amenity Insights for Villaverde
- Essential amenities in Villaverde that guests expect include: Wifi, Kitchen. Lacking these (any) could significantly impact bookings.
- Popular amenities like Hot water, Dishes and silverware, Cooking basics are common but not universal. Offering these can provide a competitive edge.
Recommendations for Hosts
- Ensure your listing includes all essential amenities for Villaverde: Wifi, Kitchen.
- Prioritize adding missing essentials: Kitchen.
- Consider adding popular differentiators like Hot water or Dishes and silverware to increase appeal.
- Highlight unique or less common amenities you offer (e.g., hot tub, dedicated workspace, EV charger) in your listing description and photos.
- Regularly check competitor amenities in Villaverde to stay competitive.
Villaverde Airbnb Guest Demographics & Profile Analysis (2025)
Guest Profile Summary for Villaverde
- The typical guest profile for Airbnb in Villaverde consists of predominantly international visitors (83%), with top international origins including Spain, typically belonging to the Post-2000s (Gen Z/Alpha) group (50%), primarily speaking English or German.
- Domestic travelers account for 17.3% of guests.
- Key international markets include Germany (25.7%) and Spain (17.3%).
- Top languages spoken are English (37.4%) followed by German (17.5%).
- A significant demographic segment is the Post-2000s (Gen Z/Alpha) group, representing 50% of guests.
Recommendations for Hosts
- Focus marketing internationally, particularly towards travelers from Spain.
- Tailor amenities and listing descriptions to appeal to the dominant Post-2000s (Gen Z/Alpha) demographic (e.g., highlight fast WiFi, smart home features, local guides).
- Highlight unique local experiences or amenities relevant to the primary guest profile.
- Consider seasonal promotions aligned with peak travel times for key origin markets.
Nearby Short-Term Rental Market Comparison
How does the Villaverde Airbnb market stack up against its neighbors? Compare key performance metrics like average monthly revenue, ADR, and occupancy rates in surrounding areas to understand the broader regional STR landscape.
| Market | Active Properties | Monthly Revenue | Daily Rate | Avg. Occupancy |
|---|---|---|---|---|
| Yaiza | 1,433 | $2,369 | $242.14 | 50% |
| Lajares | 347 | $2,137 | $169.68 | 53% |
| Tías | 1,491 | $2,055 | $172.05 | 56% |
| Teguise | 1,351 | $1,657 | $127.61 | 56% |
| Haría | 475 | $1,465 | $142.83 | 50% |
| La Oliva | 2,055 | $1,370 | $123.32 | 50% |
| San Bartolomé | 293 | $1,329 | $124.34 | 51% |
| Tinajo | 234 | $1,258 | $124.77 | 51% |
| Antigua | 698 | $1,173 | $111.42 | 48% |
| El Cotillo | 465 | $1,165 | $103.94 | 48% |