Vilaflor Airbnb Market Analysis 2025: Short Term Rental Data & Vacation Rental Statistics in Canary Islands, Spain
Is Airbnb profitable in Vilaflor in 2025? Explore comprehensive Airbnb analytics for Vilaflor, Canary Islands, Spain to uncover income potential. This 2025 STR market report for Vilaflor, based on AirROI data from April 2024 to March 2025, reveals key trends in the niche market of 59 active listings.
Whether you're considering an Airbnb investment in Vilaflor, optimizing your existing vacation rental, or exploring rental arbitrage opportunities, understanding the Vilaflor Airbnb data is crucial. Understanding the local regulations is key to maximizing your short term rental income potential. Let's dive into the specifics.
Key Vilaflor Airbnb Performance Metrics Overview
Monthly Airbnb Revenue Variations & Income Potential in Vilaflor (2025)
Understanding the monthly revenue variations for Airbnb listings in Vilaflor is key to maximizing your short term rental income potential. Seasonality significantly impacts earnings. Our analysis, based on data from the past 12 months, shows that the peak revenue month for STRs in Vilaflor is typically May, while September often presents the lowest earnings, highlighting opportunities for strategic pricing adjustments during shoulder and low seasons. Explore the typical Airbnb income in Vilaflor across different performance tiers:
- Best-in-class properties (Top 10%) achieve $2,728+ monthly, often utilizing dynamic pricing and superior guest experiences.
- Strong performing properties (Top 25%) earn $1,758 or more, indicating effective management and desirable locations/amenities.
- Typical properties (Median) generate around $880 per month, representing the average market performance.
- Entry-level properties (Bottom 25%) see earnings around $457, often with potential for optimization.
Average Monthly Airbnb Earnings Trend in Vilaflor
Vilaflor Airbnb Occupancy Rate Trends (2025)
Maximize your bookings by understanding the Vilaflor STR occupancy trends. Seasonal demand shifts significantly influence how often properties are booked. Typically, Februarysees the highest demand (peak season occupancy), while July experiences the lowest (low season). Effective strategies, like adjusting minimum stays or offering promotions, can boost occupancy during slower periods. Here's how different property tiers perform in Vilaflor:
- Best-in-class properties (Top 10%) achieve 76%+ occupancy, indicating high desirability and potentially optimized availability.
- Strong performing properties (Top 25%) maintain 51% or higher occupancy, suggesting good market fit and guest satisfaction.
- Typical properties (Median) have an occupancy rate around 31%.
- Entry-level properties (Bottom 25%) average 17% occupancy, potentially facing higher vacancy.
Average Monthly Occupancy Rate Trend in Vilaflor
Average Daily Rate (ADR) Airbnb Trends in Vilaflor (2025)
Effective short term rental pricing strategy in Vilaflor involves understanding monthly ADR fluctuations. The Average Daily Rate (ADR) for Airbnb in Vilaflor typically peaks in December and dips lowest during August. Leveraging Airbnb dynamic pricing tools or strategies based on this seasonality can significantly boost revenue. Here's a look at the typical nightly rates achieved:
- Best-in-class properties (Top 10%) command rates of $162+ per night, often due to premium features or locations.
- Strong performing properties (Top 25%) achieve nightly rates of $123 or more.
- Typical properties (Median) charge around $93 per night.
- Entry-level properties (Bottom 25%) earn around $65 per night.
Average Daily Rate (ADR) Trend by Month in Vilaflor
Get Live Vilaflor Market Intelligence 👇

Explore Real-time Analytics
Airbnb Seasonality Analysis & Trends in Vilaflor (2025)
Peak Season (May, December, February)
- Revenue averages $1,872 per month
- Occupancy rates average 43.0%
- Daily rates average $119
Shoulder Season
- Revenue averages $1,451 per month
- Occupancy maintains around 38.1%
- Daily rates hold near $116
Low Season (July, September, October)
- Revenue drops to average $819 per month
- Occupancy decreases to average 27.3%
- Daily rates adjust to average $113
Seasonality Insights for Vilaflor
- The Airbnb seasonality in Vilaflor shows highly seasonal trends requiring careful strategy. While the sections above show seasonal averages, it's also insightful to look at the extremes:
- During the high season, the absolute peak month showcases Vilaflor's highest earning potential, with monthly revenues capable of climbing to $2,015, occupancy reaching a high of 53.4%, and ADRs peaking at $126.
- Conversely, the slowest single month of the year, typically falling within the low season, marks the market's lowest point. In this month, revenue might dip to $740, occupancy could drop to 24.8%, and ADRs may adjust down to $111.
- Understanding both the seasonal averages and these monthly peaks and troughs in revenue, occupancy, and ADR is crucial for maximizing your Airbnb profit potential in Vilaflor.
Seasonal Strategies for Maximizing Profit
- Peak Season: Maximize revenue through premium pricing and potentially longer minimum stays. Ensure high availability.
- Low Season: Offer competitive pricing, special promotions (e.g., extended stay discounts), and flexible cancellation policies. Target off-season travelers like remote workers or budget-conscious guests.
- Shoulder Seasons: Implement dynamic pricing that balances peak and low rates. Target weekend travelers or specific events. Offer slightly more flexible terms than peak season.
- Regularly analyze your own performance against these Vilaflor seasonality benchmarks and adjust your pricing and availability strategy accordingly.
Best Areas for Airbnb Investment in Vilaflor (2025)
Exploring the top neighborhoods for short-term rentals in Vilaflor? This section highlights key areas, outlining why they are attractive for hosts and guests, along with notable local attractions. Consider these locations based on your target guest profile and investment strategy.
| Neighborhood / Area | Why Host Here? (Target Guests & Appeal) | Key Attractions & Landmarks |
|---|---|---|
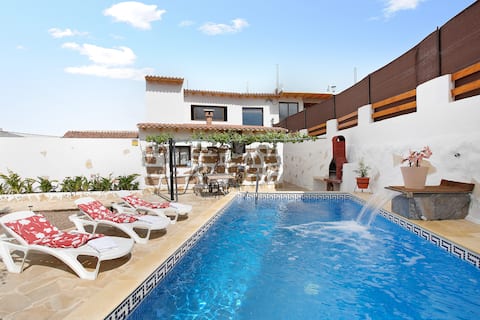
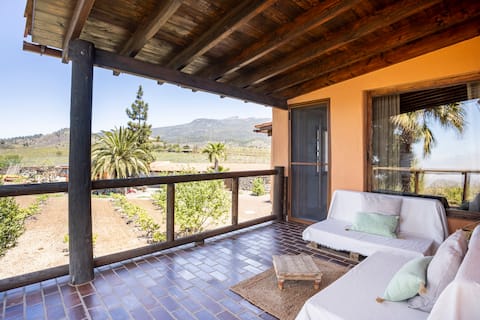
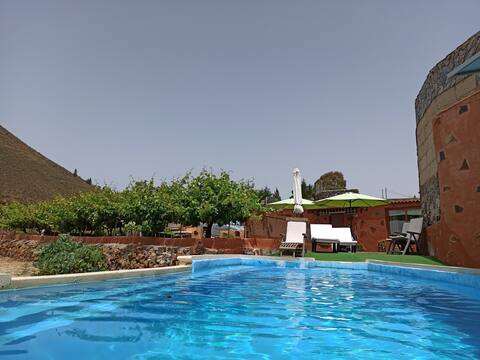
| Los Roques | A scenic area known for its beautiful view of the mountains and proximity to hiking trails. An ideal spot for nature enthusiasts and travelers seeking tranquility. | Teide National Park, Pico del Teide, Montaña Chayofita, Cañadas del Teide, Mirador de La Fortaleza |
| Vilaflor Town Center | The charming center of Vilaflor offers a blend of local culture, restaurants, and traditional Canarian architecture. Perfect for visitors who want to immerse themselves in local life. | Church of San Pedro, Vilaflor Square, Local artisan shops, Restaurants serving Canarian dishes |
| Cañadas del Teide | This national park area is known for its stunning volcanic landscapes and diverse ecosystems. A hotspot for adventure tourism, perfect for hiking and sightseeing. | Cable car to Pico del Teide, Volcanic landscapes, Hiking trails, Stargazing opportunities |
| Las Lajas | A tranquil area surrounded by nature, ideal for those seeking peace away from the busy tourist spots. It attracts visitors looking for relaxation and nature. | Local hiking routes, Natural beauty, Bird watching opportunities |
| El Sombrero | Known for its pine forest and serene environment, this area is perfect for visitors who love outdoor activities like hiking and biking. | Pine forest walks, Nature trails, Views of the surrounding mountains |
| Guía de Isora | Not far from Vilaflor, this area is known for its beautiful coastal views and access to beaches, drawing tourists from all over. | Beaches of Guía de Isora, Coastal restaurants, Water sports opportunities |
| Los Silos | A small village that showcases traditional Canarian life, known for its quiet charm and beautiful landscapes, attracting guests looking for an authentic experience. | Charming village streets, Local festivals, Historical sites |
| Adeje | A bit further afield, Adeje offers a mix of beach life and local culture, making it a desirable area for tourists looking for a balanced vacation experience. | Playa del Duque, Water parks, Adeje's local markets |
Understanding Airbnb License Requirements & STR Laws in Vilaflor (2025)
With 25% of listings showing registration in 2025, understanding potential Airbnb license requirements is crucial in Vilaflor. Always verify the latest short term rental regulations and Airbnb license requirements directly with local government authorities for Vilaflor to ensure full compliance before hosting.
(Source: AirROI data, 2025, based on 25% licensed listings)
Top Performing Airbnb Properties in Vilaflor (2025)
Benchmark your potential! Explore examples of top-performing Airbnb properties in Vilaflorbased on Trailing Twelve Month (TTM) revenue. Analyze their characteristics, revenue, occupancy rate, and ADR to understand what drives success in this market.

Casa Tajinaste
Entire Place • 6 bedrooms
Keyfer farm
Entire Place • 3 bedrooms

Casa Rural Finca Paraiso. Heated pool
Entire Place • 2 bedrooms
Finca Vilaflor - The loft
Entire Place • 1 bedroom

The Lemon Tree
Entire Place • N/A
Finca vacation home of grandparents
Entire Place • 2 bedrooms
Note: Performance varies based on location, size, amenities, seasonality, and management quality. Data reflects the past 12 months.
Top Performing Airbnb Hosts in Vilaflor (2025)
Learn from the best! This table showcases top-performing Airbnb hosts in Vilaflor based on the number of properties managed and estimated total revenue over the past year. Analyze their scale and performance metrics.
| Host Name | Properties | Grossing Revenue | Stay Reviews | Avg Rating |
|---|---|---|---|---|
| Américo | 10 | $133,104 | 291 | 2.97/5.0 |
| Holidu | 1 | $83,763 | 11 | 5.00/5.0 |
| Raquel And Andrew | 3 | $75,842 | 436 | 4.96/5.0 |
| Ian | 8 | $54,165 | 20 | 1.82/5.0 |
| Holidu | 1 | $52,549 | 8 | 4.63/5.0 |
| Elena | 10 | $48,278 | 273 | 3.29/5.0 |
| Sergi Y Félix | 1 | $34,962 | 50 | 4.96/5.0 |
| Deihu Social Club | 2 | $31,429 | 14 | 4.20/5.0 |
| Club Paraiso Del Sol | 2 | $30,870 | 8 | 2.44/5.0 |
| Kim | 1 | $27,381 | 94 | 4.89/5.0 |
Analyzing the strategies of top hosts, such as their property selection, pricing, and guest communication, can offer valuable lessons for optimizing your own Airbnb operations in Vilaflor.
Dive Deeper: Advanced Vilaflor STR Market Data (2025)
Ready to unlock more insights? AirROI provides access to advanced metrics and comprehensive Airbnb data for Vilaflor. Explore detailed analytics beyond this report to refine your investment strategy, optimize pricing, and maximize your vacation rental profits.
Explore Advanced MetricsVilaflor Short-Term Rental Market Composition (2025): Property & Room Types
Room Type Distribution
Property Type Distribution
Market Composition Insights for Vilaflor
- The Vilaflor Airbnb market composition is heavily skewed towards Entire Home/Apt listings, which make up 64.4% of the 59 active rentals. This indicates strong guest preference for privacy and space.
- However, a notable 33.9% share for Private Rooms suggests opportunities for budget-conscious travelers or hosts renting out spare rooms.
- Looking at the property type distribution in Vilaflor, Apartment/Condo properties are the most common (42.4%), reflecting the local real estate landscape.
- Houses represent a significant 25.4% portion, catering likely to families or larger groups.
- The presence of 25.4% Hotel/Boutique listings indicates integration with traditional hospitality.
Vilaflor Airbnb Room Capacity Analysis (2025): Bedroom Distribution
Distribution of Listings by Number of Bedrooms
Room Capacity Insights for Vilaflor
- The dominant room capacity in Vilaflor is 1 bedroom listings, making up 45.8% of the market. This suggests a strong demand for properties suitable for couples or solo travelers.
- Together, 1 bedroom and 2 bedrooms properties represent 64.4% of the active Airbnb listings in Vilaflor, indicating a high concentration in these sizes.
Vilaflor Vacation Rental Guest Capacity Trends (2025)
Distribution of Listings by Guest Capacity
Guest Capacity Insights for Vilaflor
- The most common guest capacity trend in Vilaflor vacation rentals is listings accommodating 2 guests (39%). This suggests the primary traveler segment is likely couples or solo travelers.
- Properties designed for 2 guests and 6 guests dominate the Vilaflor STR market, accounting for 57.6% of listings.
- A significant 42.4% of listings cater specifically to 1-2 guests, highlighting strong demand from couples and solo travelers in Vilaflor.
- 25.4% of properties accommodate 6+ guests, serving the market segment for larger families or group travel in Vilaflor.
- On average, properties in Vilaflor are equipped to host 3.3 guests.
Vilaflor Airbnb Booking Patterns (2025): Available vs. Booked Days
Available Days Distribution
Booked Days Distribution
Booking Pattern Insights for Vilaflor
- The most common availability pattern in Vilaflor falls within the 271-366 days range, representing 57.6% of listings. This suggests many properties have significant open periods on their calendars.
- Approximately 77.9% of listings show high availability (181+ days open annually), indicating potential for increased bookings or specific owner usage patterns.
- For booked days, the 31-90 days range is most frequent in Vilaflor (49.2%), reflecting common guest stay durations or potential owner blocking patterns.
- A notable 22.1% of properties secure long booking periods (181+ days booked per year), highlighting successful long-term rental strategies or significant owner usage.
Vilaflor Airbnb Minimum Stay Requirements Analysis
Distribution of Listings by Minimum Night Requirement
1 Night
18 listings
31.6% of total
2 Nights
14 listings
24.6% of total
3 Nights
10 listings
17.5% of total
4-6 Nights
7 listings
12.3% of total
7-29 Nights
1 listings
1.8% of total
30+ Nights
7 listings
12.3% of total
Key Insights
- The most prevalent minimum stay requirement in Vilaflor is 1 Night, adopted by 31.6% of listings. This highlights the market's preference for shorter, flexible bookings.
- A significant segment (12.3%) caters to monthly stays (30+ nights) in Vilaflor, pointing to opportunities in the extended-stay market.
Recommendations
- Align with the market by considering a 1 Night minimum stay, as 31.6% of Vilaflor hosts use this setting.
- Explore offering discounts for stays of 30+ nights to attract the 12.3% of the market seeking extended stays.
- Adjust minimum nights based on seasonality – potentially shorter during low season and longer during peak demand periods in Vilaflor.
Vilaflor Airbnb Cancellation Policy Trends Analysis (2025)
Super Strict 30 Days
1 listings
2.3% of total
Flexible
12 listings
27.3% of total
Moderate
15 listings
34.1% of total
Firm
3 listings
6.8% of total
Strict
13 listings
29.5% of total
Cancellation Policy Insights for Vilaflor
- The prevailing Airbnb cancellation policy trend in Vilaflor is Moderate, used by 34.1% of listings.
- There's a relatively balanced mix between guest-friendly (61.4%) and stricter (36.3%) policies, offering choices for different guest needs.
Recommendations for Hosts
- Consider adopting a Moderate policy to align with the 34.1% market standard in Vilaflor.
- Regularly review your cancellation policy against competitors and market demand shifts in Vilaflor.
Vilaflor STR Booking Lead Time Analysis (2025)
Average Booking Lead Time by Month
Booking Lead Time Insights for Vilaflor
- The overall average booking lead time for vacation rentals in Vilaflor is 49 days.
- Guests book furthest in advance for stays during June (average 72 days), likely coinciding with peak travel demand or local events.
- The shortest booking windows occur for stays in January (average 49 days), indicating more last-minute travel plans during this time.
- Seasonally, Summer (64 days avg.) sees the longest lead times, while Fall (52 days avg.) has the shortest, reflecting typical travel planning cycles.
Recommendations for Hosts
- Use the overall average lead time (49 days) as a baseline for your pricing and availability strategy in Vilaflor.
- For June stays, consider implementing length-of-stay discounts or slightly higher rates for bookings made less than 72 days out to capitalize on advance planning.
- Target marketing efforts for the Summer season well in advance (at least 64 days) to capture early planners.
- Monitor your own booking lead times against these Vilaflor averages to identify opportunities for dynamic pricing adjustments.
Popular & Essential Airbnb Amenities in Vilaflor (2025)
Amenity Prevalence
Amenity Insights for Vilaflor
- Essential amenities in Vilaflor that guests expect include: Wifi. Lacking these (this) could significantly impact bookings.
- Popular amenities like Hair dryer, Hot water, Kitchen are common but not universal. Offering these can provide a competitive edge.
Recommendations for Hosts
- Ensure your listing includes all essential amenities for Vilaflor: Wifi.
- Prioritize adding missing essentials: Wifi.
- Consider adding popular differentiators like Hair dryer or Hot water to increase appeal.
- Highlight unique or less common amenities you offer (e.g., hot tub, dedicated workspace, EV charger) in your listing description and photos.
- Regularly check competitor amenities in Vilaflor to stay competitive.
Vilaflor Airbnb Guest Demographics & Profile Analysis (2025)
Guest Profile Summary for Vilaflor
- The typical guest profile for Airbnb in Vilaflor consists of predominantly international visitors (92%), with top international origins including United Kingdom, typically belonging to the Post-2000s (Gen Z/Alpha) group (50%), primarily speaking English or French.
- Domestic travelers account for 8.5% of guests.
- Key international markets include France (19.4%) and United Kingdom (16.9%).
- Top languages spoken are English (39.7%) followed by French (14.8%).
- A significant demographic segment is the Post-2000s (Gen Z/Alpha) group, representing 50% of guests.
Recommendations for Hosts
- Focus marketing internationally, particularly towards travelers from United Kingdom.
- Tailor amenities and listing descriptions to appeal to the dominant Post-2000s (Gen Z/Alpha) demographic (e.g., highlight fast WiFi, smart home features, local guides).
- Highlight unique local experiences or amenities relevant to the primary guest profile.
- Consider seasonal promotions aligned with peak travel times for key origin markets.
Nearby Short-Term Rental Market Comparison
How does the Vilaflor Airbnb market stack up against its neighbors? Compare key performance metrics like average monthly revenue, ADR, and occupancy rates in surrounding areas to understand the broader regional STR landscape.
| Market | Active Properties | Monthly Revenue | Daily Rate | Avg. Occupancy |
|---|---|---|---|---|
| El Sauzal | 94 | $2,759 | $231.94 | 52% |
| La Victoria de Acentejo | 18 | $2,591 | $227.75 | 54% |
| Santa Úrsula | 134 | $2,276 | $200.12 | 49% |
| Adeje | 3,043 | $2,203 | $189.97 | 51% |
| San Miguel de Abona | 666 | $1,918 | $173.37 | 49% |
| El Rosario | 227 | $1,846 | $140.14 | 56% |
| San Bartolomé de Tirajana | 2,717 | $1,640 | $155.10 | 48% |
| Los Realejos | 263 | $1,626 | $119.12 | 54% |
| Santiago del Teide | 773 | $1,616 | $140.24 | 50% |
| La Orotava | 267 | $1,614 | $133.19 | 51% |