Santa Lucía de Tirajana Airbnb Market Analysis 2025: Short Term Rental Data & Vacation Rental Statistics in Canary Islands, Spain
Is Airbnb profitable in Santa Lucía de Tirajana in 2025? Explore comprehensive Airbnb analytics for Santa Lucía de Tirajana, Canary Islands, Spain to uncover income potential. This 2025 STR market report for Santa Lucía de Tirajana, based on AirROI data from April 2024 to March 2025, reveals key trends in the market of 223 active listings.
Whether you're considering an Airbnb investment in Santa Lucía de Tirajana, optimizing your existing vacation rental, or exploring rental arbitrage opportunities, understanding the Santa Lucía de Tirajana Airbnb data is crucial. Understanding the local regulations is key to maximizing your short term rental income potential. Let's dive into the specifics.
Key Santa Lucía de Tirajana Airbnb Performance Metrics Overview
Monthly Airbnb Revenue Variations & Income Potential in Santa Lucía de Tirajana (2025)
Understanding the monthly revenue variations for Airbnb listings in Santa Lucía de Tirajana is key to maximizing your short term rental income potential. Seasonality significantly impacts earnings. Our analysis, based on data from the past 12 months, shows that the peak revenue month for STRs in Santa Lucía de Tirajana is typically February, while September often presents the lowest earnings, highlighting opportunities for strategic pricing adjustments during shoulder and low seasons. Explore the typical Airbnb income in Santa Lucía de Tirajana across different performance tiers:
- Best-in-class properties (Top 10%) achieve $2,479+ monthly, often utilizing dynamic pricing and superior guest experiences.
- Strong performing properties (Top 25%) earn $1,638 or more, indicating effective management and desirable locations/amenities.
- Typical properties (Median) generate around $988 per month, representing the average market performance.
- Entry-level properties (Bottom 25%) see earnings around $468, often with potential for optimization.
Average Monthly Airbnb Earnings Trend in Santa Lucía de Tirajana
Santa Lucía de Tirajana Airbnb Occupancy Rate Trends (2025)
Maximize your bookings by understanding the Santa Lucía de Tirajana STR occupancy trends. Seasonal demand shifts significantly influence how often properties are booked. Typically, Februarysees the highest demand (peak season occupancy), while May experiences the lowest (low season). Effective strategies, like adjusting minimum stays or offering promotions, can boost occupancy during slower periods. Here's how different property tiers perform in Santa Lucía de Tirajana:
- Best-in-class properties (Top 10%) achieve 85%+ occupancy, indicating high desirability and potentially optimized availability.
- Strong performing properties (Top 25%) maintain 71% or higher occupancy, suggesting good market fit and guest satisfaction.
- Typical properties (Median) have an occupancy rate around 45%.
- Entry-level properties (Bottom 25%) average 22% occupancy, potentially facing higher vacancy.
Average Monthly Occupancy Rate Trend in Santa Lucía de Tirajana
Average Daily Rate (ADR) Airbnb Trends in Santa Lucía de Tirajana (2025)
Effective short term rental pricing strategy in Santa Lucía de Tirajana involves understanding monthly ADR fluctuations. The Average Daily Rate (ADR) for Airbnb in Santa Lucía de Tirajana typically peaks in December and dips lowest during April. Leveraging Airbnb dynamic pricing tools or strategies based on this seasonality can significantly boost revenue. Here's a look at the typical nightly rates achieved:
- Best-in-class properties (Top 10%) command rates of $141+ per night, often due to premium features or locations.
- Strong performing properties (Top 25%) achieve nightly rates of $97 or more.
- Typical properties (Median) charge around $68 per night.
- Entry-level properties (Bottom 25%) earn around $48 per night.
Average Daily Rate (ADR) Trend by Month in Santa Lucía de Tirajana
Get Live Santa Lucía de Tirajana Market Intelligence 👇

Explore Real-time Analytics
Airbnb Seasonality Analysis & Trends in Santa Lucía de Tirajana (2025)
Peak Season (February, January, December)
- Revenue averages $1,621 per month
- Occupancy rates average 62.2%
- Daily rates average $96
Shoulder Season
- Revenue averages $1,230 per month
- Occupancy maintains around 44.6%
- Daily rates hold near $93
Low Season (May, September, October)
- Revenue drops to average $1,007 per month
- Occupancy decreases to average 36.8%
- Daily rates adjust to average $93
Seasonality Insights for Santa Lucía de Tirajana
- The Airbnb seasonality in Santa Lucía de Tirajana shows moderate seasonality with distinct peak and low periods. While the sections above show seasonal averages, it's also insightful to look at the extremes:
- During the high season, the absolute peak month showcases Santa Lucía de Tirajana's highest earning potential, with monthly revenues capable of climbing to $1,643, occupancy reaching a high of 69.0%, and ADRs peaking at $99.
- Conversely, the slowest single month of the year, typically falling within the low season, marks the market's lowest point. In this month, revenue might dip to $971, occupancy could drop to 31.5%, and ADRs may adjust down to $90.
- Understanding both the seasonal averages and these monthly peaks and troughs in revenue, occupancy, and ADR is crucial for maximizing your Airbnb profit potential in Santa Lucía de Tirajana.
Seasonal Strategies for Maximizing Profit
- Peak Season: Maximize revenue through premium pricing and potentially longer minimum stays. Ensure high availability.
- Low Season: Offer competitive pricing, special promotions (e.g., extended stay discounts), and flexible cancellation policies. Target off-season travelers like remote workers or budget-conscious guests.
- Shoulder Seasons: Implement dynamic pricing that balances peak and low rates. Target weekend travelers or specific events. Offer slightly more flexible terms than peak season.
- Regularly analyze your own performance against these Santa Lucía de Tirajana seasonality benchmarks and adjust your pricing and availability strategy accordingly.
Best Areas for Airbnb Investment in Santa Lucía de Tirajana (2025)
Exploring the top neighborhoods for short-term rentals in Santa Lucía de Tirajana? This section highlights key areas, outlining why they are attractive for hosts and guests, along with notable local attractions. Consider these locations based on your target guest profile and investment strategy.
| Neighborhood / Area | Why Host Here? (Target Guests & Appeal) | Key Attractions & Landmarks |
|---|---|---|
| Maspalomas | Famous for its stunning dunes and beautiful beaches, Maspalomas is a top destination for families and couples seeking relaxation and outdoor activities. It also offers a vibrant nightlife and plenty of dining options. | Maspalomas Dunes, Maspalomas Lighthouse, Aqualand Maspalomas, Palmitos Park, Meloneras Beach |
| Meloneras | An upscale area known for luxury resorts and shopping, Meloneras attracts affluent travelers looking for a sophisticated beach experience with fine dining and a relaxed atmosphere. | Meloneras Beach, Boulevard El Faro, Golf Costa Adeje, Spa and wellness centers, Shopping centers |
| San Agustín | A quieter beach destination compared to Playa del Inglés, San Agustín offers a more laid-back environment perfect for those looking for a relaxing vacation, ideal for families and older couples. | San Agustín Beach, Playa del Águila, Dunas de Maspalomas, Local restaurants and cafes, Las Burras Beach |
| Playa del Inglés | A bustling tourist hub known for its vibrant nightlife and entertainment options. Located close to the iconic dunes, it's perfect for younger travelers and those looking for fun and social experiences. | Playa del Inglés Beach, Yumbo Centrum, Dunes of Maspalomas, Kasbah Shopping Center, Aqualand Maspalomas |
| Ayagaures | A charming inland village offering breathtaking views, hiking opportunities, and a taste of local Canarian culture. Attracts those who prefer a more rustic and peaceful getaway. | Ayagaures Reservoir, Hiking trails, Traditional Canarian architecture, Local eateries and markets |
| Tarajalillo | A lesser-known beach area that's perfect for travelers seeking tranquility away from the crowded tourist spots. Ideal for relaxation and enjoying the natural beauty of the Canaries. | Tarajalillo Beach, Natural pools, Scenic walking paths, Quiet local beaches |
| El Salobre | Nestled in the mountains, El Salobre is famous for its luxury villas and golf courses. It draws high-end travelers looking for peace, privacy, and beautiful views of the island. | Salobre Golf Course, Luxury resorts, Mountain views, Spa services, Close to hiking trails |
| Sotavento Beach | A stunning beach known for its watersports and beautiful scenery. A favorite among surfers and kitesurfers, it attracts adventure seekers looking for an active beach experience. | Sotavento Beach, Kitesurfing spots, Water sports schools, Beach bars and restaurants, Scenic views |
Understanding Airbnb License Requirements & STR Laws in Santa Lucía de Tirajana (2025)
With 26% of listings showing registration in 2025, understanding potential Airbnb license requirements is crucial in Santa Lucía de Tirajana. Always verify the latest short term rental regulations and Airbnb license requirements directly with local government authorities for Santa Lucía de Tirajana to ensure full compliance before hosting.
(Source: AirROI data, 2025, based on 26% licensed listings)
Top Performing Airbnb Properties in Santa Lucía de Tirajana (2025)
Benchmark your potential! Explore examples of top-performing Airbnb properties in Santa Lucía de Tirajanabased on Trailing Twelve Month (TTM) revenue. Analyze their characteristics, revenue, occupancy rate, and ADR to understand what drives success in this market.

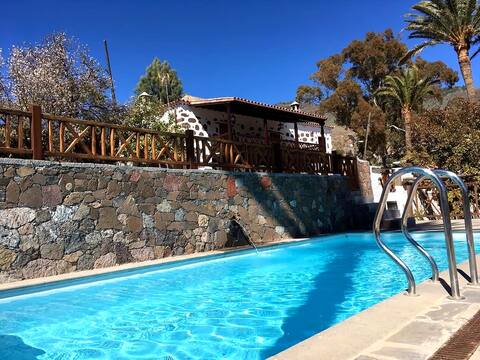
Bohemian Hideaway private finca for max. 10 guests
Entire Place • 4 bedrooms
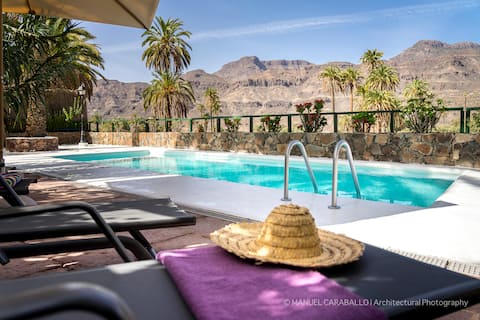
Casa Rural La Longuera de Tirajana
Entire Place • 3 bedrooms
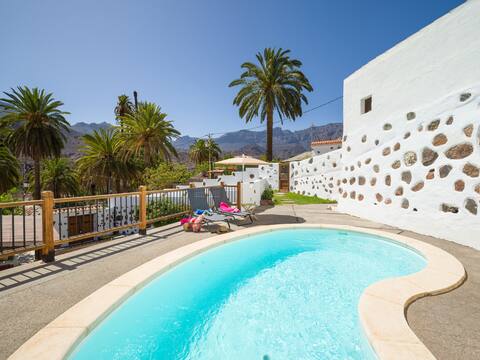
Relaxation, spacious barbecue and pool in St Lucia
Entire Place • 3 bedrooms
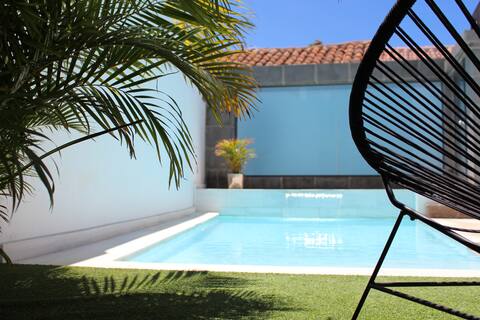
Casa Rural Cercado De Don Paco
Entire Place • 2 bedrooms
Allureh Emblematic Lodging
Entire Place • 2 bedrooms
El Pajar, Bohemian Hideaway rural retreat
Entire Place • 2 bedrooms
Note: Performance varies based on location, size, amenities, seasonality, and management quality. Data reflects the past 12 months.
Top Performing Airbnb Hosts in Santa Lucía de Tirajana (2025)
Learn from the best! This table showcases top-performing Airbnb hosts in Santa Lucía de Tirajana based on the number of properties managed and estimated total revenue over the past year. Analyze their scale and performance metrics.
| Host Name | Properties | Grossing Revenue | Stay Reviews | Avg Rating |
|---|---|---|---|---|
| Xeph | 3 | $169,425 | 191 | 4.91/5.0 |
| Click & Guest | 7 | $103,441 | 185 | 4.71/5.0 |
| Alicia | 8 | $91,112 | 219 | 4.57/5.0 |
| Juan | 12 | $77,764 | 386 | 4.50/5.0 |
| Antonio Francisco | 4 | $77,340 | 22 | 2.35/5.0 |
| Agellus | 1 | $66,432 | 65 | 4.91/5.0 |
| Yolanda | 13 | $64,110 | 644 | 4.37/5.0 |
| Laura | 2 | $62,692 | 163 | 4.92/5.0 |
| Maria Del Carmen | 2 | $60,333 | 59 | 4.93/5.0 |
| Ana María | 1 | $55,096 | 73 | 4.96/5.0 |
Analyzing the strategies of top hosts, such as their property selection, pricing, and guest communication, can offer valuable lessons for optimizing your own Airbnb operations in Santa Lucía de Tirajana.
Dive Deeper: Advanced Santa Lucía de Tirajana STR Market Data (2025)
Ready to unlock more insights? AirROI provides access to advanced metrics and comprehensive Airbnb data for Santa Lucía de Tirajana. Explore detailed analytics beyond this report to refine your investment strategy, optimize pricing, and maximize your vacation rental profits.
Explore Advanced MetricsSanta Lucía de Tirajana Short-Term Rental Market Composition (2025): Property & Room Types
Room Type Distribution
Property Type Distribution
Market Composition Insights for Santa Lucía de Tirajana
- The Santa Lucía de Tirajana Airbnb market composition is heavily skewed towards Entire Home/Apt listings, which make up 83% of the 223 active rentals. This indicates strong guest preference for privacy and space.
- Looking at the property type distribution in Santa Lucía de Tirajana, Apartment/Condo properties are the most common (54.3%), reflecting the local real estate landscape.
- Houses represent a significant 38.6% portion, catering likely to families or larger groups.
- Smaller segments like hotel/boutique, outdoor/unique (combined 7.1%) offer potential for unique stay experiences.
Santa Lucía de Tirajana Airbnb Room Capacity Analysis (2025): Bedroom Distribution
Distribution of Listings by Number of Bedrooms
Room Capacity Insights for Santa Lucía de Tirajana
- The dominant room capacity in Santa Lucía de Tirajana is 2 bedrooms listings, making up 38.1% of the market. This suggests a strong demand for properties suitable for couples or solo travelers.
- Together, 2 bedrooms and 1 bedroom properties represent 71.3% of the active Airbnb listings in Santa Lucía de Tirajana, indicating a high concentration in these sizes.
Santa Lucía de Tirajana Vacation Rental Guest Capacity Trends (2025)
Distribution of Listings by Guest Capacity
Guest Capacity Insights for Santa Lucía de Tirajana
- The most common guest capacity trend in Santa Lucía de Tirajana vacation rentals is listings accommodating 4 guests (27.4%). This suggests the primary traveler segment is likely small families or groups.
- Properties designed for 4 guests and 2 guests dominate the Santa Lucía de Tirajana STR market, accounting for 47.6% of listings.
- 12.5% of properties accommodate 6+ guests, serving the market segment for larger families or group travel in Santa Lucía de Tirajana.
- On average, properties in Santa Lucía de Tirajana are equipped to host 3.4 guests.
Santa Lucía de Tirajana Airbnb Booking Patterns (2025): Available vs. Booked Days
Available Days Distribution
Booked Days Distribution
Booking Pattern Insights for Santa Lucía de Tirajana
- The most common availability pattern in Santa Lucía de Tirajana falls within the 271-366 days range, representing 46.2% of listings. This suggests many properties have significant open periods on their calendars.
- Approximately 73.1% of listings show high availability (181+ days open annually), indicating potential for increased bookings or specific owner usage patterns.
- For booked days, the 31-90 days range is most frequent in Santa Lucía de Tirajana (27.4%), reflecting common guest stay durations or potential owner blocking patterns.
- A notable 28.2% of properties secure long booking periods (181+ days booked per year), highlighting successful long-term rental strategies or significant owner usage.
Santa Lucía de Tirajana Airbnb Minimum Stay Requirements Analysis
Distribution of Listings by Minimum Night Requirement
1 Night
49 listings
23.1% of total
2 Nights
36 listings
17% of total
3 Nights
41 listings
19.3% of total
4-6 Nights
55 listings
25.9% of total
7-29 Nights
5 listings
2.4% of total
30+ Nights
26 listings
12.3% of total
Key Insights
- The most prevalent minimum stay requirement in Santa Lucía de Tirajana is 4-6 Nights, adopted by 25.9% of listings. This highlights the market's preference for longer commitments.
- A significant segment (12.3%) caters to monthly stays (30+ nights) in Santa Lucía de Tirajana, pointing to opportunities in the extended-stay market.
Recommendations
- Align with the market by considering a 4-6 Nights minimum stay, as 25.9% of Santa Lucía de Tirajana hosts use this setting.
- If feasible, allowing 1-night stays, especially midweek or during low season, could capture last-minute bookings, as only 23.1% currently do.
- Explore offering discounts for stays of 30+ nights to attract the 12.3% of the market seeking extended stays.
- Adjust minimum nights based on seasonality – potentially shorter during low season and longer during peak demand periods in Santa Lucía de Tirajana.
Santa Lucía de Tirajana Airbnb Cancellation Policy Trends Analysis (2025)
Super Strict 30 Days
2 listings
1% of total
Flexible
53 listings
26% of total
Moderate
55 listings
27% of total
Firm
45 listings
22.1% of total
Strict
49 listings
24% of total
Cancellation Policy Insights for Santa Lucía de Tirajana
- The prevailing Airbnb cancellation policy trend in Santa Lucía de Tirajana is Moderate, used by 27% of listings.
- There's a relatively balanced mix between guest-friendly (53.0%) and stricter (46.1%) policies, offering choices for different guest needs.
Recommendations for Hosts
- Consider adopting a Moderate policy to align with the 27% market standard in Santa Lucía de Tirajana.
- Regularly review your cancellation policy against competitors and market demand shifts in Santa Lucía de Tirajana.
Santa Lucía de Tirajana STR Booking Lead Time Analysis (2025)
Average Booking Lead Time by Month
Booking Lead Time Insights for Santa Lucía de Tirajana
- The overall average booking lead time for vacation rentals in Santa Lucía de Tirajana is 56 days.
- Guests book furthest in advance for stays during February (average 78 days), likely coinciding with peak travel demand or local events.
- The shortest booking windows occur for stays in October (average 50 days), indicating more last-minute travel plans during this time.
- Seasonally, Winter (71 days avg.) sees the longest lead times, while Spring (57 days avg.) has the shortest, reflecting typical travel planning cycles.
Recommendations for Hosts
- Use the overall average lead time (56 days) as a baseline for your pricing and availability strategy in Santa Lucía de Tirajana.
- For February stays, consider implementing length-of-stay discounts or slightly higher rates for bookings made less than 78 days out to capitalize on advance planning.
- Target marketing efforts for the Winter season well in advance (at least 71 days) to capture early planners.
- Monitor your own booking lead times against these Santa Lucía de Tirajana averages to identify opportunities for dynamic pricing adjustments.
Popular & Essential Airbnb Amenities in Santa Lucía de Tirajana (2025)
Amenity Prevalence
Amenity Insights for Santa Lucía de Tirajana
- Essential amenities in Santa Lucía de Tirajana that guests expect include: Kitchen, Wifi. Lacking these (any) could significantly impact bookings.
- Popular amenities like Essentials, Dishes and silverware, Washer are common but not universal. Offering these can provide a competitive edge.
Recommendations for Hosts
- Ensure your listing includes all essential amenities for Santa Lucía de Tirajana: Kitchen, Wifi.
- Prioritize adding missing essentials: Kitchen, Wifi.
- Consider adding popular differentiators like Essentials or Dishes and silverware to increase appeal.
- Highlight unique or less common amenities you offer (e.g., hot tub, dedicated workspace, EV charger) in your listing description and photos.
- Regularly check competitor amenities in Santa Lucía de Tirajana to stay competitive.
Santa Lucía de Tirajana Airbnb Guest Demographics & Profile Analysis (2025)
Guest Profile Summary for Santa Lucía de Tirajana
- The typical guest profile for Airbnb in Santa Lucía de Tirajana consists of predominantly international visitors (76%), with top international origins including Germany, typically belonging to the Post-2000s (Gen Z/Alpha) group (50%), primarily speaking English or Spanish.
- Domestic travelers account for 24.1% of guests.
- Key international markets include Spain (24.1%) and Germany (18.6%).
- Top languages spoken are English (36.5%) followed by Spanish (16.5%).
- A significant demographic segment is the Post-2000s (Gen Z/Alpha) group, representing 50% of guests.
Recommendations for Hosts
- Focus marketing internationally, particularly towards travelers from Germany.
- Tailor amenities and listing descriptions to appeal to the dominant Post-2000s (Gen Z/Alpha) demographic (e.g., highlight fast WiFi, smart home features, local guides).
- Highlight unique local experiences or amenities relevant to the primary guest profile.
- Consider seasonal promotions aligned with peak travel times for key origin markets.
Nearby Short-Term Rental Market Comparison
How does the Santa Lucía de Tirajana Airbnb market stack up against its neighbors? Compare key performance metrics like average monthly revenue, ADR, and occupancy rates in surrounding areas to understand the broader regional STR landscape.
| Market | Active Properties | Monthly Revenue | Daily Rate | Avg. Occupancy |
|---|---|---|---|---|
| El Sauzal | 94 | $2,759 | $231.94 | 52% |
| La Victoria de Acentejo | 18 | $2,591 | $227.75 | 54% |
| Santa Úrsula | 134 | $2,276 | $200.12 | 49% |
| Adeje | 3,043 | $2,203 | $189.97 | 51% |
| San Miguel de Abona | 666 | $1,918 | $173.37 | 49% |
| El Rosario | 227 | $1,846 | $140.14 | 56% |
| San Bartolomé de Tirajana | 2,717 | $1,640 | $155.10 | 48% |
| Los Realejos | 263 | $1,626 | $119.12 | 54% |
| Santiago del Teide | 773 | $1,616 | $140.24 | 50% |
| La Orotava | 267 | $1,614 | $133.19 | 51% |