San Bartolomé de Tirajana Airbnb Market Analysis 2025: Short Term Rental Data & Vacation Rental Statistics in Canary Islands, Spain
Is Airbnb profitable in San Bartolomé de Tirajana in 2025? Explore comprehensive Airbnb analytics for San Bartolomé de Tirajana, Canary Islands, Spain to uncover income potential. This 2025 STR market report for San Bartolomé de Tirajana, based on AirROI data from April 2024 to March 2025, reveals key trends in the bustling market of 2,717 active listings.
Whether you're considering an Airbnb investment in San Bartolomé de Tirajana, optimizing your existing vacation rental, or exploring rental arbitrage opportunities, understanding the San Bartolomé de Tirajana Airbnb data is crucial. Navigating the high regulation landscape is key to maximizing your short term rental income potential. Let's dive into the specifics.
Key San Bartolomé de Tirajana Airbnb Performance Metrics Overview
Monthly Airbnb Revenue Variations & Income Potential in San Bartolomé de Tirajana (2025)
Understanding the monthly revenue variations for Airbnb listings in San Bartolomé de Tirajana is key to maximizing your short term rental income potential. Seasonality significantly impacts earnings. Our analysis, based on data from the past 12 months, shows that the peak revenue month for STRs in San Bartolomé de Tirajana is typically January, while September often presents the lowest earnings, highlighting opportunities for strategic pricing adjustments during shoulder and low seasons. Explore the typical Airbnb income in San Bartolomé de Tirajana across different performance tiers:
- Best-in-class properties (Top 10%) achieve $4,830+ monthly, often utilizing dynamic pricing and superior guest experiences.
- Strong performing properties (Top 25%) earn $3,000 or more, indicating effective management and desirable locations/amenities.
- Typical properties (Median) generate around $1,861 per month, representing the average market performance.
- Entry-level properties (Bottom 25%) see earnings around $1,021, often with potential for optimization.
Average Monthly Airbnb Earnings Trend in San Bartolomé de Tirajana
San Bartolomé de Tirajana Airbnb Occupancy Rate Trends (2025)
Maximize your bookings by understanding the San Bartolomé de Tirajana STR occupancy trends. Seasonal demand shifts significantly influence how often properties are booked. Typically, Januarysees the highest demand (peak season occupancy), while June experiences the lowest (low season). Effective strategies, like adjusting minimum stays or offering promotions, can boost occupancy during slower periods. Here's how different property tiers perform in San Bartolomé de Tirajana:
- Best-in-class properties (Top 10%) achieve 89%+ occupancy, indicating high desirability and potentially optimized availability.
- Strong performing properties (Top 25%) maintain 76% or higher occupancy, suggesting good market fit and guest satisfaction.
- Typical properties (Median) have an occupancy rate around 54%.
- Entry-level properties (Bottom 25%) average 27% occupancy, potentially facing higher vacancy.
Average Monthly Occupancy Rate Trend in San Bartolomé de Tirajana
Average Daily Rate (ADR) Airbnb Trends in San Bartolomé de Tirajana (2025)
Effective short term rental pricing strategy in San Bartolomé de Tirajana involves understanding monthly ADR fluctuations. The Average Daily Rate (ADR) for Airbnb in San Bartolomé de Tirajana typically peaks in December and dips lowest during September. Leveraging Airbnb dynamic pricing tools or strategies based on this seasonality can significantly boost revenue. Here's a look at the typical nightly rates achieved:
- Best-in-class properties (Top 10%) command rates of $293+ per night, often due to premium features or locations.
- Strong performing properties (Top 25%) achieve nightly rates of $176 or more.
- Typical properties (Median) charge around $107 per night.
- Entry-level properties (Bottom 25%) earn around $80 per night.
Average Daily Rate (ADR) Trend by Month in San Bartolomé de Tirajana
Get Live San Bartolomé de Tirajana Market Intelligence 👇

Explore Real-time Analytics
Airbnb Seasonality Analysis & Trends in San Bartolomé de Tirajana (2025)
Peak Season (January, February, December)
- Revenue averages $3,276 per month
- Occupancy rates average 66.5%
- Daily rates average $171
Shoulder Season
- Revenue averages $2,342 per month
- Occupancy maintains around 50.8%
- Daily rates hold near $155
Low Season (May, June, September)
- Revenue drops to average $1,800 per month
- Occupancy decreases to average 38.7%
- Daily rates adjust to average $147
Seasonality Insights for San Bartolomé de Tirajana
- The Airbnb seasonality in San Bartolomé de Tirajana shows highly seasonal trends requiring careful strategy. While the sections above show seasonal averages, it's also insightful to look at the extremes:
- During the high season, the absolute peak month showcases San Bartolomé de Tirajana's highest earning potential, with monthly revenues capable of climbing to $3,411, occupancy reaching a high of 68.4%, and ADRs peaking at $172.
- Conversely, the slowest single month of the year, typically falling within the low season, marks the market's lowest point. In this month, revenue might dip to $1,597, occupancy could drop to 34.9%, and ADRs may adjust down to $146.
- Understanding both the seasonal averages and these monthly peaks and troughs in revenue, occupancy, and ADR is crucial for maximizing your Airbnb profit potential in San Bartolomé de Tirajana.
Seasonal Strategies for Maximizing Profit
- Peak Season: Maximize revenue through premium pricing and potentially longer minimum stays. Ensure high availability.
- Low Season: Offer competitive pricing, special promotions (e.g., extended stay discounts), and flexible cancellation policies. Target off-season travelers like remote workers or budget-conscious guests.
- Shoulder Seasons: Implement dynamic pricing that balances peak and low rates. Target weekend travelers or specific events. Offer slightly more flexible terms than peak season.
- Regularly analyze your own performance against these San Bartolomé de Tirajana seasonality benchmarks and adjust your pricing and availability strategy accordingly.
Best Areas for Airbnb Investment in San Bartolomé de Tirajana (2025)
Exploring the top neighborhoods for short-term rentals in San Bartolomé de Tirajana? This section highlights key areas, outlining why they are attractive for hosts and guests, along with notable local attractions. Consider these locations based on your target guest profile and investment strategy.
| Neighborhood / Area | Why Host Here? (Target Guests & Appeal) | Key Attractions & Landmarks |
|---|---|---|
| Playa del Inglés | One of the most popular tourist areas in Gran Canaria, known for its long sandy beaches, vibrant nightlife and a wide variety of restaurants and entertainment options. Ideal for hosting tourists looking for sun and fun. | Yumbo Centrum, Dunes of Maspalomas, Playa de las Burras, Cita Shopping Center, Maspalomas Lighthouse |
| Maspalomas | Famous for its stunning dunes and nature reserves, Maspalomas attracts families and nature lovers. The area offers beautiful landscapes and unique attractions. | Maspalomas Dunes, Maspalomas Lighthouse, Palmitos Park, Aqualand Maspalomas, Kiwi Palmtree |
| San Agustín | A quieter alternative to Playa del Inglés, offering a relaxed beach atmosphere. Perfect for families and travelers seeking a peaceful getaway, with beautiful beaches and local charm. | San Agustín Beach, Shopping Center San Agustin, Playa de las Burras, Los Verilitos, Dunes of Maspalomas |
| Meloneras | A luxurious area with upscale resorts, restaurants, and shops. Attracts high-end tourists and those looking for a more tranquil, upscale experience by the seaside. | Meloneras Beach, Boulevard El Faro, Lopesan Meloneras Resort, Maspalomas Golf, Lighthouse of Maspalomas |
| Puerto Rico | A popular family-friendly destination with a lively marina and plenty of recreational activities. Well-known for its sunny climate and beautiful beach. | Puerto Rico Beach, Angry Birds Activity Park, Mini Golf Puerto Rico, Puerto Base, Lago Taurito Water Park |
| Arguineguín | A charming fishing village with a more laid-back vibe, popular among locals and tourists alike seeking authentic experiences and a local atmosphere. | Arguineguín Beach, Mercadillo de Arguineguín, Anfi Beach, Playa de las Marañuelas, Pasito Blanco Marina |
| Costa Meloneras | Known for its beautiful coastline and luxury resorts, this area is ideal for travelers seeking relaxation and high-end amenities close to the beach. | Playa de Meloneras, El Faro de Maspalomas, Maspalomas Lighthouse, Maspalomas Dunes, Golf Course Maspalomas |
| Taurito | A smaller, tranquil resort area that offers family-oriented activities and beautiful natural surroundings, suitable for those looking for a relaxing trip. | Lago Taurito, Playa Taurito, Taurito Aquapark, Taurito Beach, Mogán Valley |
Understanding Airbnb License Requirements & STR Laws in San Bartolomé de Tirajana (2025)
Yes, San Bartolomé de Tirajana, Canary Islands, Spain enforces high STR regulations. Obtaining a license and ensuring compliance is almost certainly required according to current 2025 STR laws. Always verify the latest short term rental regulations and Airbnb license requirements directly with local government authorities for San Bartolomé de Tirajana to ensure full compliance before hosting.
(Source: AirROI data, 2025, based on 33% licensed listings)
Top Performing Airbnb Properties in San Bartolomé de Tirajana (2025)
Benchmark your potential! Explore examples of top-performing Airbnb properties in San Bartolomé de Tirajanabased on Trailing Twelve Month (TTM) revenue. Analyze their characteristics, revenue, occupancy rate, and ADR to understand what drives success in this market.

Blue Ocean by VillaGranCanaria
Entire Place • 4 bedrooms
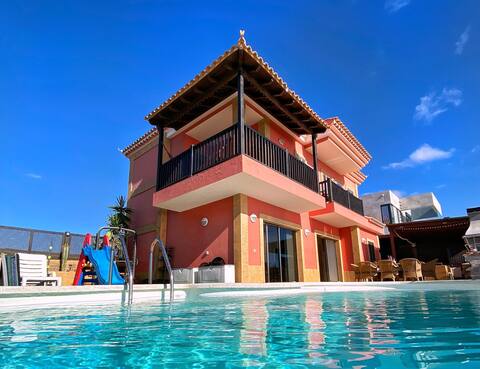
5* Luxury villa: Sea view, jacuzzi & heated pool
Entire Place • 9 bedrooms

VILLA-VISTA-MAR with apartment and guesthouse (14)
Entire Place • 7 bedrooms
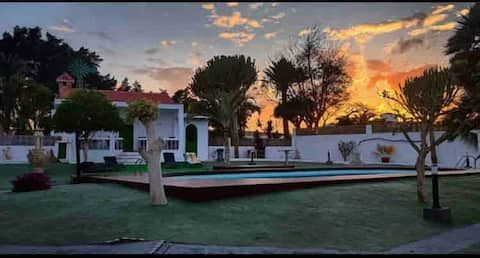
Villa La Higuera
Entire Place • 6 bedrooms

Luxury Villa with private pool
Entire Place • 3 bedrooms
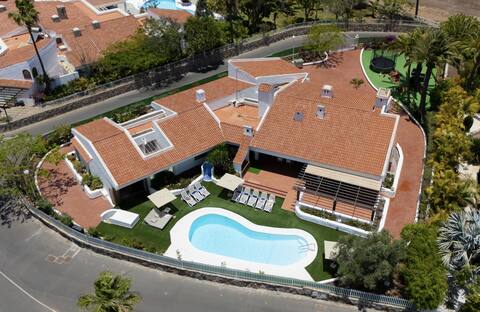
Casa Gran Canaria - Private heated pool, games roo
Entire Place • 6 bedrooms
Note: Performance varies based on location, size, amenities, seasonality, and management quality. Data reflects the past 12 months.
Top Performing Airbnb Hosts in San Bartolomé de Tirajana (2025)
Learn from the best! This table showcases top-performing Airbnb hosts in San Bartolomé de Tirajana based on the number of properties managed and estimated total revenue over the past year. Analyze their scale and performance metrics.
| Host Name | Properties | Grossing Revenue | Stay Reviews | Avg Rating |
|---|---|---|---|---|
| Carlos | 127 | $3,402,522 | 1092 | 3.86/5.0 |
| Central | 55 | $1,404,636 | 2258 | 4.61/5.0 |
| Home2Book | 18 | $1,003,405 | 243 | 4.24/5.0 |
| Ana | 17 | $828,125 | 483 | 4.79/5.0 |
| SunhousesCanarias | 26 | $776,769 | 342 | 3.90/5.0 |
| Pablo | 21 | $748,742 | 324 | 4.39/5.0 |
| Suite Dreams | 27 | $690,415 | 173 | 3.91/5.0 |
| Justyna | 35 | $627,920 | 1706 | 4.52/5.0 |
| Gustavo | 22 | $577,948 | 555 | 4.33/5.0 |
| Judit | 13 | $542,022 | 210 | 4.79/5.0 |
Analyzing the strategies of top hosts, such as their property selection, pricing, and guest communication, can offer valuable lessons for optimizing your own Airbnb operations in San Bartolomé de Tirajana.
Dive Deeper: Advanced San Bartolomé de Tirajana STR Market Data (2025)
Ready to unlock more insights? AirROI provides access to advanced metrics and comprehensive Airbnb data for San Bartolomé de Tirajana. Explore detailed analytics beyond this report to refine your investment strategy, optimize pricing, and maximize your vacation rental profits.
Explore Advanced MetricsSan Bartolomé de Tirajana Short-Term Rental Market Composition (2025): Property & Room Types
Room Type Distribution
Property Type Distribution
Market Composition Insights for San Bartolomé de Tirajana
- The San Bartolomé de Tirajana Airbnb market composition is heavily skewed towards Entire Home/Apt listings, which make up 96.6% of the 2,717 active rentals. This indicates strong guest preference for privacy and space.
- Looking at the property type distribution in San Bartolomé de Tirajana, Apartment/Condo properties are the most common (55.3%), reflecting the local real estate landscape.
- Houses represent a significant 42.8% portion, catering likely to families or larger groups.
- Smaller segments like hotel/boutique, others, outdoor/unique (combined 1.8%) offer potential for unique stay experiences.
San Bartolomé de Tirajana Airbnb Room Capacity Analysis (2025): Bedroom Distribution
Distribution of Listings by Number of Bedrooms
Room Capacity Insights for San Bartolomé de Tirajana
- The dominant room capacity in San Bartolomé de Tirajana is 1 bedroom listings, making up 50.2% of the market. This suggests a strong demand for properties suitable for couples or solo travelers.
- Together, 1 bedroom and 2 bedrooms properties represent 80.3% of the active Airbnb listings in San Bartolomé de Tirajana, indicating a high concentration in these sizes.
- With over half the market (50.2%) consisting of studios or 1-bedroom units, San Bartolomé de Tirajana is particularly well-suited for individuals or couples.
San Bartolomé de Tirajana Vacation Rental Guest Capacity Trends (2025)
Distribution of Listings by Guest Capacity
Guest Capacity Insights for San Bartolomé de Tirajana
- The most common guest capacity trend in San Bartolomé de Tirajana vacation rentals is listings accommodating 4 guests (35.1%). This suggests the primary traveler segment is likely small families or groups.
- Properties designed for 4 guests and 2 guests dominate the San Bartolomé de Tirajana STR market, accounting for 56.7% of listings.
- 17.6% of properties accommodate 6+ guests, serving the market segment for larger families or group travel in San Bartolomé de Tirajana.
- On average, properties in San Bartolomé de Tirajana are equipped to host 3.8 guests.
San Bartolomé de Tirajana Airbnb Booking Patterns (2025): Available vs. Booked Days
Available Days Distribution
Booked Days Distribution
Booking Pattern Insights for San Bartolomé de Tirajana
- The most common availability pattern in San Bartolomé de Tirajana falls within the 271-366 days range, representing 38% of listings. This suggests many properties have significant open periods on their calendars.
- Approximately 66.2% of listings show high availability (181+ days open annually), indicating potential for increased bookings or specific owner usage patterns.
- For booked days, the 91-180 days range is most frequent in San Bartolomé de Tirajana (28.4%), reflecting common guest stay durations or potential owner blocking patterns.
- A notable 35.1% of properties secure long booking periods (181+ days booked per year), highlighting successful long-term rental strategies or significant owner usage.
San Bartolomé de Tirajana Airbnb Minimum Stay Requirements Analysis
Distribution of Listings by Minimum Night Requirement
1 Night
177 listings
6.9% of total
2 Nights
136 listings
5.3% of total
3 Nights
324 listings
12.6% of total
4-6 Nights
1277 listings
49.8% of total
7-29 Nights
263 listings
10.3% of total
30+ Nights
388 listings
15.1% of total
Key Insights
- The most prevalent minimum stay requirement in San Bartolomé de Tirajana is 4-6 Nights, adopted by 49.8% of listings. This highlights the market's preference for longer commitments.
- Very short stays (1-2 nights) are less common (12.2%), suggesting hosts prefer slightly longer bookings to optimize turnover.
- A significant segment (15.1%) caters to monthly stays (30+ nights) in San Bartolomé de Tirajana, pointing to opportunities in the extended-stay market.
Recommendations
- Align with the market by considering a 4-6 Nights minimum stay, as 49.8% of San Bartolomé de Tirajana hosts use this setting.
- If feasible, allowing 1-night stays, especially midweek or during low season, could capture last-minute bookings, as only 6.9% currently do.
- Explore offering discounts for stays of 30+ nights to attract the 15.1% of the market seeking extended stays.
- Adjust minimum nights based on seasonality – potentially shorter during low season and longer during peak demand periods in San Bartolomé de Tirajana.
San Bartolomé de Tirajana Airbnb Cancellation Policy Trends Analysis (2025)
Super Strict 30 Days
14 listings
0.6% of total
Super Strict 60 Days
27 listings
1.1% of total
Flexible
319 listings
13.5% of total
Moderate
688 listings
29.2% of total
Firm
629 listings
26.7% of total
Strict
682 listings
28.9% of total
Cancellation Policy Insights for San Bartolomé de Tirajana
- The prevailing Airbnb cancellation policy trend in San Bartolomé de Tirajana is Moderate, used by 29.2% of listings.
- A majority (55.6%) of hosts in San Bartolomé de Tirajana utilize Firm or Strict policies, indicating a market where hosts prioritize booking security.
Recommendations for Hosts
- Consider adopting a Moderate policy to align with the 29.2% market standard in San Bartolomé de Tirajana.
- Regularly review your cancellation policy against competitors and market demand shifts in San Bartolomé de Tirajana.
San Bartolomé de Tirajana STR Booking Lead Time Analysis (2025)
Average Booking Lead Time by Month
Booking Lead Time Insights for San Bartolomé de Tirajana
- The overall average booking lead time for vacation rentals in San Bartolomé de Tirajana is 92 days.
- Guests book furthest in advance for stays during February (average 127 days), likely coinciding with peak travel demand or local events.
- The shortest booking windows occur for stays in September (average 70 days), indicating more last-minute travel plans during this time.
- Seasonally, Winter (120 days avg.) sees the longest lead times, while Summer (81 days avg.) has the shortest, reflecting typical travel planning cycles.
Recommendations for Hosts
- Use the overall average lead time (92 days) as a baseline for your pricing and availability strategy in San Bartolomé de Tirajana.
- For February stays, consider implementing length-of-stay discounts or slightly higher rates for bookings made less than 127 days out to capitalize on advance planning.
- Target marketing efforts for the Winter season well in advance (at least 120 days) to capture early planners.
- Monitor your own booking lead times against these San Bartolomé de Tirajana averages to identify opportunities for dynamic pricing adjustments.
Popular & Essential Airbnb Amenities in San Bartolomé de Tirajana (2025)
Amenity Prevalence
Amenity Insights for San Bartolomé de Tirajana
- Essential amenities in San Bartolomé de Tirajana that guests expect include: TV, Kitchen, Wifi. Lacking these (any) could significantly impact bookings.
- Popular amenities like Washer, Essentials, Dishes and silverware are common but not universal. Offering these can provide a competitive edge.
Recommendations for Hosts
- Ensure your listing includes all essential amenities for San Bartolomé de Tirajana: TV, Kitchen, Wifi.
- Prioritize adding missing essentials: TV, Kitchen, Wifi.
- Consider adding popular differentiators like Washer or Essentials to increase appeal.
- Highlight unique or less common amenities you offer (e.g., hot tub, dedicated workspace, EV charger) in your listing description and photos.
- Regularly check competitor amenities in San Bartolomé de Tirajana to stay competitive.
San Bartolomé de Tirajana Airbnb Guest Demographics & Profile Analysis (2025)
Guest Profile Summary for San Bartolomé de Tirajana
- The typical guest profile for Airbnb in San Bartolomé de Tirajana consists of predominantly international visitors (79%), with top international origins including United Kingdom, typically belonging to the Post-2000s (Gen Z/Alpha) group (50%), primarily speaking Spanish or German.
- Domestic travelers account for 20.9% of guests.
- Key international markets include Spain (20.9%) and United Kingdom (19.4%).
- Top languages spoken are Spanish (15.8%) followed by German (13.1%).
- A significant demographic segment is the Post-2000s (Gen Z/Alpha) group, representing 50% of guests.
Recommendations for Hosts
- Focus marketing internationally, particularly towards travelers from United Kingdom.
- Offer listing details and communication support in Spanish and German.
- Tailor amenities and listing descriptions to appeal to the dominant Post-2000s (Gen Z/Alpha) demographic (e.g., highlight fast WiFi, smart home features, local guides).
- Highlight unique local experiences or amenities relevant to the primary guest profile.
- Consider seasonal promotions aligned with peak travel times for key origin markets.
Nearby Short-Term Rental Market Comparison
How does the San Bartolomé de Tirajana Airbnb market stack up against its neighbors? Compare key performance metrics like average monthly revenue, ADR, and occupancy rates in surrounding areas to understand the broader regional STR landscape.
| Market | Active Properties | Monthly Revenue | Daily Rate | Avg. Occupancy |
|---|---|---|---|---|
| El Sauzal | 94 | $2,759 | $231.94 | 52% |
| La Victoria de Acentejo | 18 | $2,591 | $227.75 | 54% |
| Santa Úrsula | 134 | $2,276 | $200.12 | 49% |
| Adeje | 3,043 | $2,203 | $189.97 | 51% |
| San Miguel de Abona | 666 | $1,918 | $173.37 | 49% |
| El Rosario | 227 | $1,846 | $140.14 | 56% |
| Los Realejos | 263 | $1,626 | $119.12 | 54% |
| Santiago del Teide | 773 | $1,616 | $140.24 | 50% |
| La Orotava | 267 | $1,614 | $133.19 | 51% |
| Agaete | 202 | $1,612 | $121.39 | 51% |