San Bartolomé Airbnb Market Analysis 2025: Short Term Rental Data & Vacation Rental Statistics in Canary Islands, Spain
Is Airbnb profitable in San Bartolomé in 2025? Explore comprehensive Airbnb analytics for San Bartolomé, Canary Islands, Spain to uncover income potential. This 2025 STR market report for San Bartolomé, based on AirROI data from April 2024 to March 2025, reveals key trends in the market of 293 active listings.
Whether you're considering an Airbnb investment in San Bartolomé, optimizing your existing vacation rental, or exploring rental arbitrage opportunities, understanding the San Bartolomé Airbnb data is crucial. Understanding the local regulations is key to maximizing your short term rental income potential. Let's dive into the specifics.
Key San Bartolomé Airbnb Performance Metrics Overview
Monthly Airbnb Revenue Variations & Income Potential in San Bartolomé (2025)
Understanding the monthly revenue variations for Airbnb listings in San Bartolomé is key to maximizing your short term rental income potential. Seasonality significantly impacts earnings. Our analysis, based on data from the past 12 months, shows that the peak revenue month for STRs in San Bartolomé is typically January, while September often presents the lowest earnings, highlighting opportunities for strategic pricing adjustments during shoulder and low seasons. Explore the typical Airbnb income in San Bartolomé across different performance tiers:
- Best-in-class properties (Top 10%) achieve $3,701+ monthly, often utilizing dynamic pricing and superior guest experiences.
- Strong performing properties (Top 25%) earn $2,490 or more, indicating effective management and desirable locations/amenities.
- Typical properties (Median) generate around $1,577 per month, representing the average market performance.
- Entry-level properties (Bottom 25%) see earnings around $945, often with potential for optimization.
Average Monthly Airbnb Earnings Trend in San Bartolomé
San Bartolomé Airbnb Occupancy Rate Trends (2025)
Maximize your bookings by understanding the San Bartolomé STR occupancy trends. Seasonal demand shifts significantly influence how often properties are booked. Typically, Januarysees the highest demand (peak season occupancy), while June experiences the lowest (low season). Effective strategies, like adjusting minimum stays or offering promotions, can boost occupancy during slower periods. Here's how different property tiers perform in San Bartolomé:
- Best-in-class properties (Top 10%) achieve 91%+ occupancy, indicating high desirability and potentially optimized availability.
- Strong performing properties (Top 25%) maintain 82% or higher occupancy, suggesting good market fit and guest satisfaction.
- Typical properties (Median) have an occupancy rate around 62%.
- Entry-level properties (Bottom 25%) average 29% occupancy, potentially facing higher vacancy.
Average Monthly Occupancy Rate Trend in San Bartolomé
Average Daily Rate (ADR) Airbnb Trends in San Bartolomé (2025)
Effective short term rental pricing strategy in San Bartolomé involves understanding monthly ADR fluctuations. The Average Daily Rate (ADR) for Airbnb in San Bartolomé typically peaks in January and dips lowest during April. Leveraging Airbnb dynamic pricing tools or strategies based on this seasonality can significantly boost revenue. Here's a look at the typical nightly rates achieved:
- Best-in-class properties (Top 10%) command rates of $202+ per night, often due to premium features or locations.
- Strong performing properties (Top 25%) achieve nightly rates of $137 or more.
- Typical properties (Median) charge around $97 per night.
- Entry-level properties (Bottom 25%) earn around $71 per night.
Average Daily Rate (ADR) Trend by Month in San Bartolomé
Get Live San Bartolomé Market Intelligence 👇

Explore Real-time Analytics
Airbnb Seasonality Analysis & Trends in San Bartolomé (2025)
Peak Season (January, December, November)
- Revenue averages $2,325 per month
- Occupancy rates average 67.2%
- Daily rates average $133
Shoulder Season
- Revenue averages $1,866 per month
- Occupancy maintains around 53.4%
- Daily rates hold near $124
Low Season (June, September, October)
- Revenue drops to average $1,598 per month
- Occupancy decreases to average 48.9%
- Daily rates adjust to average $123
Seasonality Insights for San Bartolomé
- The Airbnb seasonality in San Bartolomé shows moderate seasonality with distinct peak and low periods. While the sections above show seasonal averages, it's also insightful to look at the extremes:
- During the high season, the absolute peak month showcases San Bartolomé's highest earning potential, with monthly revenues capable of climbing to $2,454, occupancy reaching a high of 69.8%, and ADRs peaking at $136.
- Conversely, the slowest single month of the year, typically falling within the low season, marks the market's lowest point. In this month, revenue might dip to $1,547, occupancy could drop to 40.9%, and ADRs may adjust down to $118.
- Understanding both the seasonal averages and these monthly peaks and troughs in revenue, occupancy, and ADR is crucial for maximizing your Airbnb profit potential in San Bartolomé.
Seasonal Strategies for Maximizing Profit
- Peak Season: Maximize revenue through premium pricing and potentially longer minimum stays. Ensure high availability.
- Low Season: Offer competitive pricing, special promotions (e.g., extended stay discounts), and flexible cancellation policies. Target off-season travelers like remote workers or budget-conscious guests.
- Shoulder Seasons: Implement dynamic pricing that balances peak and low rates. Target weekend travelers or specific events. Offer slightly more flexible terms than peak season.
- Regularly analyze your own performance against these San Bartolomé seasonality benchmarks and adjust your pricing and availability strategy accordingly.
Best Areas for Airbnb Investment in San Bartolomé (2025)
Exploring the top neighborhoods for short-term rentals in San Bartolomé? This section highlights key areas, outlining why they are attractive for hosts and guests, along with notable local attractions. Consider these locations based on your target guest profile and investment strategy.
| Neighborhood / Area | Why Host Here? (Target Guests & Appeal) | Key Attractions & Landmarks |
|---|---|---|
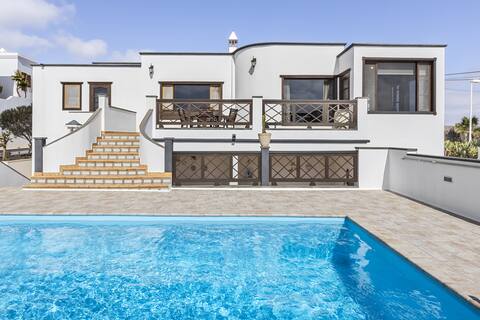
| Playa de San Bartolomé | A stunning beach area known for its golden sands and crystal-clear waters. This location attracts tourists looking for relaxation and beach activities, making it ideal for short-term rentals. | Playa de San Bartolomé, Water sports activities, Beach bars and restaurants, Scenic coastal walks |
| Los Claveles | A family-friendly residential area with access to local amenities and tourist attractions. Perfect for families vacationing in the Canary Islands looking for a home away from home. | Local markets, Parks and playgrounds, Proximity to attractions like Tablero, Restaurants and cafes |
| Costa Teguise | Known for its beautiful beaches and resorts, this area is popular among tourists looking for water sports and leisure activities. Hosts can benefit from high occupancy rates during peak seasons. | Playa de las Cucharas, Aquapark Costa Teguise, Wind surf spots, Shopping areas |
| Teguise | A charming historic town that offers a glimpse of traditional Canarian culture. With its arts and craft markets, it's a draw for tourists interested in local culture and history. | Teguise Market, Museo de la Piratería, Historic sites, Artisan shops |
| Puerto del Carmen | This area is a vibrant tourist hub with a wide range of entertainment options and nightlife. It's one of the most popular destinations for visitors to Lanzarote, offering great rental potential. | Playa Grande, Vibrant nightlife, Shopping centers, Diving and water sports |
| Arrecife | The capital city of Lanzarote, Arrecife combines urban living with beach access. Ideal for tourists looking for a convenient base with access to culture and amenities. | Arrecife Marina, Castillo de San Gabriel, Beaches, Local restaurants |
| La Geria | Famous for its unique volcanic wine production, this region attracts visitors interested in wine tours and culinary experiences. A unique rental offering can attract niche tourists. | Vineyard tours, Wine tasting, Unique volcanic landscape, Local cuisine |
| El Golfo | Known for its breathtaking natural scenery and the striking green lagoon, El Golfo appeals to nature lovers and hikers. A great option for eco-tourism enthusiasts. | Laguna Verde, Natural park, Spectacular coastal views, Hiking trails |
Understanding Airbnb License Requirements & STR Laws in San Bartolomé (2025)
With 30% of listings showing registration in 2025, understanding potential Airbnb license requirements is crucial in San Bartolomé. Always verify the latest short term rental regulations and Airbnb license requirements directly with local government authorities for San Bartolomé to ensure full compliance before hosting.
(Source: AirROI data, 2025, based on 30% licensed listings)
Top Performing Airbnb Properties in San Bartolomé (2025)
Benchmark your potential! Explore examples of top-performing Airbnb properties in San Bartolomébased on Trailing Twelve Month (TTM) revenue. Analyze their characteristics, revenue, occupancy rate, and ADR to understand what drives success in this market.
Villa Panorámica - VipVipVillas
Entire Place • 4 bedrooms

Ocean-view vacations
Entire Place • 5 bedrooms
Luxury Villa Sea Front -La Orilla
Entire Place • 3 bedrooms
Casa Ann
Entire Place • 2 bedrooms

Amazing views, private climatized pool and jacuzzi
Entire Place • 3 bedrooms

Villa Mariemne Lanzarote
Entire Place • 3 bedrooms
Note: Performance varies based on location, size, amenities, seasonality, and management quality. Data reflects the past 12 months.
Top Performing Airbnb Hosts in San Bartolomé (2025)
Learn from the best! This table showcases top-performing Airbnb hosts in San Bartolomé based on the number of properties managed and estimated total revenue over the past year. Analyze their scale and performance metrics.
| Host Name | Properties | Grossing Revenue | Stay Reviews | Avg Rating |
|---|---|---|---|---|
| Guillermo | 9 | $224,742 | 131 | 4.15/5.0 |
| Canaryislandshost I CIH Apartm | 6 | $211,968 | 214 | 4.70/5.0 |
| Nina | 5 | $105,542 | 439 | 4.96/5.0 |
| Beatriz | 5 | $100,963 | 430 | 4.78/5.0 |
| Guillermo | 1 | $94,810 | 12 | 4.92/5.0 |
| Rafa | 5 | $90,636 | 76 | 4.93/5.0 |
| Home2Book | 2 | $77,381 | 20 | 4.30/5.0 |
| Patricio | 2 | $69,878 | 83 | 4.91/5.0 |
| Jorge | 8 | $69,394 | 66 | 2.37/5.0 |
| We Love Tourism | 3 | $67,023 | 45 | 4.68/5.0 |
Analyzing the strategies of top hosts, such as their property selection, pricing, and guest communication, can offer valuable lessons for optimizing your own Airbnb operations in San Bartolomé.
Dive Deeper: Advanced San Bartolomé STR Market Data (2025)
Ready to unlock more insights? AirROI provides access to advanced metrics and comprehensive Airbnb data for San Bartolomé. Explore detailed analytics beyond this report to refine your investment strategy, optimize pricing, and maximize your vacation rental profits.
Explore Advanced MetricsSan Bartolomé Short-Term Rental Market Composition (2025): Property & Room Types
Room Type Distribution
Property Type Distribution
Market Composition Insights for San Bartolomé
- The San Bartolomé Airbnb market composition is heavily skewed towards Entire Home/Apt listings, which make up 85.3% of the 293 active rentals. This indicates strong guest preference for privacy and space.
- Looking at the property type distribution in San Bartolomé, House properties are the most common (44.7%), reflecting the local real estate landscape.
- Houses represent a significant 44.7% portion, catering likely to families or larger groups.
- The presence of 5.8% Hotel/Boutique listings indicates integration with traditional hospitality.
- Smaller segments like others, outdoor/unique (combined 5.4%) offer potential for unique stay experiences.
San Bartolomé Airbnb Room Capacity Analysis (2025): Bedroom Distribution
Distribution of Listings by Number of Bedrooms
Room Capacity Insights for San Bartolomé
- The dominant room capacity in San Bartolomé is 2 bedrooms listings, making up 36.9% of the market. This suggests a strong demand for properties suitable for couples or solo travelers.
- Together, 2 bedrooms and 1 bedroom properties represent 68.0% of the active Airbnb listings in San Bartolomé, indicating a high concentration in these sizes.
- A significant 20.8% of listings offer 3+ bedrooms, catering to larger groups and families seeking more space in San Bartolomé.
San Bartolomé Vacation Rental Guest Capacity Trends (2025)
Distribution of Listings by Guest Capacity
Guest Capacity Insights for San Bartolomé
- The most common guest capacity trend in San Bartolomé vacation rentals is listings accommodating 4 guests (32.4%). This suggests the primary traveler segment is likely small families or groups.
- Properties designed for 4 guests and 2 guests dominate the San Bartolomé STR market, accounting for 54.6% of listings.
- 17.7% of properties accommodate 6+ guests, serving the market segment for larger families or group travel in San Bartolomé.
- On average, properties in San Bartolomé are equipped to host 3.5 guests.
San Bartolomé Airbnb Booking Patterns (2025): Available vs. Booked Days
Available Days Distribution
Booked Days Distribution
Booking Pattern Insights for San Bartolomé
- The most common availability pattern in San Bartolomé falls within the 271-366 days range, representing 37.2% of listings. This suggests many properties have significant open periods on their calendars.
- Approximately 58.7% of listings show high availability (181+ days open annually), indicating potential for increased bookings or specific owner usage patterns.
- For booked days, the 181-270 days range is most frequent in San Bartolomé (25.3%), reflecting common guest stay durations or potential owner blocking patterns.
- A notable 43.4% of properties secure long booking periods (181+ days booked per year), highlighting successful long-term rental strategies or significant owner usage.
San Bartolomé Airbnb Minimum Stay Requirements Analysis
Distribution of Listings by Minimum Night Requirement
1 Night
57 listings
20.6% of total
2 Nights
14 listings
5.1% of total
3 Nights
53 listings
19.1% of total
4-6 Nights
99 listings
35.7% of total
7-29 Nights
18 listings
6.5% of total
30+ Nights
36 listings
13% of total
Key Insights
- The most prevalent minimum stay requirement in San Bartolomé is 4-6 Nights, adopted by 35.7% of listings. This highlights the market's preference for longer commitments.
- A significant segment (13%) caters to monthly stays (30+ nights) in San Bartolomé, pointing to opportunities in the extended-stay market.
Recommendations
- Align with the market by considering a 4-6 Nights minimum stay, as 35.7% of San Bartolomé hosts use this setting.
- If feasible, allowing 1-night stays, especially midweek or during low season, could capture last-minute bookings, as only 20.6% currently do.
- Explore offering discounts for stays of 30+ nights to attract the 13% of the market seeking extended stays.
- Adjust minimum nights based on seasonality – potentially shorter during low season and longer during peak demand periods in San Bartolomé.
San Bartolomé Airbnb Cancellation Policy Trends Analysis (2025)
Super Strict 30 Days
4 listings
1.5% of total
Flexible
62 listings
23.9% of total
Moderate
85 listings
32.8% of total
Firm
36 listings
13.9% of total
Strict
72 listings
27.8% of total
Cancellation Policy Insights for San Bartolomé
- The prevailing Airbnb cancellation policy trend in San Bartolomé is Moderate, used by 32.8% of listings.
- There's a relatively balanced mix between guest-friendly (56.7%) and stricter (41.7%) policies, offering choices for different guest needs.
Recommendations for Hosts
- Consider adopting a Moderate policy to align with the 32.8% market standard in San Bartolomé.
- Regularly review your cancellation policy against competitors and market demand shifts in San Bartolomé.
San Bartolomé STR Booking Lead Time Analysis (2025)
Average Booking Lead Time by Month
Booking Lead Time Insights for San Bartolomé
- The overall average booking lead time for vacation rentals in San Bartolomé is 73 days.
- Guests book furthest in advance for stays during January (average 95 days), likely coinciding with peak travel demand or local events.
- The shortest booking windows occur for stays in September (average 62 days), indicating more last-minute travel plans during this time.
- Seasonally, Winter (87 days avg.) sees the longest lead times, while Summer (77 days avg.) has the shortest, reflecting typical travel planning cycles.
Recommendations for Hosts
- Use the overall average lead time (73 days) as a baseline for your pricing and availability strategy in San Bartolomé.
- For January stays, consider implementing length-of-stay discounts or slightly higher rates for bookings made less than 95 days out to capitalize on advance planning.
- Target marketing efforts for the Winter season well in advance (at least 87 days) to capture early planners.
- Monitor your own booking lead times against these San Bartolomé averages to identify opportunities for dynamic pricing adjustments.
Popular & Essential Airbnb Amenities in San Bartolomé (2025)
Amenity Prevalence
Amenity Insights for San Bartolomé
- Essential amenities in San Bartolomé that guests expect include: Wifi. Lacking these (this) could significantly impact bookings.
- Popular amenities like TV, Kitchen, Essentials are common but not universal. Offering these can provide a competitive edge.
Recommendations for Hosts
- Ensure your listing includes all essential amenities for San Bartolomé: Wifi.
- Prioritize adding missing essentials: Wifi.
- Consider adding popular differentiators like TV or Kitchen to increase appeal.
- Highlight unique or less common amenities you offer (e.g., hot tub, dedicated workspace, EV charger) in your listing description and photos.
- Regularly check competitor amenities in San Bartolomé to stay competitive.
San Bartolomé Airbnb Guest Demographics & Profile Analysis (2025)
Guest Profile Summary for San Bartolomé
- The typical guest profile for Airbnb in San Bartolomé consists of predominantly international visitors (74%), with top international origins including France, typically belonging to the Post-2000s (Gen Z/Alpha) group (50%), primarily speaking English or Spanish.
- Domestic travelers account for 26.5% of guests.
- Key international markets include Spain (26.5%) and France (22.4%).
- Top languages spoken are English (37.2%) followed by Spanish (20%).
- A significant demographic segment is the Post-2000s (Gen Z/Alpha) group, representing 50% of guests.
Recommendations for Hosts
- Focus marketing internationally, particularly towards travelers from France.
- Tailor amenities and listing descriptions to appeal to the dominant Post-2000s (Gen Z/Alpha) demographic (e.g., highlight fast WiFi, smart home features, local guides).
- Highlight unique local experiences or amenities relevant to the primary guest profile.
- Consider seasonal promotions aligned with peak travel times for key origin markets.
Nearby Short-Term Rental Market Comparison
How does the San Bartolomé Airbnb market stack up against its neighbors? Compare key performance metrics like average monthly revenue, ADR, and occupancy rates in surrounding areas to understand the broader regional STR landscape.
| Market | Active Properties | Monthly Revenue | Daily Rate | Avg. Occupancy |
|---|---|---|---|---|
| Yaiza | 1,433 | $2,369 | $242.14 | 50% |
| Lajares | 347 | $2,137 | $169.68 | 53% |
| Tías | 1,491 | $2,055 | $172.05 | 56% |
| Villaverde | 90 | $1,736 | $141.77 | 50% |
| Teguise | 1,351 | $1,657 | $127.61 | 56% |
| Haría | 475 | $1,465 | $142.83 | 50% |
| La Oliva | 2,055 | $1,370 | $123.32 | 50% |
| Tinajo | 234 | $1,258 | $124.77 | 51% |
| Antigua | 698 | $1,173 | $111.42 | 48% |
| El Cotillo | 465 | $1,165 | $103.94 | 48% |