Lajares Airbnb Market Analysis 2025: Short Term Rental Data & Vacation Rental Statistics in Canary Islands, Spain
Is Airbnb profitable in Lajares in 2025? Explore comprehensive Airbnb analytics for Lajares, Canary Islands, Spain to uncover income potential. This 2025 STR market report for Lajares, based on AirROI data from April 2024 to March 2025, reveals key trends in the market of 347 active listings.
Whether you're considering an Airbnb investment in Lajares, optimizing your existing vacation rental, or exploring rental arbitrage opportunities, understanding the Lajares Airbnb data is crucial. Navigating the high regulation landscape is key to maximizing your short term rental income potential. Let's dive into the specifics.
Key Lajares Airbnb Performance Metrics Overview
Monthly Airbnb Revenue Variations & Income Potential in Lajares (2025)
Understanding the monthly revenue variations for Airbnb listings in Lajares is key to maximizing your short term rental income potential. Seasonality significantly impacts earnings. Our analysis, based on data from the past 12 months, shows that the peak revenue month for STRs in Lajares is typically August, while September often presents the lowest earnings, highlighting opportunities for strategic pricing adjustments during shoulder and low seasons. Explore the typical Airbnb income in Lajares across different performance tiers:
- Best-in-class properties (Top 10%) achieve $6,441+ monthly, often utilizing dynamic pricing and superior guest experiences.
- Strong performing properties (Top 25%) earn $4,256 or more, indicating effective management and desirable locations/amenities.
- Typical properties (Median) generate around $1,921 per month, representing the average market performance.
- Entry-level properties (Bottom 25%) see earnings around $1,034, often with potential for optimization.
Average Monthly Airbnb Earnings Trend in Lajares
Lajares Airbnb Occupancy Rate Trends (2025)
Maximize your bookings by understanding the Lajares STR occupancy trends. Seasonal demand shifts significantly influence how often properties are booked. Typically, Februarysees the highest demand (peak season occupancy), while June experiences the lowest (low season). Effective strategies, like adjusting minimum stays or offering promotions, can boost occupancy during slower periods. Here's how different property tiers perform in Lajares:
- Best-in-class properties (Top 10%) achieve 91%+ occupancy, indicating high desirability and potentially optimized availability.
- Strong performing properties (Top 25%) maintain 80% or higher occupancy, suggesting good market fit and guest satisfaction.
- Typical properties (Median) have an occupancy rate around 61%.
- Entry-level properties (Bottom 25%) average 34% occupancy, potentially facing higher vacancy.
Average Monthly Occupancy Rate Trend in Lajares
Average Daily Rate (ADR) Airbnb Trends in Lajares (2025)
Effective short term rental pricing strategy in Lajares involves understanding monthly ADR fluctuations. The Average Daily Rate (ADR) for Airbnb in Lajares typically peaks in August and dips lowest during March. Leveraging Airbnb dynamic pricing tools or strategies based on this seasonality can significantly boost revenue. Here's a look at the typical nightly rates achieved:
- Best-in-class properties (Top 10%) command rates of $328+ per night, often due to premium features or locations.
- Strong performing properties (Top 25%) achieve nightly rates of $220 or more.
- Typical properties (Median) charge around $117 per night.
- Entry-level properties (Bottom 25%) earn around $69 per night.
Average Daily Rate (ADR) Trend by Month in Lajares
Get Live Lajares Market Intelligence 👇

Explore Real-time Analytics
Airbnb Seasonality Analysis & Trends in Lajares (2025)
Peak Season (August, January, February)
- Revenue averages $3,473 per month
- Occupancy rates average 68.5%
- Daily rates average $170
Shoulder Season
- Revenue averages $2,918 per month
- Occupancy maintains around 54.9%
- Daily rates hold near $171
Low Season (March, June, September)
- Revenue drops to average $2,472 per month
- Occupancy decreases to average 48.1%
- Daily rates adjust to average $168
Seasonality Insights for Lajares
- The Airbnb seasonality in Lajares shows moderate seasonality with distinct peak and low periods. While the sections above show seasonal averages, it's also insightful to look at the extremes:
- During the high season, the absolute peak month showcases Lajares's highest earning potential, with monthly revenues capable of climbing to $3,752, occupancy reaching a high of 71.1%, and ADRs peaking at $174.
- Conversely, the slowest single month of the year, typically falling within the low season, marks the market's lowest point. In this month, revenue might dip to $2,379, occupancy could drop to 42.2%, and ADRs may adjust down to $166.
- Understanding both the seasonal averages and these monthly peaks and troughs in revenue, occupancy, and ADR is crucial for maximizing your Airbnb profit potential in Lajares.
Seasonal Strategies for Maximizing Profit
- Peak Season: Maximize revenue through premium pricing and potentially longer minimum stays. Ensure high availability.
- Low Season: Offer competitive pricing, special promotions (e.g., extended stay discounts), and flexible cancellation policies. Target off-season travelers like remote workers or budget-conscious guests.
- Shoulder Seasons: Implement dynamic pricing that balances peak and low rates. Target weekend travelers or specific events. Offer slightly more flexible terms than peak season.
- Regularly analyze your own performance against these Lajares seasonality benchmarks and adjust your pricing and availability strategy accordingly.
Best Areas for Airbnb Investment in Lajares (2025)
Exploring the top neighborhoods for short-term rentals in Lajares? This section highlights key areas, outlining why they are attractive for hosts and guests, along with notable local attractions. Consider these locations based on your target guest profile and investment strategy.
| Neighborhood / Area | Why Host Here? (Target Guests & Appeal) | Key Attractions & Landmarks |
|---|---|---|
| Lajares Village | A charming village in Fuerteventura known for its relaxed atmosphere and local shops. Popular among tourists seeking an authentic Canarian experience, with a close-knit community feel. | Local artisan shops, Lajares Windmill, Café del Cerro, Nearby surf spots, Fuerteventura Natural Park |
| El Cotillo | A picturesque coastal village famous for its stunning beaches and relaxed vibe. Attracts beach lovers and surfers looking for a quieter alternative to the busier tourist areas. | El Cotillo Beaches, Laguna de El Cotillo, Surfing spots, Fishing village charm |
| Corralejo | A bustling beach town famous for its vibrant nightlife and beautiful beaches. Ideal for tourists looking for a lively atmosphere with plenty of activities and amenities. | Corralejo Natural Park, Dunas de Corralejo, Water sports, Restaurants and bars, Ferry to Lobos Island |
| La Oliva | A historic town known for its traditional Canarian architecture and rich culture. Attracts tourists interested in local history and traditional experiences. | Casa de los Coroneles, Museo del Aloe Vera, Cultural festivals, Natural landscapes |
| Caleta de Fuste | A family-friendly resort town featuring beautiful beaches and a golf course. Great for families looking for a full-service resort environment with ample amenities. | Caleta de Fuste Beach, Golf Club Salinas, Shopping center, Family-friendly activities, Water sports |
| Puerto del Rosario | The capital of Fuerteventura, offering a mix of local culture and modern amenities. Attracts business travelers and those wanting to experience local life. | Calle León y Castillo, Museo de la Sal, Local markets, Art galleries, Parks |
| Jandía | A picturesque resort area with pristine beaches and a relaxed environment. Popular among those looking for a seaside getaway in the southern part of the island. | Jandía Beach, Morro Jable, Water sports, Restaurants on the beachfront, Natural parks |
| Pájara | Rich in natural beauty and traditional Canarian culture. Attracts eco-tourists and those seeking outdoor adventures in scenic surroundings. | Ajuy Caves, Natural monuments, Hiking trails, Local cuisine, Cultural heritage sites |
Understanding Airbnb License Requirements & STR Laws in Lajares (2025)
Yes, Lajares, Canary Islands, Spain enforces high STR regulations. Obtaining a license and ensuring compliance is almost certainly required according to current 2025 STR laws. Always verify the latest short term rental regulations and Airbnb license requirements directly with local government authorities for Lajares to ensure full compliance before hosting.
(Source: AirROI data, 2025, based on 36% licensed listings)
Top Performing Airbnb Properties in Lajares (2025)
Benchmark your potential! Explore examples of top-performing Airbnb properties in Lajaresbased on Trailing Twelve Month (TTM) revenue. Analyze their characteristics, revenue, occupancy rate, and ADR to understand what drives success in this market.
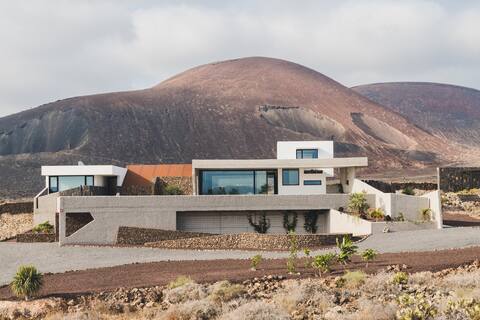
Minimalist house to the volcano
Entire Place • 6 bedrooms
23, Lajares, Bali House
Entire Place • 5 bedrooms
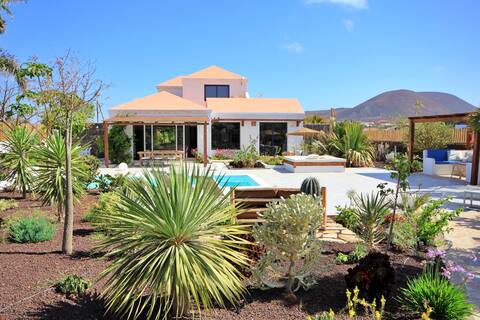
Ami Lajares -Heated pool-Volcano Views
Entire Place • 4 bedrooms

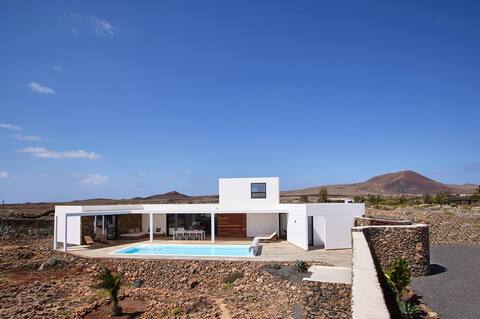
Luxury Villa Vulcano Lajares
Entire Place • 3 bedrooms
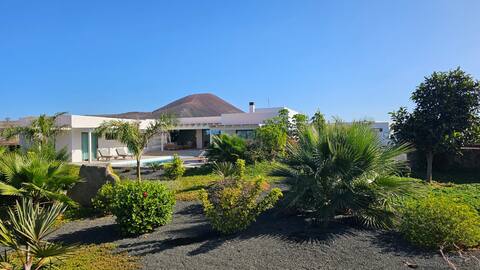
Villa Sal Marina Premium Lajares
Entire Place • 3 bedrooms

Villa Joyosa Lajares
Entire Place • 6 bedrooms
Note: Performance varies based on location, size, amenities, seasonality, and management quality. Data reflects the past 12 months.
Top Performing Airbnb Hosts in Lajares (2025)
Learn from the best! This table showcases top-performing Airbnb hosts in Lajares based on the number of properties managed and estimated total revenue over the past year. Analyze their scale and performance metrics.
| Host Name | Properties | Grossing Revenue | Stay Reviews | Avg Rating |
|---|---|---|---|---|
| Chiara | 4 | $315,378 | 197 | 4.93/5.0 |
| Jessica | 7 | $273,856 | 190 | 4.95/5.0 |
| Lali | 2 | $175,721 | 73 | 4.92/5.0 |
| Rubén | 1 | $175,171 | 4 | 5.00/5.0 |
| Louise | 1 | $165,786 | 34 | 5.00/5.0 |
| Victor | 5 | $161,261 | 216 | 4.55/5.0 |
| Felix | 2 | $159,633 | 15 | 4.94/5.0 |
| Borja | 3 | $148,138 | 99 | 4.98/5.0 |
| Gaia | 2 | $143,747 | 25 | 4.94/5.0 |
| Lucia | 4 | $143,262 | 86 | 3.73/5.0 |
Analyzing the strategies of top hosts, such as their property selection, pricing, and guest communication, can offer valuable lessons for optimizing your own Airbnb operations in Lajares.
Dive Deeper: Advanced Lajares STR Market Data (2025)
Ready to unlock more insights? AirROI provides access to advanced metrics and comprehensive Airbnb data for Lajares. Explore detailed analytics beyond this report to refine your investment strategy, optimize pricing, and maximize your vacation rental profits.
Explore Advanced MetricsLajares Short-Term Rental Market Composition (2025): Property & Room Types
Room Type Distribution
Property Type Distribution
Market Composition Insights for Lajares
- The Lajares Airbnb market composition is heavily skewed towards Entire Home/Apt listings, which make up 93.1% of the 347 active rentals. This indicates strong guest preference for privacy and space.
- Looking at the property type distribution in Lajares, House properties are the most common (78.7%), reflecting the local real estate landscape.
- Houses represent a significant 78.7% portion, catering likely to families or larger groups.
- Smaller segments like others, hotel/boutique, outdoor/unique (combined 6.1%) offer potential for unique stay experiences.
Lajares Airbnb Room Capacity Analysis (2025): Bedroom Distribution
Distribution of Listings by Number of Bedrooms
Room Capacity Insights for Lajares
- The dominant room capacity in Lajares is 1 bedroom listings, making up 32.9% of the market. This suggests a strong demand for properties suitable for couples or solo travelers.
- Together, 1 bedroom and 2 bedrooms properties represent 56.8% of the active Airbnb listings in Lajares, indicating a high concentration in these sizes.
- A significant 34.9% of listings offer 3+ bedrooms, catering to larger groups and families seeking more space in Lajares.
Lajares Vacation Rental Guest Capacity Trends (2025)
Distribution of Listings by Guest Capacity
Guest Capacity Insights for Lajares
- The most common guest capacity trend in Lajares vacation rentals is listings accommodating 2 guests (26.2%). This suggests the primary traveler segment is likely couples or solo travelers.
- Properties designed for 2 guests and 4 guests dominate the Lajares STR market, accounting for 50.4% of listings.
- 35.1% of properties accommodate 6+ guests, serving the market segment for larger families or group travel in Lajares.
- On average, properties in Lajares are equipped to host 4.3 guests.
Lajares Airbnb Booking Patterns (2025): Available vs. Booked Days
Available Days Distribution
Booked Days Distribution
Booking Pattern Insights for Lajares
- The most common availability pattern in Lajares falls within the 271-366 days range, representing 28.8% of listings. This suggests many properties have significant open periods on their calendars.
- Approximately 57.6% of listings show high availability (181+ days open annually), indicating potential for increased bookings or specific owner usage patterns.
- For booked days, the 181-270 days range is most frequent in Lajares (28.5%), reflecting common guest stay durations or potential owner blocking patterns.
- A notable 44.1% of properties secure long booking periods (181+ days booked per year), highlighting successful long-term rental strategies or significant owner usage.
Lajares Airbnb Minimum Stay Requirements Analysis
Distribution of Listings by Minimum Night Requirement
1 Night
12 listings
3.6% of total
2 Nights
17 listings
5.1% of total
3 Nights
52 listings
15.5% of total
4-6 Nights
177 listings
52.7% of total
7-29 Nights
29 listings
8.6% of total
30+ Nights
49 listings
14.6% of total
Key Insights
- The most prevalent minimum stay requirement in Lajares is 4-6 Nights, adopted by 52.7% of listings. This highlights the market's preference for longer commitments.
- Very short stays (1-2 nights) are less common (8.7%), suggesting hosts prefer slightly longer bookings to optimize turnover.
- A significant segment (14.6%) caters to monthly stays (30+ nights) in Lajares, pointing to opportunities in the extended-stay market.
Recommendations
- Align with the market by considering a 4-6 Nights minimum stay, as 52.7% of Lajares hosts use this setting.
- If feasible, allowing 1-night stays, especially midweek or during low season, could capture last-minute bookings, as only 3.6% currently do.
- Explore offering discounts for stays of 30+ nights to attract the 14.6% of the market seeking extended stays.
- Adjust minimum nights based on seasonality – potentially shorter during low season and longer during peak demand periods in Lajares.
Lajares Airbnb Cancellation Policy Trends Analysis (2025)
Flexible
34 listings
10.8% of total
Moderate
68 listings
21.5% of total
Firm
86 listings
27.2% of total
Strict
128 listings
40.5% of total
Cancellation Policy Insights for Lajares
- The prevailing Airbnb cancellation policy trend in Lajares is Strict, used by 40.5% of listings.
- A majority (67.7%) of hosts in Lajares utilize Firm or Strict policies, indicating a market where hosts prioritize booking security.
Recommendations for Hosts
- Consider adopting a Strict policy to align with the 40.5% market standard in Lajares.
- With 40.5% using Strict terms, this is a viable option in Lajares, particularly for high-value properties or during peak demand periods.
- Regularly review your cancellation policy against competitors and market demand shifts in Lajares.
Lajares STR Booking Lead Time Analysis (2025)
Average Booking Lead Time by Month
Booking Lead Time Insights for Lajares
- The overall average booking lead time for vacation rentals in Lajares is 89 days.
- Guests book furthest in advance for stays during November (average 109 days), likely coinciding with peak travel demand or local events.
- The shortest booking windows occur for stays in May (average 80 days), indicating more last-minute travel plans during this time.
- Seasonally, Summer (101 days avg.) sees the longest lead times, while Spring (81 days avg.) has the shortest, reflecting typical travel planning cycles.
Recommendations for Hosts
- Use the overall average lead time (89 days) as a baseline for your pricing and availability strategy in Lajares.
- For November stays, consider implementing length-of-stay discounts or slightly higher rates for bookings made less than 109 days out to capitalize on advance planning.
- Target marketing efforts for the Summer season well in advance (at least 101 days) to capture early planners.
- Monitor your own booking lead times against these Lajares averages to identify opportunities for dynamic pricing adjustments.
Popular & Essential Airbnb Amenities in Lajares (2025)
Amenity Prevalence
Amenity Insights for Lajares
- Essential amenities in Lajares that guests expect include: Wifi, Kitchen, Essentials. Lacking these (any) could significantly impact bookings.
- Popular amenities like Free parking on premises, Hair dryer, Hot water are common but not universal. Offering these can provide a competitive edge.
Recommendations for Hosts
- Ensure your listing includes all essential amenities for Lajares: Wifi, Kitchen, Essentials.
- Prioritize adding missing essentials: Wifi, Kitchen, Essentials.
- Consider adding popular differentiators like Free parking on premises or Hair dryer to increase appeal.
- Highlight unique or less common amenities you offer (e.g., hot tub, dedicated workspace, EV charger) in your listing description and photos.
- Regularly check competitor amenities in Lajares to stay competitive.
Lajares Airbnb Guest Demographics & Profile Analysis (2025)
Guest Profile Summary for Lajares
- The typical guest profile for Airbnb in Lajares consists of predominantly international visitors (88%), with top international origins including United Kingdom, typically belonging to the Post-2000s (Gen Z/Alpha) group (50%), primarily speaking English or German.
- Domestic travelers account for 12.1% of guests.
- Key international markets include Germany (28.1%) and United Kingdom (17.2%).
- Top languages spoken are English (39.2%) followed by German (18.7%).
- A significant demographic segment is the Post-2000s (Gen Z/Alpha) group, representing 50% of guests.
Recommendations for Hosts
- Focus marketing internationally, particularly towards travelers from United Kingdom.
- Tailor amenities and listing descriptions to appeal to the dominant Post-2000s (Gen Z/Alpha) demographic (e.g., highlight fast WiFi, smart home features, local guides).
- Highlight unique local experiences or amenities relevant to the primary guest profile.
- Consider seasonal promotions aligned with peak travel times for key origin markets.
Nearby Short-Term Rental Market Comparison
How does the Lajares Airbnb market stack up against its neighbors? Compare key performance metrics like average monthly revenue, ADR, and occupancy rates in surrounding areas to understand the broader regional STR landscape.
| Market | Active Properties | Monthly Revenue | Daily Rate | Avg. Occupancy |
|---|---|---|---|---|
| Yaiza | 1,433 | $2,369 | $242.14 | 50% |
| Tías | 1,491 | $2,055 | $172.05 | 56% |
| Villaverde | 90 | $1,736 | $141.77 | 50% |
| Teguise | 1,351 | $1,657 | $127.61 | 56% |
| Haría | 475 | $1,465 | $142.83 | 50% |
| La Oliva | 2,055 | $1,370 | $123.32 | 50% |
| San Bartolomé | 293 | $1,329 | $124.34 | 51% |
| Tinajo | 234 | $1,258 | $124.77 | 51% |
| Antigua | 698 | $1,173 | $111.42 | 48% |
| El Cotillo | 465 | $1,165 | $103.94 | 48% |