La Orotava Airbnb Market Analysis 2025: Short Term Rental Data & Vacation Rental Statistics in Canary Islands, Spain
Is Airbnb profitable in La Orotava in 2025? Explore comprehensive Airbnb analytics for La Orotava, Canary Islands, Spain to uncover income potential. This 2025 STR market report for La Orotava, based on AirROI data from April 2024 to March 2025, reveals key trends in the market of 267 active listings.
Whether you're considering an Airbnb investment in La Orotava, optimizing your existing vacation rental, or exploring rental arbitrage opportunities, understanding the La Orotava Airbnb data is crucial. Navigating the high regulation landscape is key to maximizing your short term rental income potential. Let's dive into the specifics.
Key La Orotava Airbnb Performance Metrics Overview
Monthly Airbnb Revenue Variations & Income Potential in La Orotava (2025)
Understanding the monthly revenue variations for Airbnb listings in La Orotava is key to maximizing your short term rental income potential. Seasonality significantly impacts earnings. Our analysis, based on data from the past 12 months, shows that the peak revenue month for STRs in La Orotava is typically January, while September often presents the lowest earnings, highlighting opportunities for strategic pricing adjustments during shoulder and low seasons. Explore the typical Airbnb income in La Orotava across different performance tiers:
- Best-in-class properties (Top 10%) achieve $4,317+ monthly, often utilizing dynamic pricing and superior guest experiences.
- Strong performing properties (Top 25%) earn $2,853 or more, indicating effective management and desirable locations/amenities.
- Typical properties (Median) generate around $1,667 per month, representing the average market performance.
- Entry-level properties (Bottom 25%) see earnings around $871, often with potential for optimization.
Average Monthly Airbnb Earnings Trend in La Orotava
La Orotava Airbnb Occupancy Rate Trends (2025)
Maximize your bookings by understanding the La Orotava STR occupancy trends. Seasonal demand shifts significantly influence how often properties are booked. Typically, Februarysees the highest demand (peak season occupancy), while June experiences the lowest (low season). Effective strategies, like adjusting minimum stays or offering promotions, can boost occupancy during slower periods. Here's how different property tiers perform in La Orotava:
- Best-in-class properties (Top 10%) achieve 88%+ occupancy, indicating high desirability and potentially optimized availability.
- Strong performing properties (Top 25%) maintain 78% or higher occupancy, suggesting good market fit and guest satisfaction.
- Typical properties (Median) have an occupancy rate around 55%.
- Entry-level properties (Bottom 25%) average 31% occupancy, potentially facing higher vacancy.
Average Monthly Occupancy Rate Trend in La Orotava
Average Daily Rate (ADR) Airbnb Trends in La Orotava (2025)
Effective short term rental pricing strategy in La Orotava involves understanding monthly ADR fluctuations. The Average Daily Rate (ADR) for Airbnb in La Orotava typically peaks in January and dips lowest during September. Leveraging Airbnb dynamic pricing tools or strategies based on this seasonality can significantly boost revenue. Here's a look at the typical nightly rates achieved:
- Best-in-class properties (Top 10%) command rates of $241+ per night, often due to premium features or locations.
- Strong performing properties (Top 25%) achieve nightly rates of $154 or more.
- Typical properties (Median) charge around $102 per night.
- Entry-level properties (Bottom 25%) earn around $70 per night.
Average Daily Rate (ADR) Trend by Month in La Orotava
Get Live La Orotava Market Intelligence 👇

Explore Real-time Analytics
Airbnb Seasonality Analysis & Trends in La Orotava (2025)
Peak Season (January, February, December)
- Revenue averages $2,596 per month
- Occupancy rates average 66.5%
- Daily rates average $151
Shoulder Season
- Revenue averages $2,063 per month
- Occupancy maintains around 51.5%
- Daily rates hold near $135
Low Season (June, September, October)
- Revenue drops to average $1,664 per month
- Occupancy decreases to average 44.0%
- Daily rates adjust to average $128
Seasonality Insights for La Orotava
- The Airbnb seasonality in La Orotava shows moderate seasonality with distinct peak and low periods. While the sections above show seasonal averages, it's also insightful to look at the extremes:
- During the high season, the absolute peak month showcases La Orotava's highest earning potential, with monthly revenues capable of climbing to $2,719, occupancy reaching a high of 72.9%, and ADRs peaking at $153.
- Conversely, the slowest single month of the year, typically falling within the low season, marks the market's lowest point. In this month, revenue might dip to $1,566, occupancy could drop to 38.9%, and ADRs may adjust down to $127.
- Understanding both the seasonal averages and these monthly peaks and troughs in revenue, occupancy, and ADR is crucial for maximizing your Airbnb profit potential in La Orotava.
Seasonal Strategies for Maximizing Profit
- Peak Season: Maximize revenue through premium pricing and potentially longer minimum stays. Ensure high availability.
- Low Season: Offer competitive pricing, special promotions (e.g., extended stay discounts), and flexible cancellation policies. Target off-season travelers like remote workers or budget-conscious guests.
- Shoulder Seasons: Implement dynamic pricing that balances peak and low rates. Target weekend travelers or specific events. Offer slightly more flexible terms than peak season.
- Regularly analyze your own performance against these La Orotava seasonality benchmarks and adjust your pricing and availability strategy accordingly.
Best Areas for Airbnb Investment in La Orotava (2025)
Exploring the top neighborhoods for short-term rentals in La Orotava? This section highlights key areas, outlining why they are attractive for hosts and guests, along with notable local attractions. Consider these locations based on your target guest profile and investment strategy.
| Neighborhood / Area | Why Host Here? (Target Guests & Appeal) | Key Attractions & Landmarks |
|---|---|---|
| Puerto de la Cruz | Vibrant coastal town known for its beautiful beaches, botanical gardens, and lively promenade. A top destination for tourists seeking sun and leisure activities in Tenerife. | Lago Martianez, Jardin Botanico, Playa Jardin, El Lago del Puerto, Casa de la Aduana |
| La Orotava | Charming historical town with stunning architecture and lush landscapes. Offers a unique cultural experience and proximity to Teide National Park, attracting both tourists and nature lovers. | Casa de los Balcones, Church of La Concepcion, Teide National Park, Botanical Garden of La Orotava, Centro de Arte La Orotava |
| Los Realejos | Peaceful area with traditional Canarian architecture and beautiful coastal views. Popular for hiking and outdoor activities, making it appealing to adventurous travelers. | Montaña de Tigaiga, Mirador de San Pedro, Costa de Los Realejos, Parque Natural de La Corona Forestal |
| Icod de los Vinos | Known for its famous Dragon Tree and wine production, this town attracts visitors interested in Canarian culture and local gastronomy. | Drago Milenario, Cueva del Viento, Wine museums, Parque del Drago |
| Santa Ursula | A quaint town with fantastic views over the Atlantic and proximity to both beaches and hiking trails. Ideal for tourists who want a more relaxed atmosphere. | La Villa de Santa Ursula, Mirador de La Rambla, Playa de Las Galgas |
| El Sauzal | Famed for its wine and stunning views, it offers a more rural and tranquil environment, attracting those looking for a serene getaway. | Bodegas de El Sauzal, Mirador de La Garañona, Parque Natural de Anaga |
| Tegueste | Known for its agricultural landscape and traditional festivals. Popular with visitors looking to experience authentic Canarian culture. | Mercado Agrícola de Tegueste, Camino de Las Rutas, Parque de La Constitución |
| Candelaria | Important pilgrimage site with its beautiful basilica and charming coastal town atmosphere. Attracts spiritual tourists and beachgoers alike. | Basilica de Nuestra Señora de Candelaria, Playa de Candelaria, Cueva de Achbinico |
Understanding Airbnb License Requirements & STR Laws in La Orotava (2025)
Yes, La Orotava, Canary Islands, Spain enforces high STR regulations. Obtaining a license and ensuring compliance is almost certainly required according to current 2025 STR laws. Always verify the latest short term rental regulations and Airbnb license requirements directly with local government authorities for La Orotava to ensure full compliance before hosting.
(Source: AirROI data, 2025, based on 37% licensed listings)
Top Performing Airbnb Properties in La Orotava (2025)
Benchmark your potential! Explore examples of top-performing Airbnb properties in La Orotavabased on Trailing Twelve Month (TTM) revenue. Analyze their characteristics, revenue, occupancy rate, and ADR to understand what drives success in this market.
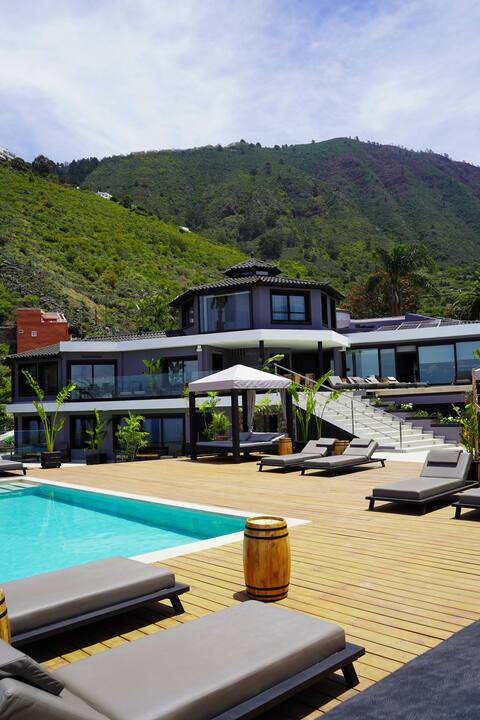
Villa Crone mit Infinity Pools Jacuzzi 4 Bedrooms
Entire Place • 4 bedrooms
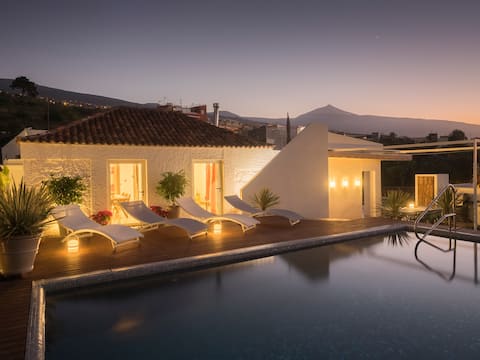
Casa Viña: a spectacular away from it all holiday
Entire Place • 3 bedrooms
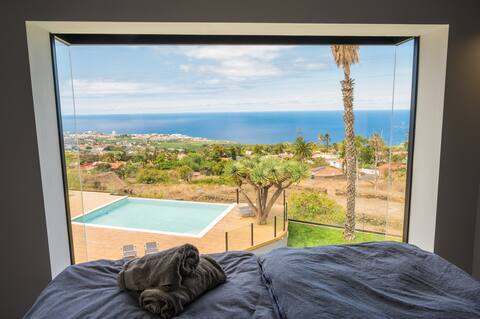
Villa Crone Seaview Penthouse InfinityPool Jacuzzi
Entire Place • 1 bedroom
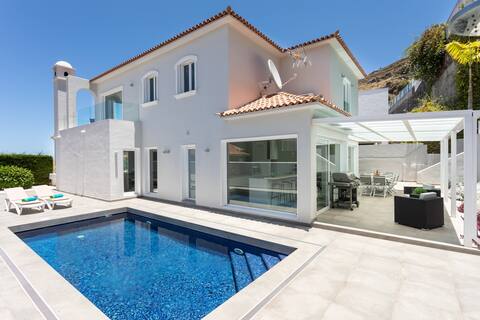
Modern house with heatable private pool and BBQ
Entire Place • 4 bedrooms
Bollullo Paradise
Entire Place • 3 bedrooms
Villa Cristal
Entire Place • 2 bedrooms
Note: Performance varies based on location, size, amenities, seasonality, and management quality. Data reflects the past 12 months.
Top Performing Airbnb Hosts in La Orotava (2025)
Learn from the best! This table showcases top-performing Airbnb hosts in La Orotava based on the number of properties managed and estimated total revenue over the past year. Analyze their scale and performance metrics.
| Host Name | Properties | Grossing Revenue | Stay Reviews | Avg Rating |
|---|---|---|---|---|
| Chris | 6 | $404,693 | 256 | 4.97/5.0 |
| Marta | 4 | $174,183 | 231 | 4.95/5.0 |
| Viviendas Viva | 6 | $139,918 | 634 | 4.09/5.0 |
| Badana | 3 | $138,106 | 287 | 4.94/5.0 |
| Parra | 3 | $101,802 | 100 | 4.61/5.0 |
| Bernard Ted | 4 | $97,381 | 586 | 4.95/5.0 |
| Hilary | 1 | $92,463 | 57 | 5.00/5.0 |
| Jose Antonio | 4 | $89,566 | 97 | 4.92/5.0 |
| Mario Y Fabian | 3 | $84,267 | 107 | 4.65/5.0 |
| Ruth | 3 | $83,619 | 97 | 4.88/5.0 |
Analyzing the strategies of top hosts, such as their property selection, pricing, and guest communication, can offer valuable lessons for optimizing your own Airbnb operations in La Orotava.
Dive Deeper: Advanced La Orotava STR Market Data (2025)
Ready to unlock more insights? AirROI provides access to advanced metrics and comprehensive Airbnb data for La Orotava. Explore detailed analytics beyond this report to refine your investment strategy, optimize pricing, and maximize your vacation rental profits.
Explore Advanced MetricsLa Orotava Short-Term Rental Market Composition (2025): Property & Room Types
Room Type Distribution
Property Type Distribution
Market Composition Insights for La Orotava
- The La Orotava Airbnb market composition is heavily skewed towards Entire Home/Apt listings, which make up 94.4% of the 267 active rentals. This indicates strong guest preference for privacy and space.
- Looking at the property type distribution in La Orotava, House properties are the most common (59.9%), reflecting the local real estate landscape.
- Houses represent a significant 59.9% portion, catering likely to families or larger groups.
- The presence of 6.4% Hotel/Boutique listings indicates integration with traditional hospitality.
- Smaller segments like outdoor/unique, others (combined 5.3%) offer potential for unique stay experiences.
La Orotava Airbnb Room Capacity Analysis (2025): Bedroom Distribution
Distribution of Listings by Number of Bedrooms
Room Capacity Insights for La Orotava
- The dominant room capacity in La Orotava is 1 bedroom listings, making up 41.9% of the market. This suggests a strong demand for properties suitable for couples or solo travelers.
- Together, 1 bedroom and 2 bedrooms properties represent 67.7% of the active Airbnb listings in La Orotava, indicating a high concentration in these sizes.
- A significant 24.8% of listings offer 3+ bedrooms, catering to larger groups and families seeking more space in La Orotava.
La Orotava Vacation Rental Guest Capacity Trends (2025)
Distribution of Listings by Guest Capacity
Guest Capacity Insights for La Orotava
- The most common guest capacity trend in La Orotava vacation rentals is listings accommodating 2 guests (30.7%). This suggests the primary traveler segment is likely couples or solo travelers.
- Properties designed for 2 guests and 4 guests dominate the La Orotava STR market, accounting for 54.7% of listings.
- 24.0% of properties accommodate 6+ guests, serving the market segment for larger families or group travel in La Orotava.
- On average, properties in La Orotava are equipped to host 3.8 guests.
La Orotava Airbnb Booking Patterns (2025): Available vs. Booked Days
Available Days Distribution
Booked Days Distribution
Booking Pattern Insights for La Orotava
- The most common availability pattern in La Orotava falls within the 181-270 days range, representing 31.8% of listings. This suggests many properties have significant open periods on their calendars.
- Approximately 59.5% of listings show high availability (181+ days open annually), indicating potential for increased bookings or specific owner usage patterns.
- For booked days, the 91-180 days range is most frequent in La Orotava (31.1%), reflecting common guest stay durations or potential owner blocking patterns.
- A notable 42.4% of properties secure long booking periods (181+ days booked per year), highlighting successful long-term rental strategies or significant owner usage.
La Orotava Airbnb Minimum Stay Requirements Analysis
Distribution of Listings by Minimum Night Requirement
1 Night
10 listings
4.1% of total
2 Nights
42 listings
17.1% of total
3 Nights
51 listings
20.8% of total
4-6 Nights
94 listings
38.4% of total
7-29 Nights
10 listings
4.1% of total
30+ Nights
38 listings
15.5% of total
Key Insights
- The most prevalent minimum stay requirement in La Orotava is 4-6 Nights, adopted by 38.4% of listings. This highlights the market's preference for longer commitments.
- A significant segment (15.5%) caters to monthly stays (30+ nights) in La Orotava, pointing to opportunities in the extended-stay market.
Recommendations
- Align with the market by considering a 4-6 Nights minimum stay, as 38.4% of La Orotava hosts use this setting.
- If feasible, allowing 1-night stays, especially midweek or during low season, could capture last-minute bookings, as only 4.1% currently do.
- Explore offering discounts for stays of 30+ nights to attract the 15.5% of the market seeking extended stays.
- Adjust minimum nights based on seasonality – potentially shorter during low season and longer during peak demand periods in La Orotava.
La Orotava Airbnb Cancellation Policy Trends Analysis (2025)
Super Strict 60 Days
4 listings
1.7% of total
Super Strict 30 Days
4 listings
1.7% of total
Flexible
35 listings
14.5% of total
Moderate
85 listings
35.3% of total
Firm
72 listings
29.9% of total
Strict
41 listings
17% of total
Cancellation Policy Insights for La Orotava
- The prevailing Airbnb cancellation policy trend in La Orotava is Moderate, used by 35.3% of listings.
- There's a relatively balanced mix between guest-friendly (49.8%) and stricter (46.9%) policies, offering choices for different guest needs.
Recommendations for Hosts
- Consider adopting a Moderate policy to align with the 35.3% market standard in La Orotava.
- Regularly review your cancellation policy against competitors and market demand shifts in La Orotava.
La Orotava STR Booking Lead Time Analysis (2025)
Average Booking Lead Time by Month
Booking Lead Time Insights for La Orotava
- The overall average booking lead time for vacation rentals in La Orotava is 70 days.
- Guests book furthest in advance for stays during July (average 87 days), likely coinciding with peak travel demand or local events.
- The shortest booking windows occur for stays in March (average 60 days), indicating more last-minute travel plans during this time.
- Seasonally, Winter (78 days avg.) sees the longest lead times, while Spring (71 days avg.) has the shortest, reflecting typical travel planning cycles.
Recommendations for Hosts
- Use the overall average lead time (70 days) as a baseline for your pricing and availability strategy in La Orotava.
- For July stays, consider implementing length-of-stay discounts or slightly higher rates for bookings made less than 87 days out to capitalize on advance planning.
- Target marketing efforts for the Winter season well in advance (at least 78 days) to capture early planners.
- Monitor your own booking lead times against these La Orotava averages to identify opportunities for dynamic pricing adjustments.
Popular & Essential Airbnb Amenities in La Orotava (2025)
Amenity Prevalence
Amenity Insights for La Orotava
- Essential amenities in La Orotava that guests expect include: Kitchen, Wifi. Lacking these (any) could significantly impact bookings.
- Popular amenities like Hot water, TV, Essentials are common but not universal. Offering these can provide a competitive edge.
Recommendations for Hosts
- Ensure your listing includes all essential amenities for La Orotava: Kitchen, Wifi.
- Prioritize adding missing essentials: Kitchen, Wifi.
- Consider adding popular differentiators like Hot water or TV to increase appeal.
- Highlight unique or less common amenities you offer (e.g., hot tub, dedicated workspace, EV charger) in your listing description and photos.
- Regularly check competitor amenities in La Orotava to stay competitive.
La Orotava Airbnb Guest Demographics & Profile Analysis (2025)
Guest Profile Summary for La Orotava
- The typical guest profile for Airbnb in La Orotava consists of predominantly international visitors (84%), with top international origins including Germany, typically belonging to the Post-2000s (Gen Z/Alpha) group (50%), primarily speaking English or French.
- Domestic travelers account for 16.2% of guests.
- Key international markets include France (21.7%) and Germany (21.4%).
- Top languages spoken are English (38.6%) followed by French (15.7%).
- A significant demographic segment is the Post-2000s (Gen Z/Alpha) group, representing 50% of guests.
Recommendations for Hosts
- Focus marketing internationally, particularly towards travelers from Germany.
- Tailor amenities and listing descriptions to appeal to the dominant Post-2000s (Gen Z/Alpha) demographic (e.g., highlight fast WiFi, smart home features, local guides).
- Highlight unique local experiences or amenities relevant to the primary guest profile.
- Consider seasonal promotions aligned with peak travel times for key origin markets.
Nearby Short-Term Rental Market Comparison
How does the La Orotava Airbnb market stack up against its neighbors? Compare key performance metrics like average monthly revenue, ADR, and occupancy rates in surrounding areas to understand the broader regional STR landscape.
| Market | Active Properties | Monthly Revenue | Daily Rate | Avg. Occupancy |
|---|---|---|---|---|
| El Sauzal | 94 | $2,759 | $231.94 | 52% |
| La Victoria de Acentejo | 18 | $2,591 | $227.75 | 54% |
| Santa Úrsula | 134 | $2,276 | $200.12 | 49% |
| Adeje | 3,043 | $2,203 | $189.97 | 51% |
| San Miguel de Abona | 666 | $1,918 | $173.37 | 49% |
| El Rosario | 227 | $1,846 | $140.14 | 56% |
| San Bartolomé de Tirajana | 2,717 | $1,640 | $155.10 | 48% |
| Los Realejos | 263 | $1,626 | $119.12 | 54% |
| Santiago del Teide | 773 | $1,616 | $140.24 | 50% |
| Agaete | 202 | $1,612 | $121.39 | 51% |