La Oliva Airbnb Market Analysis 2025: Short Term Rental Data & Vacation Rental Statistics in Canary Islands, Spain
Is Airbnb profitable in La Oliva in 2025? Explore comprehensive Airbnb analytics for La Oliva, Canary Islands, Spain to uncover income potential. This 2025 STR market report for La Oliva, based on AirROI data from April 2024 to March 2025, reveals key trends in the bustling market of 2,055 active listings.
Whether you're considering an Airbnb investment in La Oliva, optimizing your existing vacation rental, or exploring rental arbitrage opportunities, understanding the La Oliva Airbnb data is crucial. Navigating the high regulation landscape is key to maximizing your short term rental income potential. Let's dive into the specifics.
Key La Oliva Airbnb Performance Metrics Overview
Monthly Airbnb Revenue Variations & Income Potential in La Oliva (2025)
Understanding the monthly revenue variations for Airbnb listings in La Oliva is key to maximizing your short term rental income potential. Seasonality significantly impacts earnings. Our analysis, based on data from the past 12 months, shows that the peak revenue month for STRs in La Oliva is typically January, while March often presents the lowest earnings, highlighting opportunities for strategic pricing adjustments during shoulder and low seasons. Explore the typical Airbnb income in La Oliva across different performance tiers:
- Best-in-class properties (Top 10%) achieve $4,136+ monthly, often utilizing dynamic pricing and superior guest experiences.
- Strong performing properties (Top 25%) earn $2,469 or more, indicating effective management and desirable locations/amenities.
- Typical properties (Median) generate around $1,546 per month, representing the average market performance.
- Entry-level properties (Bottom 25%) see earnings around $815, often with potential for optimization.
Average Monthly Airbnb Earnings Trend in La Oliva
La Oliva Airbnb Occupancy Rate Trends (2025)
Maximize your bookings by understanding the La Oliva STR occupancy trends. Seasonal demand shifts significantly influence how often properties are booked. Typically, Februarysees the highest demand (peak season occupancy), while June experiences the lowest (low season). Effective strategies, like adjusting minimum stays or offering promotions, can boost occupancy during slower periods. Here's how different property tiers perform in La Oliva:
- Best-in-class properties (Top 10%) achieve 90%+ occupancy, indicating high desirability and potentially optimized availability.
- Strong performing properties (Top 25%) maintain 79% or higher occupancy, suggesting good market fit and guest satisfaction.
- Typical properties (Median) have an occupancy rate around 57%.
- Entry-level properties (Bottom 25%) average 29% occupancy, potentially facing higher vacancy.
Average Monthly Occupancy Rate Trend in La Oliva
Average Daily Rate (ADR) Airbnb Trends in La Oliva (2025)
Effective short term rental pricing strategy in La Oliva involves understanding monthly ADR fluctuations. The Average Daily Rate (ADR) for Airbnb in La Oliva typically peaks in December and dips lowest during May. Leveraging Airbnb dynamic pricing tools or strategies based on this seasonality can significantly boost revenue. Here's a look at the typical nightly rates achieved:
- Best-in-class properties (Top 10%) command rates of $223+ per night, often due to premium features or locations.
- Strong performing properties (Top 25%) achieve nightly rates of $128 or more.
- Typical properties (Median) charge around $85 per night.
- Entry-level properties (Bottom 25%) earn around $65 per night.
Average Daily Rate (ADR) Trend by Month in La Oliva
Get Live La Oliva Market Intelligence 👇

Explore Real-time Analytics
Airbnb Seasonality Analysis & Trends in La Oliva (2025)
Peak Season (January, November, December)
- Revenue averages $2,413 per month
- Occupancy rates average 65.6%
- Daily rates average $128
Shoulder Season
- Revenue averages $1,977 per month
- Occupancy maintains around 52.1%
- Daily rates hold near $121
Low Season (March, June, September)
- Revenue drops to average $1,683 per month
- Occupancy decreases to average 45.1%
- Daily rates adjust to average $121
Seasonality Insights for La Oliva
- The Airbnb seasonality in La Oliva shows moderate seasonality with distinct peak and low periods. While the sections above show seasonal averages, it's also insightful to look at the extremes:
- During the high season, the absolute peak month showcases La Oliva's highest earning potential, with monthly revenues capable of climbing to $2,461, occupancy reaching a high of 67.3%, and ADRs peaking at $130.
- Conversely, the slowest single month of the year, typically falling within the low season, marks the market's lowest point. In this month, revenue might dip to $1,675, occupancy could drop to 39.4%, and ADRs may adjust down to $118.
- Understanding both the seasonal averages and these monthly peaks and troughs in revenue, occupancy, and ADR is crucial for maximizing your Airbnb profit potential in La Oliva.
Seasonal Strategies for Maximizing Profit
- Peak Season: Maximize revenue through premium pricing and potentially longer minimum stays. Ensure high availability.
- Low Season: Offer competitive pricing, special promotions (e.g., extended stay discounts), and flexible cancellation policies. Target off-season travelers like remote workers or budget-conscious guests.
- Shoulder Seasons: Implement dynamic pricing that balances peak and low rates. Target weekend travelers or specific events. Offer slightly more flexible terms than peak season.
- Regularly analyze your own performance against these La Oliva seasonality benchmarks and adjust your pricing and availability strategy accordingly.
Best Areas for Airbnb Investment in La Oliva (2025)
Exploring the top neighborhoods for short-term rentals in La Oliva? This section highlights key areas, outlining why they are attractive for hosts and guests, along with notable local attractions. Consider these locations based on your target guest profile and investment strategy.
| Neighborhood / Area | Why Host Here? (Target Guests & Appeal) | Key Attractions & Landmarks |
|---|---|---|
| Corralejo | A bustling town known for its stunning beaches and vibrant nightlife. Corralejo is popular among tourists for its natural parks and watersports activities. | Corralejo Natural Park, Dunas de Corralejo, Isla de Lobos, Acua Water Park, Beach clubs, Local tapas bars |
| El Cotillo | A quaint fishing village that attracts those looking for a more laid-back beach experience. Famous for its pristine beaches and surf spots, making it ideal for families and surfers alike. | Cotillo Beaches, El Cala de Esquinzo, Los Lagos, Faro el Cotillo, Surf shops, Local seafood restaurants |
| Lajares | A charming village that serves as a gateway to various outdoor activities. Lajares is popular for its artisan shops and proximity to great hiking and biking trails. | Local artisan shops, Los Molinos, Mirador de Morro Velosa, Hiking trails, Traditional Canarian restaurants, Cultural festivals |
| Villaverde | A peaceful village located inland, offering a tranquil escape with stunning views and access to hiking paths. Popular for those seeking a quiet retreat from the busier tourist areas. | Scenic viewpoints, Hiking trails, Local farms, Traditional Canarian architecture, Quiet plazas, Art galleries |
| Majanicho | An off-the-beaten-path location known for its beautiful coastlines and laid-back vibe. Ideal for those looking to immerse themselves in nature and solitude. | Majanicho Beach, Natural swimming pools, Local surf spots, Pelados Beach, Community events, Coastal walks |
| Caleta de Fuste | Known for its family-friendly environment, Caleta de Fuste offers various attractions and activities that cater to all ages. It's a great spot for beach lovers. | Caleta de Fuste Beach, Artificial beach, Golf courses, Shopping centers, Water sports schools, Local nightlife |
| Puerto del Rosario | The capital of Fuerteventura, offering a mix of culture, shopping, and local life. Great for those looking to experience the local Canarian lifestyle plus tourist amenities. | Casa Museo Unamuno, Cultural Center, Shopping streets, Harbor views, Art exhibitions, Local markets |
| Costa de Antigua | A small coastal area offering a relaxed atmosphere and easy access to nearby attractions. It's perfect for families looking for a peaceful vacation experience. | Antigua Beach, Local parks, Family-friendly restaurants, Coastal walks, Nearby golf courses, Shopping opportunities |
Understanding Airbnb License Requirements & STR Laws in La Oliva (2025)
Yes, La Oliva, Canary Islands, Spain enforces high STR regulations. Obtaining a license and ensuring compliance is almost certainly required according to current 2025 STR laws. Always verify the latest short term rental regulations and Airbnb license requirements directly with local government authorities for La Oliva to ensure full compliance before hosting.
(Source: AirROI data, 2025, based on 34% licensed listings)
Top Performing Airbnb Properties in La Oliva (2025)
Benchmark your potential! Explore examples of top-performing Airbnb properties in La Olivabased on Trailing Twelve Month (TTM) revenue. Analyze their characteristics, revenue, occupancy rate, and ADR to understand what drives success in this market.
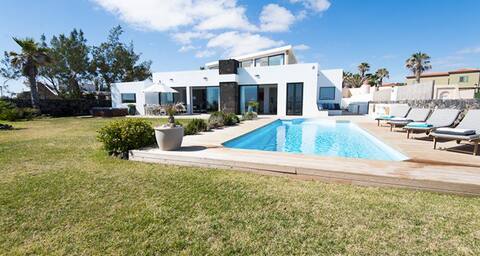
Oceanfront Villa Valhalla
Entire Place • 5 bedrooms
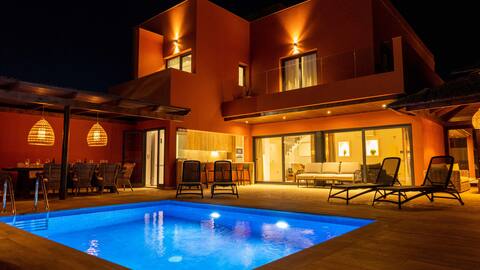
Luxury private villa with pool, Sabi Sabi Sabi
Entire Place • 4 bedrooms
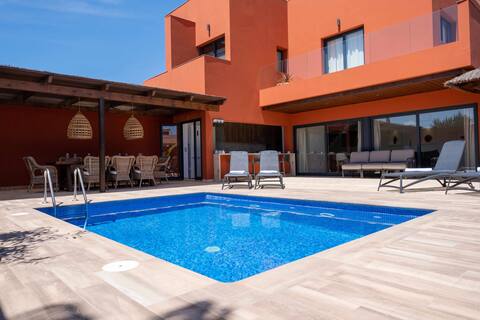
Luxury private villa with pool, Villa Wabi Sabi Villa
Entire Place • 4 bedrooms
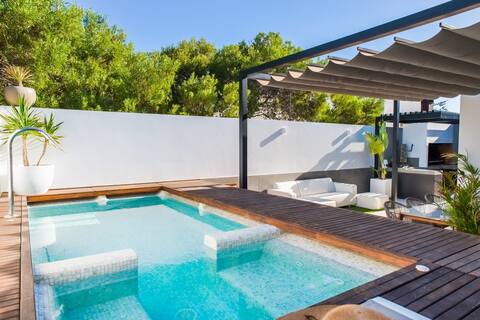
Villa Luxury Sunrise Private Pool Corralejo
Entire Place • 3 bedrooms
BUTTERFLY VILLA INCLEIBLES WATERFRONT VIEWS.
Entire Place • 5 bedrooms
Villa Ottavio Golden Park
Entire Place • 3 bedrooms
Note: Performance varies based on location, size, amenities, seasonality, and management quality. Data reflects the past 12 months.
Top Performing Airbnb Hosts in La Oliva (2025)
Learn from the best! This table showcases top-performing Airbnb hosts in La Oliva based on the number of properties managed and estimated total revenue over the past year. Analyze their scale and performance metrics.
| Host Name | Properties | Grossing Revenue | Stay Reviews | Avg Rating |
|---|---|---|---|---|
| HolidaysHome Fuerteventura | 28 | $1,179,601 | 472 | 4.41/5.0 |
| Natalia | 26 | $807,743 | 856 | 4.67/5.0 |
| Best Holidays Fuerteventura | 44 | $700,115 | 489 | 4.05/5.0 |
| Victor | 7 | $615,613 | 349 | 4.80/5.0 |
| Rafael | 47 | $573,673 | 535 | 3.93/5.0 |
| Home2Book | 17 | $542,132 | 168 | 3.68/5.0 |
| Regina | 11 | $508,479 | 545 | 4.85/5.0 |
| Olga | 23 | $464,824 | 448 | 4.12/5.0 |
| Dario | 9 | $341,413 | 357 | 4.86/5.0 |
| Nad / HomeManagementByNad | 13 | $341,063 | 873 | 4.85/5.0 |
Analyzing the strategies of top hosts, such as their property selection, pricing, and guest communication, can offer valuable lessons for optimizing your own Airbnb operations in La Oliva.
Dive Deeper: Advanced La Oliva STR Market Data (2025)
Ready to unlock more insights? AirROI provides access to advanced metrics and comprehensive Airbnb data for La Oliva. Explore detailed analytics beyond this report to refine your investment strategy, optimize pricing, and maximize your vacation rental profits.
Explore Advanced MetricsLa Oliva Short-Term Rental Market Composition (2025): Property & Room Types
Room Type Distribution
Property Type Distribution
Market Composition Insights for La Oliva
- The La Oliva Airbnb market composition is heavily skewed towards Entire Home/Apt listings, which make up 91.9% of the 2,055 active rentals. This indicates strong guest preference for privacy and space.
- Looking at the property type distribution in La Oliva, Apartment/Condo properties are the most common (56.8%), reflecting the local real estate landscape.
- Houses represent a significant 39.5% portion, catering likely to families or larger groups.
- Smaller segments like outdoor/unique, hotel/boutique, others, unique stays (combined 3.7%) offer potential for unique stay experiences.
La Oliva Airbnb Room Capacity Analysis (2025): Bedroom Distribution
Distribution of Listings by Number of Bedrooms
Room Capacity Insights for La Oliva
- The dominant room capacity in La Oliva is 1 bedroom listings, making up 45.5% of the market. This suggests a strong demand for properties suitable for couples or solo travelers.
- Together, 1 bedroom and 2 bedrooms properties represent 72.4% of the active Airbnb listings in La Oliva, indicating a high concentration in these sizes.
- A significant 20.3% of listings offer 3+ bedrooms, catering to larger groups and families seeking more space in La Oliva.
La Oliva Vacation Rental Guest Capacity Trends (2025)
Distribution of Listings by Guest Capacity
Guest Capacity Insights for La Oliva
- The most common guest capacity trend in La Oliva vacation rentals is listings accommodating 4 guests (37.2%). This suggests the primary traveler segment is likely small families or groups.
- Properties designed for 4 guests and 2 guests dominate the La Oliva STR market, accounting for 55.0% of listings.
- 21.4% of properties accommodate 6+ guests, serving the market segment for larger families or group travel in La Oliva.
- On average, properties in La Oliva are equipped to host 3.8 guests.
La Oliva Airbnb Booking Patterns (2025): Available vs. Booked Days
Available Days Distribution
Booked Days Distribution
Booking Pattern Insights for La Oliva
- The most common availability pattern in La Oliva falls within the 271-366 days range, representing 36.6% of listings. This suggests many properties have significant open periods on their calendars.
- Approximately 63.7% of listings show high availability (181+ days open annually), indicating potential for increased bookings or specific owner usage patterns.
- For booked days, the 91-180 days range is most frequent in La Oliva (26.5%), reflecting common guest stay durations or potential owner blocking patterns.
- A notable 37.6% of properties secure long booking periods (181+ days booked per year), highlighting successful long-term rental strategies or significant owner usage.
La Oliva Airbnb Minimum Stay Requirements Analysis
Distribution of Listings by Minimum Night Requirement
1 Night
158 listings
8.1% of total
2 Nights
111 listings
5.7% of total
3 Nights
408 listings
21% of total
4-6 Nights
863 listings
44.4% of total
7-29 Nights
143 listings
7.4% of total
30+ Nights
261 listings
13.4% of total
Key Insights
- The most prevalent minimum stay requirement in La Oliva is 4-6 Nights, adopted by 44.4% of listings. This highlights the market's preference for longer commitments.
- Very short stays (1-2 nights) are less common (13.8%), suggesting hosts prefer slightly longer bookings to optimize turnover.
- A significant segment (13.4%) caters to monthly stays (30+ nights) in La Oliva, pointing to opportunities in the extended-stay market.
Recommendations
- Align with the market by considering a 4-6 Nights minimum stay, as 44.4% of La Oliva hosts use this setting.
- If feasible, allowing 1-night stays, especially midweek or during low season, could capture last-minute bookings, as only 8.1% currently do.
- Explore offering discounts for stays of 30+ nights to attract the 13.4% of the market seeking extended stays.
- Adjust minimum nights based on seasonality – potentially shorter during low season and longer during peak demand periods in La Oliva.
La Oliva Airbnb Cancellation Policy Trends Analysis (2025)
Super Strict 30 Days
9 listings
0.5% of total
Super Strict 60 Days
12 listings
0.7% of total
Refundable
1 listings
0.1% of total
Flexible
255 listings
14.8% of total
Moderate
578 listings
33.6% of total
Firm
447 listings
26% of total
Strict
419 listings
24.3% of total
Cancellation Policy Insights for La Oliva
- The prevailing Airbnb cancellation policy trend in La Oliva is Moderate, used by 33.6% of listings.
- A majority (50.3%) of hosts in La Oliva utilize Firm or Strict policies, indicating a market where hosts prioritize booking security.
Recommendations for Hosts
- Consider adopting a Moderate policy to align with the 33.6% market standard in La Oliva.
- Regularly review your cancellation policy against competitors and market demand shifts in La Oliva.
La Oliva STR Booking Lead Time Analysis (2025)
Average Booking Lead Time by Month
Booking Lead Time Insights for La Oliva
- The overall average booking lead time for vacation rentals in La Oliva is 75 days.
- Guests book furthest in advance for stays during January (average 91 days), likely coinciding with peak travel demand or local events.
- The shortest booking windows occur for stays in April (average 69 days), indicating more last-minute travel plans during this time.
- Seasonally, Winter (90 days avg.) sees the longest lead times, while Spring (72 days avg.) has the shortest, reflecting typical travel planning cycles.
Recommendations for Hosts
- Use the overall average lead time (75 days) as a baseline for your pricing and availability strategy in La Oliva.
- For January stays, consider implementing length-of-stay discounts or slightly higher rates for bookings made less than 91 days out to capitalize on advance planning.
- Target marketing efforts for the Winter season well in advance (at least 90 days) to capture early planners.
- Monitor your own booking lead times against these La Oliva averages to identify opportunities for dynamic pricing adjustments.
Popular & Essential Airbnb Amenities in La Oliva (2025)
Amenity Prevalence
Amenity Insights for La Oliva
- Essential amenities in La Oliva that guests expect include: Kitchen, Wifi. Lacking these (any) could significantly impact bookings.
- Popular amenities like TV, Washer, Essentials are common but not universal. Offering these can provide a competitive edge.
Recommendations for Hosts
- Ensure your listing includes all essential amenities for La Oliva: Kitchen, Wifi.
- Prioritize adding missing essentials: Kitchen, Wifi.
- Consider adding popular differentiators like TV or Washer to increase appeal.
- Highlight unique or less common amenities you offer (e.g., hot tub, dedicated workspace, EV charger) in your listing description and photos.
- Regularly check competitor amenities in La Oliva to stay competitive.
La Oliva Airbnb Guest Demographics & Profile Analysis (2025)
Guest Profile Summary for La Oliva
- The typical guest profile for Airbnb in La Oliva consists of predominantly international visitors (83%), with top international origins including Germany, typically belonging to the Post-2000s (Gen Z/Alpha) group (50%), primarily speaking English or Spanish.
- Domestic travelers account for 17.2% of guests.
- Key international markets include United Kingdom (23.7%) and Germany (18.6%).
- Top languages spoken are English (39.5%) followed by Spanish (15.1%).
- A significant demographic segment is the Post-2000s (Gen Z/Alpha) group, representing 50% of guests.
Recommendations for Hosts
- Focus marketing internationally, particularly towards travelers from Germany.
- Tailor amenities and listing descriptions to appeal to the dominant Post-2000s (Gen Z/Alpha) demographic (e.g., highlight fast WiFi, smart home features, local guides).
- Highlight unique local experiences or amenities relevant to the primary guest profile.
- Consider seasonal promotions aligned with peak travel times for key origin markets.
Nearby Short-Term Rental Market Comparison
How does the La Oliva Airbnb market stack up against its neighbors? Compare key performance metrics like average monthly revenue, ADR, and occupancy rates in surrounding areas to understand the broader regional STR landscape.
| Market | Active Properties | Monthly Revenue | Daily Rate | Avg. Occupancy |
|---|---|---|---|---|
| Yaiza | 1,433 | $2,369 | $242.14 | 50% |
| Lajares | 347 | $2,137 | $169.68 | 53% |
| Tías | 1,491 | $2,055 | $172.05 | 56% |
| Villaverde | 90 | $1,736 | $141.77 | 50% |
| Teguise | 1,351 | $1,657 | $127.61 | 56% |
| Haría | 475 | $1,465 | $142.83 | 50% |
| San Bartolomé | 293 | $1,329 | $124.34 | 51% |
| Tinajo | 234 | $1,258 | $124.77 | 51% |
| Antigua | 698 | $1,173 | $111.42 | 48% |
| El Cotillo | 465 | $1,165 | $103.94 | 48% |