Frontera Airbnb Market Analysis 2025: Short Term Rental Data & Vacation Rental Statistics in Canary Islands, Spain
Is Airbnb profitable in Frontera in 2025? Explore comprehensive Airbnb analytics for Frontera, Canary Islands, Spain to uncover income potential. This 2025 STR market report for Frontera, based on AirROI data from April 2024 to March 2025, reveals key trends in the niche market of 114 active listings.
Whether you're considering an Airbnb investment in Frontera, optimizing your existing vacation rental, or exploring rental arbitrage opportunities, understanding the Frontera Airbnb data is crucial. Understanding the local regulations is key to maximizing your short term rental income potential. Let's dive into the specifics.
Key Frontera Airbnb Performance Metrics Overview
Monthly Airbnb Revenue Variations & Income Potential in Frontera (2025)
Understanding the monthly revenue variations for Airbnb listings in Frontera is key to maximizing your short term rental income potential. Seasonality significantly impacts earnings. Our analysis, based on data from the past 12 months, shows that the peak revenue month for STRs in Frontera is typically August, while March often presents the lowest earnings, highlighting opportunities for strategic pricing adjustments during shoulder and low seasons. Explore the typical Airbnb income in Frontera across different performance tiers:
- Best-in-class properties (Top 10%) achieve $2,146+ monthly, often utilizing dynamic pricing and superior guest experiences.
- Strong performing properties (Top 25%) earn $1,400 or more, indicating effective management and desirable locations/amenities.
- Typical properties (Median) generate around $832 per month, representing the average market performance.
- Entry-level properties (Bottom 25%) see earnings around $458, often with potential for optimization.
Average Monthly Airbnb Earnings Trend in Frontera
Frontera Airbnb Occupancy Rate Trends (2025)
Maximize your bookings by understanding the Frontera STR occupancy trends. Seasonal demand shifts significantly influence how often properties are booked. Typically, Augustsees the highest demand (peak season occupancy), while June experiences the lowest (low season). Effective strategies, like adjusting minimum stays or offering promotions, can boost occupancy during slower periods. Here's how different property tiers perform in Frontera:
- Best-in-class properties (Top 10%) achieve 79%+ occupancy, indicating high desirability and potentially optimized availability.
- Strong performing properties (Top 25%) maintain 62% or higher occupancy, suggesting good market fit and guest satisfaction.
- Typical properties (Median) have an occupancy rate around 35%.
- Entry-level properties (Bottom 25%) average 17% occupancy, potentially facing higher vacancy.
Average Monthly Occupancy Rate Trend in Frontera
Average Daily Rate (ADR) Airbnb Trends in Frontera (2025)
Effective short term rental pricing strategy in Frontera involves understanding monthly ADR fluctuations. The Average Daily Rate (ADR) for Airbnb in Frontera typically peaks in December and dips lowest during April. Leveraging Airbnb dynamic pricing tools or strategies based on this seasonality can significantly boost revenue. Here's a look at the typical nightly rates achieved:
- Best-in-class properties (Top 10%) command rates of $162+ per night, often due to premium features or locations.
- Strong performing properties (Top 25%) achieve nightly rates of $112 or more.
- Typical properties (Median) charge around $76 per night.
- Entry-level properties (Bottom 25%) earn around $61 per night.
Average Daily Rate (ADR) Trend by Month in Frontera
Get Live Frontera Market Intelligence 👇

Explore Real-time Analytics
Airbnb Seasonality Analysis & Trends in Frontera (2025)
Peak Season (August, July, December)
- Revenue averages $1,348 per month
- Occupancy rates average 49.2%
- Daily rates average $104
Shoulder Season
- Revenue averages $1,084 per month
- Occupancy maintains around 38.7%
- Daily rates hold near $100
Low Season (February, March, June)
- Revenue drops to average $939 per month
- Occupancy decreases to average 34.8%
- Daily rates adjust to average $105
Seasonality Insights for Frontera
- The Airbnb seasonality in Frontera shows moderate seasonality with distinct peak and low periods. While the sections above show seasonal averages, it's also insightful to look at the extremes:
- During the high season, the absolute peak month showcases Frontera's highest earning potential, with monthly revenues capable of climbing to $1,557, occupancy reaching a high of 61.3%, and ADRs peaking at $112.
- Conversely, the slowest single month of the year, typically falling within the low season, marks the market's lowest point. In this month, revenue might dip to $851, occupancy could drop to 32.2%, and ADRs may adjust down to $94.
- Understanding both the seasonal averages and these monthly peaks and troughs in revenue, occupancy, and ADR is crucial for maximizing your Airbnb profit potential in Frontera.
Seasonal Strategies for Maximizing Profit
- Peak Season: Maximize revenue through premium pricing and potentially longer minimum stays. Ensure high availability.
- Low Season: Offer competitive pricing, special promotions (e.g., extended stay discounts), and flexible cancellation policies. Target off-season travelers like remote workers or budget-conscious guests.
- Shoulder Seasons: Implement dynamic pricing that balances peak and low rates. Target weekend travelers or specific events. Offer slightly more flexible terms than peak season.
- Regularly analyze your own performance against these Frontera seasonality benchmarks and adjust your pricing and availability strategy accordingly.
Best Areas for Airbnb Investment in Frontera (2025)
Exploring the top neighborhoods for short-term rentals in Frontera? This section highlights key areas, outlining why they are attractive for hosts and guests, along with notable local attractions. Consider these locations based on your target guest profile and investment strategy.
| Neighborhood / Area | Why Host Here? (Target Guests & Appeal) | Key Attractions & Landmarks |
|---|---|---|
| Playa del Inglés | One of the most popular tourist destinations in Gran Canaria, renowned for its stunning beaches and vibrant nightlife. Ideal for attracting beach-loving tourists looking for sun and relaxation. | Dunes of Maspalomas, Cita Shopping Center, Aqualand Maspalomas, Maspalomas Lighthouse, Palmitos Park |
| Las Palmas | The capital city of Gran Canaria, offering a mix of culture, shopping, and beautiful beaches. Great for attracting guests looking for urban experiences along with beach relaxation. | Las Canteras Beach, Vegueta (Old Town), Catedral de Santa Ana, Parque de Santa Catalina, Elder Museum of Science and Technology |
| Maspalomas | Famous for its stunning sand dunes and natural landscapes. Attracts tourists seeking tranquility and beautiful outdoor experiences. | Maspalomas Dunes, Palmitos Park, La Charca, Maspalomas Golf, Aqualand Maspalomas |
| San Agustín | A quieter alternative to Playa del Inglés, offering beautiful beaches and a more relaxed atmosphere. Popular among families and couples. | San Agustín Beach, Playa de las Burras, Shopping and dining along the seafront, Aquarium Poema del Mar, Nearby golf courses |
| Amadores | Offers a stunning beach and a more laid-back atmosphere compared to busier areas. Ideal for couples and families looking for relaxing getaways. | Amadores Beach, Pueblo Canario, Lago Taurito, Nearby water sports activities, Restaurants along the beach |
| Puerto Rico | A popular resort area with a large marina and beautiful beaches. Attracts tourists for water sports and vibrant nightlife. | Puerto Rico Beach, Mogan Port, Beach clubs, Shopping centres, Outdoor sports activities |
| Costa Meloneras | Known for its luxurious resorts and beautiful seafront promenade. Great for attracting upscale tourists looking for leisure and relaxation. | Meloneras Beach, Golf course, Shopping and dining in Meloneras, Boulevard El Faro, Natural Pools |
| Telde | Offers a more local experience and is less touristy. Ideal for guests looking to explore local culture while still being near the coast. | Casa de la Cultura, Telde's historical sites, Pine-covered mountains, Nearby beaches, Natural parks |
Understanding Airbnb License Requirements & STR Laws in Frontera (2025)
With 25% of listings showing registration in 2025, understanding potential Airbnb license requirements is crucial in Frontera. Always verify the latest short term rental regulations and Airbnb license requirements directly with local government authorities for Frontera to ensure full compliance before hosting.
(Source: AirROI data, 2025, based on 25% licensed listings)
Top Performing Airbnb Properties in Frontera (2025)
Benchmark your potential! Explore examples of top-performing Airbnb properties in Fronterabased on Trailing Twelve Month (TTM) revenue. Analyze their characteristics, revenue, occupancy rate, and ADR to understand what drives success in this market.
La Cuadra de Juan
Entire Place • 3 bedrooms

VILLA MARSALADA. great views and tranquility.
Entire Place • 2 bedrooms

Vivienda Vacacional Casa El Matorral - El Hierro
Entire Place • 5 bedrooms
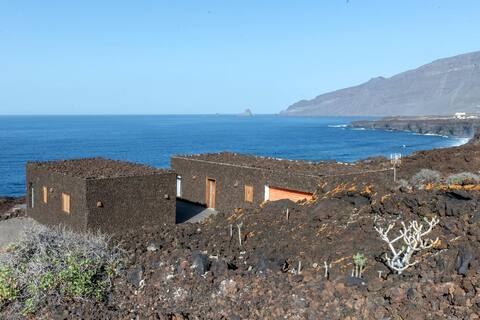
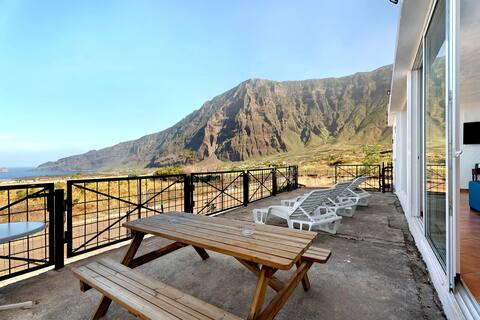
UNIQUE VOLCANIC HOUSE BY THE SEA
Entire Place • 3 bedrooms

Casa La Picota
Entire Place • 2 bedrooms
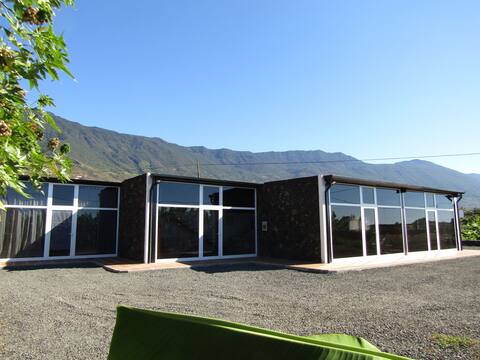
AMAZING BIG COAST HOUSE ON A TRANQUIL ORGANIC FARM
Entire Place • 6 bedrooms
Note: Performance varies based on location, size, amenities, seasonality, and management quality. Data reflects the past 12 months.
Top Performing Airbnb Hosts in Frontera (2025)
Learn from the best! This table showcases top-performing Airbnb hosts in Frontera based on the number of properties managed and estimated total revenue over the past year. Analyze their scale and performance metrics.
| Host Name | Properties | Grossing Revenue | Stay Reviews | Avg Rating |
|---|---|---|---|---|
| Maritza | 5 | $89,286 | 731 | 4.85/5.0 |
| Javier | 7 | $80,141 | 88 | 3.81/5.0 |
| Holidu | 1 | $64,776 | 17 | 4.47/5.0 |
| Maria De Fatima | 8 | $54,547 | 84 | 4.58/5.0 |
| El Hierro Hosting | 5 | $46,038 | 13 | 2.56/5.0 |
| Dimas | 3 | $39,248 | 125 | 4.80/5.0 |
| Román | 1 | $35,205 | 28 | 5.00/5.0 |
| Mar | 3 | $34,106 | 226 | 4.71/5.0 |
| El Sitio | 5 | $30,554 | 92 | 4.89/5.0 |
| Yessica | 1 | $27,379 | 50 | 4.94/5.0 |
Analyzing the strategies of top hosts, such as their property selection, pricing, and guest communication, can offer valuable lessons for optimizing your own Airbnb operations in Frontera.
Dive Deeper: Advanced Frontera STR Market Data (2025)
Ready to unlock more insights? AirROI provides access to advanced metrics and comprehensive Airbnb data for Frontera. Explore detailed analytics beyond this report to refine your investment strategy, optimize pricing, and maximize your vacation rental profits.
Explore Advanced MetricsFrontera Short-Term Rental Market Composition (2025): Property & Room Types
Room Type Distribution
Property Type Distribution
Market Composition Insights for Frontera
- The Frontera Airbnb market composition is heavily skewed towards Entire Home/Apt listings, which make up 100% of the 114 active rentals. This indicates strong guest preference for privacy and space.
- Looking at the property type distribution in Frontera, House properties are the most common (71.1%), reflecting the local real estate landscape.
- Houses represent a significant 71.1% portion, catering likely to families or larger groups.
- Smaller segments like outdoor/unique, hotel/boutique, others (combined 3.6%) offer potential for unique stay experiences.
Frontera Airbnb Room Capacity Analysis (2025): Bedroom Distribution
Distribution of Listings by Number of Bedrooms
Room Capacity Insights for Frontera
- The dominant room capacity in Frontera is 1 bedroom listings, making up 39.5% of the market. This suggests a strong demand for properties suitable for couples or solo travelers.
- Together, 1 bedroom and 2 bedrooms properties represent 74.6% of the active Airbnb listings in Frontera, indicating a high concentration in these sizes.
Frontera Vacation Rental Guest Capacity Trends (2025)
Distribution of Listings by Guest Capacity
Guest Capacity Insights for Frontera
- The most common guest capacity trend in Frontera vacation rentals is listings accommodating 4 guests (40.4%). This suggests the primary traveler segment is likely small families or groups.
- Properties designed for 4 guests and 2 guests dominate the Frontera STR market, accounting for 69.3% of listings.
- 16.7% of properties accommodate 6+ guests, serving the market segment for larger families or group travel in Frontera.
- On average, properties in Frontera are equipped to host 3.9 guests.
Frontera Airbnb Booking Patterns (2025): Available vs. Booked Days
Available Days Distribution
Booked Days Distribution
Booking Pattern Insights for Frontera
- The most common availability pattern in Frontera falls within the 271-366 days range, representing 52.6% of listings. This suggests many properties have significant open periods on their calendars.
- Approximately 80.7% of listings show high availability (181+ days open annually), indicating potential for increased bookings or specific owner usage patterns.
- For booked days, the 31-90 days range is most frequent in Frontera (37.7%), reflecting common guest stay durations or potential owner blocking patterns.
- A notable 21.9% of properties secure long booking periods (181+ days booked per year), highlighting successful long-term rental strategies or significant owner usage.
Frontera Airbnb Minimum Stay Requirements Analysis
Distribution of Listings by Minimum Night Requirement
1 Night
12 listings
10.7% of total
2 Nights
18 listings
16.1% of total
3 Nights
44 listings
39.3% of total
4-6 Nights
24 listings
21.4% of total
7-29 Nights
2 listings
1.8% of total
30+ Nights
12 listings
10.7% of total
Key Insights
- The most prevalent minimum stay requirement in Frontera is 3 Nights, adopted by 39.3% of listings. This highlights the market's preference for longer commitments.
- A significant segment (10.7%) caters to monthly stays (30+ nights) in Frontera, pointing to opportunities in the extended-stay market.
Recommendations
- Align with the market by considering a 3 Nights minimum stay, as 39.3% of Frontera hosts use this setting.
- If feasible, allowing 1-night stays, especially midweek or during low season, could capture last-minute bookings, as only 10.7% currently do.
- Explore offering discounts for stays of 30+ nights to attract the 10.7% of the market seeking extended stays.
- Adjust minimum nights based on seasonality – potentially shorter during low season and longer during peak demand periods in Frontera.
Frontera Airbnb Cancellation Policy Trends Analysis (2025)
Super Strict 30 Days
1 listings
1% of total
Flexible
16 listings
15.2% of total
Moderate
30 listings
28.6% of total
Firm
15 listings
14.3% of total
Strict
43 listings
41% of total
Cancellation Policy Insights for Frontera
- The prevailing Airbnb cancellation policy trend in Frontera is Strict, used by 41% of listings.
- A majority (55.3%) of hosts in Frontera utilize Firm or Strict policies, indicating a market where hosts prioritize booking security.
Recommendations for Hosts
- Consider adopting a Strict policy to align with the 41% market standard in Frontera.
- With 41% using Strict terms, this is a viable option in Frontera, particularly for high-value properties or during peak demand periods.
- Regularly review your cancellation policy against competitors and market demand shifts in Frontera.
Frontera STR Booking Lead Time Analysis (2025)
Average Booking Lead Time by Month
Booking Lead Time Insights for Frontera
- The overall average booking lead time for vacation rentals in Frontera is 67 days.
- Guests book furthest in advance for stays during November (average 85 days), likely coinciding with peak travel demand or local events.
- The shortest booking windows occur for stays in March (average 53 days), indicating more last-minute travel plans during this time.
- Seasonally, Winter (73 days avg.) sees the longest lead times, while Spring (63 days avg.) has the shortest, reflecting typical travel planning cycles.
Recommendations for Hosts
- Use the overall average lead time (67 days) as a baseline for your pricing and availability strategy in Frontera.
- For November stays, consider implementing length-of-stay discounts or slightly higher rates for bookings made less than 85 days out to capitalize on advance planning.
- Target marketing efforts for the Winter season well in advance (at least 73 days) to capture early planners.
- Monitor your own booking lead times against these Frontera averages to identify opportunities for dynamic pricing adjustments.
Popular & Essential Airbnb Amenities in Frontera (2025)
Amenity Prevalence
Amenity Insights for Frontera
- Essential amenities in Frontera that guests expect include: Kitchen. Lacking these (this) could significantly impact bookings.
- Popular amenities like Essentials, Wifi, TV are common but not universal. Offering these can provide a competitive edge.
- Warning: Wifi is not universally provided but is considered essential globally. Ensure reliable Wifi is offered.
Recommendations for Hosts
- Ensure your listing includes all essential amenities for Frontera: Kitchen.
- Consider adding popular differentiators like Essentials or Wifi to increase appeal.
- Highlight unique or less common amenities you offer (e.g., hot tub, dedicated workspace, EV charger) in your listing description and photos.
- Regularly check competitor amenities in Frontera to stay competitive.
Frontera Airbnb Guest Demographics & Profile Analysis (2025)
Guest Profile Summary for Frontera
- The typical guest profile for Airbnb in Frontera consists of a mix of domestic (58%) and international guests, often arriving from nearby Santa Cruz de Tenerife, typically belonging to the Post-2000s (Gen Z/Alpha) group (50%), primarily speaking English or Spanish.
- Domestic travelers account for 57.6% of guests.
- Key international markets include Spain (57.6%) and Germany (13.8%).
- Top languages spoken are English (33.1%) followed by Spanish (30.9%).
- A significant demographic segment is the Post-2000s (Gen Z/Alpha) group, representing 50% of guests.
Recommendations for Hosts
- Balance marketing efforts between domestic and international channels based on the guest mix.
- Tailor amenities and listing descriptions to appeal to the dominant Post-2000s (Gen Z/Alpha) demographic (e.g., highlight fast WiFi, smart home features, local guides).
- Highlight unique local experiences or amenities relevant to the primary guest profile.
- Consider seasonal promotions aligned with peak travel times for key origin markets.
Nearby Short-Term Rental Market Comparison
How does the Frontera Airbnb market stack up against its neighbors? Compare key performance metrics like average monthly revenue, ADR, and occupancy rates in surrounding areas to understand the broader regional STR landscape.
| Market | Active Properties | Monthly Revenue | Daily Rate | Avg. Occupancy |
|---|---|---|---|---|
| Barlovento | 18 | $1,312 | $130.60 | 48% |
| Puntallana | 49 | $1,303 | $97.69 | 48% |
| San Andrés y Sauces | 28 | $1,283 | $98.11 | 47% |
| Tijarafe | 156 | $1,263 | $147.58 | 45% |
| Garafía | 47 | $1,157 | $76.88 | 56% |
| Santa Cruz de la Palma | 167 | $1,133 | $93.32 | 49% |
| Agulo | 37 | $1,130 | $73.20 | 51% |
| San Sebastián de la Gomera | 120 | $1,076 | $108.60 | 45% |
| Puntagorda | 75 | $1,021 | $131.48 | 43% |
| Breña Alta | 68 | $1,021 | $98.07 | 42% |