Fasnia Airbnb Market Analysis 2025: Short Term Rental Data & Vacation Rental Statistics in Canary Islands, Spain
Is Airbnb profitable in Fasnia in 2025? Explore comprehensive Airbnb analytics for Fasnia, Canary Islands, Spain to uncover income potential. This 2025 STR market report for Fasnia, based on AirROI data from April 2024 to March 2025, reveals key trends in the niche market of 63 active listings.
Whether you're considering an Airbnb investment in Fasnia, optimizing your existing vacation rental, or exploring rental arbitrage opportunities, understanding the Fasnia Airbnb data is crucial. Navigating the high regulation landscape is key to maximizing your short term rental income potential. Let's dive into the specifics.
Key Fasnia Airbnb Performance Metrics Overview
Monthly Airbnb Revenue Variations & Income Potential in Fasnia (2025)
Understanding the monthly revenue variations for Airbnb listings in Fasnia is key to maximizing your short term rental income potential. Seasonality significantly impacts earnings. Our analysis, based on data from the past 12 months, shows that the peak revenue month for STRs in Fasnia is typically May, while September often presents the lowest earnings, highlighting opportunities for strategic pricing adjustments during shoulder and low seasons. Explore the typical Airbnb income in Fasnia across different performance tiers:
- Best-in-class properties (Top 10%) achieve $2,923+ monthly, often utilizing dynamic pricing and superior guest experiences.
- Strong performing properties (Top 25%) earn $1,789 or more, indicating effective management and desirable locations/amenities.
- Typical properties (Median) generate around $1,058 per month, representing the average market performance.
- Entry-level properties (Bottom 25%) see earnings around $564, often with potential for optimization.
Average Monthly Airbnb Earnings Trend in Fasnia
Fasnia Airbnb Occupancy Rate Trends (2025)
Maximize your bookings by understanding the Fasnia STR occupancy trends. Seasonal demand shifts significantly influence how often properties are booked. Typically, Januarysees the highest demand (peak season occupancy), while June experiences the lowest (low season). Effective strategies, like adjusting minimum stays or offering promotions, can boost occupancy during slower periods. Here's how different property tiers perform in Fasnia:
- Best-in-class properties (Top 10%) achieve 82%+ occupancy, indicating high desirability and potentially optimized availability.
- Strong performing properties (Top 25%) maintain 63% or higher occupancy, suggesting good market fit and guest satisfaction.
- Typical properties (Median) have an occupancy rate around 40%.
- Entry-level properties (Bottom 25%) average 19% occupancy, potentially facing higher vacancy.
Average Monthly Occupancy Rate Trend in Fasnia
Average Daily Rate (ADR) Airbnb Trends in Fasnia (2025)
Effective short term rental pricing strategy in Fasnia involves understanding monthly ADR fluctuations. The Average Daily Rate (ADR) for Airbnb in Fasnia typically peaks in January and dips lowest during April. Leveraging Airbnb dynamic pricing tools or strategies based on this seasonality can significantly boost revenue. Here's a look at the typical nightly rates achieved:
- Best-in-class properties (Top 10%) command rates of $198+ per night, often due to premium features or locations.
- Strong performing properties (Top 25%) achieve nightly rates of $105 or more.
- Typical properties (Median) charge around $83 per night.
- Entry-level properties (Bottom 25%) earn around $57 per night.
Average Daily Rate (ADR) Trend by Month in Fasnia
Get Live Fasnia Market Intelligence 👇

Explore Real-time Analytics
Airbnb Seasonality Analysis & Trends in Fasnia (2025)
Peak Season (May, April, August)
- Revenue averages $1,948 per month
- Occupancy rates average 39.5%
- Daily rates average $95
Shoulder Season
- Revenue averages $1,479 per month
- Occupancy maintains around 46.9%
- Daily rates hold near $106
Low Season (March, September, October)
- Revenue drops to average $1,165 per month
- Occupancy decreases to average 39.2%
- Daily rates adjust to average $99
Seasonality Insights for Fasnia
- The Airbnb seasonality in Fasnia shows moderate seasonality with distinct peak and low periods. While the sections above show seasonal averages, it's also insightful to look at the extremes:
- During the high season, the absolute peak month showcases Fasnia's highest earning potential, with monthly revenues capable of climbing to $2,122, occupancy reaching a high of 57.0%, and ADRs peaking at $112.
- Conversely, the slowest single month of the year, typically falling within the low season, marks the market's lowest point. In this month, revenue might dip to $1,120, occupancy could drop to 26.8%, and ADRs may adjust down to $94.
- Understanding both the seasonal averages and these monthly peaks and troughs in revenue, occupancy, and ADR is crucial for maximizing your Airbnb profit potential in Fasnia.
Seasonal Strategies for Maximizing Profit
- Peak Season: Maximize revenue through premium pricing and potentially longer minimum stays. Ensure high availability.
- Low Season: Offer competitive pricing, special promotions (e.g., extended stay discounts), and flexible cancellation policies. Target off-season travelers like remote workers or budget-conscious guests.
- Shoulder Seasons: Implement dynamic pricing that balances peak and low rates. Target weekend travelers or specific events. Offer slightly more flexible terms than peak season.
- Regularly analyze your own performance against these Fasnia seasonality benchmarks and adjust your pricing and availability strategy accordingly.
Best Areas for Airbnb Investment in Fasnia (2025)
Exploring the top neighborhoods for short-term rentals in Fasnia? This section highlights key areas, outlining why they are attractive for hosts and guests, along with notable local attractions. Consider these locations based on your target guest profile and investment strategy.
| Neighborhood / Area | Why Host Here? (Target Guests & Appeal) | Key Attractions & Landmarks |
|---|---|---|
| Playa del Medano | Most popular beach in Tenerife, known for its golden sands and water sports. Perfect for beach lovers and adventure seekers looking for a lively atmosphere. | El Médano Beach, Montaña Roja, Wind Surfing Paradise, Los Abrigos, Chiringuito de El Médano |
| Fasnia Town Center | Cultural and historical hub of Fasnia, offering visitors a glimpse into local Canarian life. Great for tourists interested in authentic experiences and local cuisine. | Iglesia de San Joaquín, Local markets, Canarian cuisine restaurants, Cultural heritage sites |
| Hiking Trails of Fasnia | Surrounding natural landscapes offer breathtaking views and hiking opportunities. Ideal for nature lovers and outdoor enthusiasts looking to explore. | Los Roques de Fasnia, Anaga Rural Park, Hiking routes to Teide, Lush landscapes, Beautiful viewpoints |
| Coastal Walks in Fasnia | Stunning coastal paths and views that attract tourists interested in scenic walks and photography. | Fasnia coastline, Sunset viewpoints, Local flora and fauna, Natural pools |
| Polígono Industrial de Fasnia | Industrial area with growing business opportunities. Suitable for short-term rentals for business travelers and workers. | Local businesses, Industrial parks, Easy access to main roads |
| La Caldera | Natural reserve area known for its tranquil environment and local wildlife. A peaceful retreat favored by those looking for relaxation. | Natural reserve, Wildlife watching, Picnic areas, Relaxing atmosphere |
| Cultural Events Space | Host local events, craft fairs, and festivals. Attractive area for renters interested in local culture and community. | Local festivals, Craft markets, Cultural workshops |
| Agricultural Tours | Fasnia is known for its agriculture, offering visitors tours of local farms and produce. Great for eco-tourists and those interested in sustainability. | Local farms, Canarian produce tasting, Organic farming tours |
Understanding Airbnb License Requirements & STR Laws in Fasnia (2025)
Yes, Fasnia, Canary Islands, Spain enforces high STR regulations. Obtaining a license and ensuring compliance is almost certainly required according to current 2025 STR laws. Always verify the latest short term rental regulations and Airbnb license requirements directly with local government authorities for Fasnia to ensure full compliance before hosting.
(Source: AirROI data, 2025, based on 32% licensed listings)
Top Performing Airbnb Properties in Fasnia (2025)
Benchmark your potential! Explore examples of top-performing Airbnb properties in Fasniabased on Trailing Twelve Month (TTM) revenue. Analyze their characteristics, revenue, occupancy rate, and ADR to understand what drives success in this market.
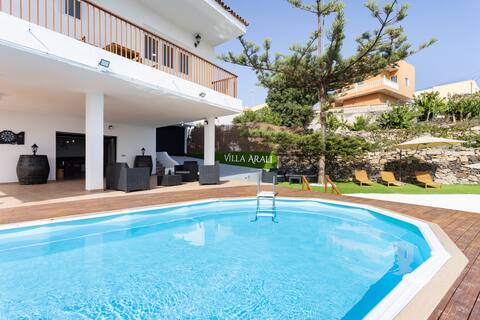
Lightbooking Villa Arali Luxury Renovated in Tenerife
Entire Place • 5 bedrooms
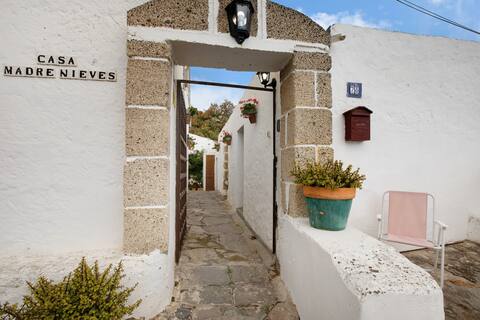
Casa Rural Madre Nieves
Entire Place • 2 bedrooms

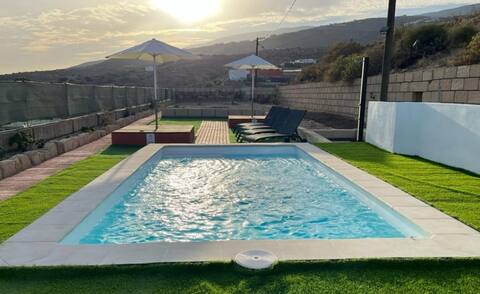
Las Casas del Camino Real III
Entire Place • 2 bedrooms

THE HOUSES ON THE ROYAL ROAD
Entire Place • 2 bedrooms

Las Casas del Camino Real II
Entire Place • 2 bedrooms
Lucrecia farm
Entire Place • 2 bedrooms
Note: Performance varies based on location, size, amenities, seasonality, and management quality. Data reflects the past 12 months.
Top Performing Airbnb Hosts in Fasnia (2025)
Learn from the best! This table showcases top-performing Airbnb hosts in Fasnia based on the number of properties managed and estimated total revenue over the past year. Analyze their scale and performance metrics.
| Host Name | Properties | Grossing Revenue | Stay Reviews | Avg Rating |
|---|---|---|---|---|
| Carmen | 3 | $106,474 | 190 | 4.87/5.0 |
| Gustavo | 1 | $68,408 | 23 | 4.43/5.0 |
| Holidu | 1 | $42,562 | 7 | 4.29/5.0 |
| Marta | 5 | $36,258 | 44 | 3.72/5.0 |
| Holidu | 1 | $33,277 | 5 | 5.00/5.0 |
| Anja And Wanja | 7 | $32,099 | 100 | 4.11/5.0 |
| Steve | 1 | $28,918 | 76 | 5.00/5.0 |
| Holidu | 3 | $27,867 | 41 | 4.64/5.0 |
| Ruiman | 3 | $22,852 | 101 | 4.75/5.0 |
| Jose Iban | 2 | $20,795 | 74 | 4.91/5.0 |
Analyzing the strategies of top hosts, such as their property selection, pricing, and guest communication, can offer valuable lessons for optimizing your own Airbnb operations in Fasnia.
Dive Deeper: Advanced Fasnia STR Market Data (2025)
Ready to unlock more insights? AirROI provides access to advanced metrics and comprehensive Airbnb data for Fasnia. Explore detailed analytics beyond this report to refine your investment strategy, optimize pricing, and maximize your vacation rental profits.
Explore Advanced MetricsFasnia Short-Term Rental Market Composition (2025): Property & Room Types
Room Type Distribution
Property Type Distribution
Market Composition Insights for Fasnia
- The Fasnia Airbnb market composition is heavily skewed towards Entire Home/Apt listings, which make up 87.3% of the 63 active rentals. This indicates strong guest preference for privacy and space.
- Looking at the property type distribution in Fasnia, House properties are the most common (61.9%), reflecting the local real estate landscape.
- Houses represent a significant 61.9% portion, catering likely to families or larger groups.
- The presence of 7.9% Hotel/Boutique listings indicates integration with traditional hospitality.
- Smaller segments like unique stays (combined 4.8%) offer potential for unique stay experiences.
Fasnia Airbnb Room Capacity Analysis (2025): Bedroom Distribution
Distribution of Listings by Number of Bedrooms
Room Capacity Insights for Fasnia
- The dominant room capacity in Fasnia is 2 bedrooms listings, making up 49.2% of the market. This suggests a strong demand for properties suitable for couples or solo travelers.
- Together, 2 bedrooms and 1 bedroom properties represent 82.5% of the active Airbnb listings in Fasnia, indicating a high concentration in these sizes.
- Listings with 3+ bedrooms (8.0%) represent a smaller niche, potentially indicating an underserved market for larger group accommodations in Fasnia.
Fasnia Vacation Rental Guest Capacity Trends (2025)
Distribution of Listings by Guest Capacity
Guest Capacity Insights for Fasnia
- The most common guest capacity trend in Fasnia vacation rentals is listings accommodating 4 guests (36.5%). This suggests the primary traveler segment is likely small families or groups.
- Properties designed for 4 guests and 2 guests dominate the Fasnia STR market, accounting for 52.4% of listings.
- 14.3% of properties accommodate 6+ guests, serving the market segment for larger families or group travel in Fasnia.
- On average, properties in Fasnia are equipped to host 3.7 guests.
Fasnia Airbnb Booking Patterns (2025): Available vs. Booked Days
Available Days Distribution
Booked Days Distribution
Booking Pattern Insights for Fasnia
- The most common availability pattern in Fasnia falls within the 271-366 days range, representing 52.4% of listings. This suggests many properties have significant open periods on their calendars.
- Approximately 82.6% of listings show high availability (181+ days open annually), indicating potential for increased bookings or specific owner usage patterns.
- For booked days, the 31-90 days range is most frequent in Fasnia (33.3%), reflecting common guest stay durations or potential owner blocking patterns.
- A notable 19.0% of properties secure long booking periods (181+ days booked per year), highlighting successful long-term rental strategies or significant owner usage.
Fasnia Airbnb Minimum Stay Requirements Analysis
Distribution of Listings by Minimum Night Requirement
1 Night
9 listings
15% of total
2 Nights
10 listings
16.7% of total
3 Nights
10 listings
16.7% of total
4-6 Nights
25 listings
41.7% of total
7-29 Nights
2 listings
3.3% of total
30+ Nights
4 listings
6.7% of total
Key Insights
- The most prevalent minimum stay requirement in Fasnia is 4-6 Nights, adopted by 41.7% of listings. This highlights the market's preference for longer commitments.
Recommendations
- Align with the market by considering a 4-6 Nights minimum stay, as 41.7% of Fasnia hosts use this setting.
- If feasible, allowing 1-night stays, especially midweek or during low season, could capture last-minute bookings, as only 15% currently do.
- Explore offering discounts for stays of 30+ nights to attract the 6.7% of the market seeking extended stays.
- Adjust minimum nights based on seasonality – potentially shorter during low season and longer during peak demand periods in Fasnia.
Fasnia Airbnb Cancellation Policy Trends Analysis (2025)
Super Strict 30 Days
1 listings
1.9% of total
Flexible
13 listings
25% of total
Moderate
14 listings
26.9% of total
Firm
12 listings
23.1% of total
Strict
12 listings
23.1% of total
Cancellation Policy Insights for Fasnia
- The prevailing Airbnb cancellation policy trend in Fasnia is Moderate, used by 26.9% of listings.
- There's a relatively balanced mix between guest-friendly (51.9%) and stricter (46.2%) policies, offering choices for different guest needs.
Recommendations for Hosts
- Consider adopting a Moderate policy to align with the 26.9% market standard in Fasnia.
- Regularly review your cancellation policy against competitors and market demand shifts in Fasnia.
Fasnia STR Booking Lead Time Analysis (2025)
Average Booking Lead Time by Month
Booking Lead Time Insights for Fasnia
- The overall average booking lead time for vacation rentals in Fasnia is 62 days.
- Guests book furthest in advance for stays during June (average 99 days), likely coinciding with peak travel demand or local events.
- The shortest booking windows occur for stays in March (average 60 days), indicating more last-minute travel plans during this time.
- Seasonally, Summer (90 days avg.) sees the longest lead times, while Winter (68 days avg.) has the shortest, reflecting typical travel planning cycles.
Recommendations for Hosts
- Use the overall average lead time (62 days) as a baseline for your pricing and availability strategy in Fasnia.
- For June stays, consider implementing length-of-stay discounts or slightly higher rates for bookings made less than 99 days out to capitalize on advance planning.
- Target marketing efforts for the Summer season well in advance (at least 90 days) to capture early planners.
- Monitor your own booking lead times against these Fasnia averages to identify opportunities for dynamic pricing adjustments.
Popular & Essential Airbnb Amenities in Fasnia (2025)
Amenity Prevalence
Amenity Insights for Fasnia
- Essential amenities in Fasnia that guests expect include: Kitchen, Essentials. Lacking these (any) could significantly impact bookings.
- Popular amenities like Wifi, Hot water, Coffee maker are common but not universal. Offering these can provide a competitive edge.
- Warning: Wifi is not universally provided but is considered essential globally. Ensure reliable Wifi is offered.
Recommendations for Hosts
- Ensure your listing includes all essential amenities for Fasnia: Kitchen, Essentials.
- Prioritize adding missing essentials: Kitchen, Essentials.
- Consider adding popular differentiators like Wifi or Hot water to increase appeal.
- Highlight unique or less common amenities you offer (e.g., hot tub, dedicated workspace, EV charger) in your listing description and photos.
- Regularly check competitor amenities in Fasnia to stay competitive.
Fasnia Airbnb Guest Demographics & Profile Analysis (2025)
Guest Profile Summary for Fasnia
- The typical guest profile for Airbnb in Fasnia consists of predominantly international visitors (85%), with top international origins including France, typically belonging to the Post-2000s (Gen Z/Alpha) group (50%), primarily speaking English or German.
- Domestic travelers account for 15.5% of guests.
- Key international markets include Germany (23.9%) and France (18.8%).
- Top languages spoken are English (38.4%) followed by German (15.5%).
- A significant demographic segment is the Post-2000s (Gen Z/Alpha) group, representing 50% of guests.
Recommendations for Hosts
- Focus marketing internationally, particularly towards travelers from France.
- Tailor amenities and listing descriptions to appeal to the dominant Post-2000s (Gen Z/Alpha) demographic (e.g., highlight fast WiFi, smart home features, local guides).
- Highlight unique local experiences or amenities relevant to the primary guest profile.
- Consider seasonal promotions aligned with peak travel times for key origin markets.
Nearby Short-Term Rental Market Comparison
How does the Fasnia Airbnb market stack up against its neighbors? Compare key performance metrics like average monthly revenue, ADR, and occupancy rates in surrounding areas to understand the broader regional STR landscape.
| Market | Active Properties | Monthly Revenue | Daily Rate | Avg. Occupancy |
|---|---|---|---|---|
| El Sauzal | 94 | $2,759 | $231.94 | 52% |
| La Victoria de Acentejo | 18 | $2,591 | $227.75 | 54% |
| Santa Úrsula | 134 | $2,276 | $200.12 | 49% |
| Adeje | 3,043 | $2,203 | $189.97 | 51% |
| San Miguel de Abona | 666 | $1,918 | $173.37 | 49% |
| El Rosario | 227 | $1,846 | $140.14 | 56% |
| San Bartolomé de Tirajana | 2,717 | $1,640 | $155.10 | 48% |
| Los Realejos | 263 | $1,626 | $119.12 | 54% |
| Santiago del Teide | 773 | $1,616 | $140.24 | 50% |
| La Orotava | 267 | $1,614 | $133.19 | 51% |