El Paso Airbnb Market Analysis 2025: Short Term Rental Data & Vacation Rental Statistics in Canary Islands, Spain
Is Airbnb profitable in El Paso in 2025? Explore comprehensive Airbnb analytics for El Paso, Canary Islands, Spain to uncover income potential. This 2025 STR market report for El Paso, based on AirROI data from April 2024 to March 2025, reveals key trends in the niche market of 163 active listings.
Whether you're considering an Airbnb investment in El Paso, optimizing your existing vacation rental, or exploring rental arbitrage opportunities, understanding the El Paso Airbnb data is crucial. Understanding the local regulations is key to maximizing your short term rental income potential. Let's dive into the specifics.
Key El Paso Airbnb Performance Metrics Overview
Monthly Airbnb Revenue Variations & Income Potential in El Paso (2025)
Understanding the monthly revenue variations for Airbnb listings in El Paso is key to maximizing your short term rental income potential. Seasonality significantly impacts earnings. Our analysis, based on data from the past 12 months, shows that the peak revenue month for STRs in El Paso is typically January, while September often presents the lowest earnings, highlighting opportunities for strategic pricing adjustments during shoulder and low seasons. Explore the typical Airbnb income in El Paso across different performance tiers:
- Best-in-class properties (Top 10%) achieve $2,572+ monthly, often utilizing dynamic pricing and superior guest experiences.
- Strong performing properties (Top 25%) earn $1,762 or more, indicating effective management and desirable locations/amenities.
- Typical properties (Median) generate around $1,048 per month, representing the average market performance.
- Entry-level properties (Bottom 25%) see earnings around $520, often with potential for optimization.
Average Monthly Airbnb Earnings Trend in El Paso
El Paso Airbnb Occupancy Rate Trends (2025)
Maximize your bookings by understanding the El Paso STR occupancy trends. Seasonal demand shifts significantly influence how often properties are booked. Typically, Januarysees the highest demand (peak season occupancy), while June experiences the lowest (low season). Effective strategies, like adjusting minimum stays or offering promotions, can boost occupancy during slower periods. Here's how different property tiers perform in El Paso:
- Best-in-class properties (Top 10%) achieve 84%+ occupancy, indicating high desirability and potentially optimized availability.
- Strong performing properties (Top 25%) maintain 68% or higher occupancy, suggesting good market fit and guest satisfaction.
- Typical properties (Median) have an occupancy rate around 42%.
- Entry-level properties (Bottom 25%) average 21% occupancy, potentially facing higher vacancy.
Average Monthly Occupancy Rate Trend in El Paso
Average Daily Rate (ADR) Airbnb Trends in El Paso (2025)
Effective short term rental pricing strategy in El Paso involves understanding monthly ADR fluctuations. The Average Daily Rate (ADR) for Airbnb in El Paso typically peaks in February and dips lowest during September. Leveraging Airbnb dynamic pricing tools or strategies based on this seasonality can significantly boost revenue. Here's a look at the typical nightly rates achieved:
- Best-in-class properties (Top 10%) command rates of $178+ per night, often due to premium features or locations.
- Strong performing properties (Top 25%) achieve nightly rates of $110 or more.
- Typical properties (Median) charge around $86 per night.
- Entry-level properties (Bottom 25%) earn around $66 per night.
Average Daily Rate (ADR) Trend by Month in El Paso
Get Live El Paso Market Intelligence 👇

Explore Real-time Analytics
Airbnb Seasonality Analysis & Trends in El Paso (2025)
Peak Season (January, December, February)
- Revenue averages $1,654 per month
- Occupancy rates average 59.1%
- Daily rates average $117
Shoulder Season
- Revenue averages $1,291 per month
- Occupancy maintains around 41.5%
- Daily rates hold near $101
Low Season (March, September, October)
- Revenue drops to average $1,121 per month
- Occupancy decreases to average 37.0%
- Daily rates adjust to average $104
Seasonality Insights for El Paso
- The Airbnb seasonality in El Paso shows moderate seasonality with distinct peak and low periods. While the sections above show seasonal averages, it's also insightful to look at the extremes:
- During the high season, the absolute peak month showcases El Paso's highest earning potential, with monthly revenues capable of climbing to $1,777, occupancy reaching a high of 61.4%, and ADRs peaking at $118.
- Conversely, the slowest single month of the year, typically falling within the low season, marks the market's lowest point. In this month, revenue might dip to $1,093, occupancy could drop to 33.7%, and ADRs may adjust down to $98.
- Understanding both the seasonal averages and these monthly peaks and troughs in revenue, occupancy, and ADR is crucial for maximizing your Airbnb profit potential in El Paso.
Seasonal Strategies for Maximizing Profit
- Peak Season: Maximize revenue through premium pricing and potentially longer minimum stays. Ensure high availability.
- Low Season: Offer competitive pricing, special promotions (e.g., extended stay discounts), and flexible cancellation policies. Target off-season travelers like remote workers or budget-conscious guests.
- Shoulder Seasons: Implement dynamic pricing that balances peak and low rates. Target weekend travelers or specific events. Offer slightly more flexible terms than peak season.
- Regularly analyze your own performance against these El Paso seasonality benchmarks and adjust your pricing and availability strategy accordingly.
Best Areas for Airbnb Investment in El Paso (2025)
Exploring the top neighborhoods for short-term rentals in El Paso? This section highlights key areas, outlining why they are attractive for hosts and guests, along with notable local attractions. Consider these locations based on your target guest profile and investment strategy.
| Neighborhood / Area | Why Host Here? (Target Guests & Appeal) | Key Attractions & Landmarks |
|---|---|---|
| Las Palmas | The capital city of Gran Canaria, renowned for its beaches, vibrant culture, and historical sites. A major tourist destination with beautiful coastal views and bustling city life. | Las Canteras Beach, Vegueta, Casa de Colón, Parque de Santa Catalina, Museo Elder de la Ciencia y la Tecnología |
| Maspalomas | Famous for its stunning dunes and beaches, Maspalomas offers a unique desert-like landscape next to the ocean. Popular with families and couples looking for a relaxing getaway. | Maspalomas Dunes, Maspalomas Lighthouse, Palmitos Park, Aqualand Maspalomas, Golf court |
| Playa del Inglés | A lively resort area known for its nightlife and wide sandy beaches. An attractive location for young travelers seeking fun and entertainment. | Playa del Inglés Beach, Yumbo Centrum, Kasbah Centre, Dunas de Maspalomas, Cita Centre |
| San Agustín | A quieter, more relaxed beach destination ideal for families and couples. Offers a wide range of amenities and beautiful scenery. | San Agustín Beach, Playa de las Burras, Thalasso Gloria San Agustín, Shopping centers |
| Puerto de Mogán | Often referred to as 'Little Venice', this picturesque fishing village is known for its canals and charming architecture. A tranquil spot for visitors wanting a scenic retreat. | Puerto de Mogán Beach, Mogán Market, Boat trips, Restaurants by the water |
| Taurito | A peaceful coastal area offering stunning views and a relaxed atmosphere. Perfect for travelers seeking tranquility combined with beautiful natural surroundings. | Playa Taurito, Mogán Beach, Aquapark Taurito, Scenic viewpoints |
| Telde | A historic town known for its cultural heritage and proximity to beautiful natural landscapes. Attracts tourists looking for an authentic experience away from the more commercial tourist spots. | Cueva de los dibujos, Iglesia de San Juan, Parque de los Tatares, Playa de La Garita |
| Agüimes | A charming town with unique Canarian architecture and rich history. Ideal for visitors who want to explore local culture and traditions, away from tourist crowds. | Agüimes Historic Center, Museo de Historia de Agüimes, Cerro de la Arita, Playa de Vargas |
Understanding Airbnb License Requirements & STR Laws in El Paso (2025)
With 21% of listings showing registration in 2025, understanding potential Airbnb license requirements is crucial in El Paso. Always verify the latest short term rental regulations and Airbnb license requirements directly with local government authorities for El Paso to ensure full compliance before hosting.
(Source: AirROI data, 2025, based on 21% licensed listings)
Top Performing Airbnb Properties in El Paso (2025)
Benchmark your potential! Explore examples of top-performing Airbnb properties in El Pasobased on Trailing Twelve Month (TTM) revenue. Analyze their characteristics, revenue, occupancy rate, and ADR to understand what drives success in this market.

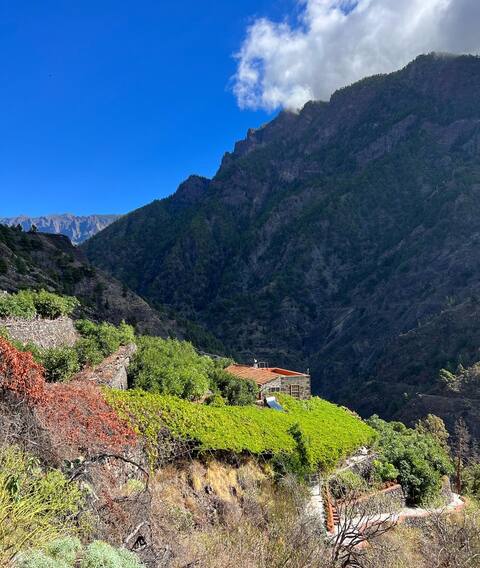
Villa Quinta Valencia - peace & quiet on La Palma
Entire Place • 5 bedrooms
Casa Luminaria de la Caldera
Entire Place • 1 bedroom

Casa Kika. Home ideal for families and groups.
Entire Place • 5 bedrooms

Casa La Plaza
Entire Place • 2 bedrooms

Casa Cordobes by Huskalia
Entire Place • 1 bedroom

Casa Duque - views, Jacuzzi, Jacuzzi, sauna and pool
Entire Place • 3 bedrooms
Note: Performance varies based on location, size, amenities, seasonality, and management quality. Data reflects the past 12 months.
Top Performing Airbnb Hosts in El Paso (2025)
Learn from the best! This table showcases top-performing Airbnb hosts in El Paso based on the number of properties managed and estimated total revenue over the past year. Analyze their scale and performance metrics.
| Host Name | Properties | Grossing Revenue | Stay Reviews | Avg Rating |
|---|---|---|---|---|
| Turismo Rural Isla Bonita | 4 | $71,115 | 115 | 4.79/5.0 |
| Ian | 1 | $65,600 | 17 | 4.82/5.0 |
| Huskalia | 3 | $60,758 | 32 | 4.60/5.0 |
| Victoria | 1 | $48,502 | 14 | 5.00/5.0 |
| David | 1 | $45,683 | 17 | 5.00/5.0 |
| Henry | 3 | $44,700 | 45 | 4.80/5.0 |
| Holidu | 2 | $43,519 | 3 | 2.50/5.0 |
| Lidia | 2 | $42,164 | 323 | 4.78/5.0 |
| Jose Antonio | 4 | $42,071 | 57 | 4.92/5.0 |
| Jessica | 2 | $40,951 | 152 | 4.96/5.0 |
Analyzing the strategies of top hosts, such as their property selection, pricing, and guest communication, can offer valuable lessons for optimizing your own Airbnb operations in El Paso.
Dive Deeper: Advanced El Paso STR Market Data (2025)
Ready to unlock more insights? AirROI provides access to advanced metrics and comprehensive Airbnb data for El Paso. Explore detailed analytics beyond this report to refine your investment strategy, optimize pricing, and maximize your vacation rental profits.
Explore Advanced MetricsEl Paso Short-Term Rental Market Composition (2025): Property & Room Types
Room Type Distribution
Property Type Distribution
Market Composition Insights for El Paso
- The El Paso Airbnb market composition is heavily skewed towards Entire Home/Apt listings, which make up 88.3% of the 163 active rentals. This indicates strong guest preference for privacy and space.
- Looking at the property type distribution in El Paso, House properties are the most common (58.3%), reflecting the local real estate landscape.
- Houses represent a significant 58.3% portion, catering likely to families or larger groups.
- Smaller segments like outdoor/unique, hotel/boutique, others (combined 9.2%) offer potential for unique stay experiences.
El Paso Airbnb Room Capacity Analysis (2025): Bedroom Distribution
Distribution of Listings by Number of Bedrooms
Room Capacity Insights for El Paso
- The dominant room capacity in El Paso is 2 bedrooms listings, making up 42.9% of the market. This suggests a strong demand for properties suitable for couples or solo travelers.
- Together, 2 bedrooms and 1 bedroom properties represent 80.3% of the active Airbnb listings in El Paso, indicating a high concentration in these sizes.
El Paso Vacation Rental Guest Capacity Trends (2025)
Distribution of Listings by Guest Capacity
Guest Capacity Insights for El Paso
- The most common guest capacity trend in El Paso vacation rentals is listings accommodating 4 guests (38%). This suggests the primary traveler segment is likely small families or groups.
- Properties designed for 4 guests and 2 guests dominate the El Paso STR market, accounting for 63.8% of listings.
- 11.7% of properties accommodate 6+ guests, serving the market segment for larger families or group travel in El Paso.
- On average, properties in El Paso are equipped to host 3.5 guests.
El Paso Airbnb Booking Patterns (2025): Available vs. Booked Days
Available Days Distribution
Booked Days Distribution
Booking Pattern Insights for El Paso
- The most common availability pattern in El Paso falls within the 271-366 days range, representing 49.1% of listings. This suggests many properties have significant open periods on their calendars.
- Approximately 73.6% of listings show high availability (181+ days open annually), indicating potential for increased bookings or specific owner usage patterns.
- For booked days, the 1-30 days range is most frequent in El Paso (24.5%), reflecting common guest stay durations or potential owner blocking patterns.
- A notable 27.0% of properties secure long booking periods (181+ days booked per year), highlighting successful long-term rental strategies or significant owner usage.
El Paso Airbnb Minimum Stay Requirements Analysis
Distribution of Listings by Minimum Night Requirement
1 Night
12 listings
7.5% of total
2 Nights
20 listings
12.6% of total
3 Nights
38 listings
23.9% of total
4-6 Nights
62 listings
39% of total
7-29 Nights
9 listings
5.7% of total
30+ Nights
18 listings
11.3% of total
Key Insights
- The most prevalent minimum stay requirement in El Paso is 4-6 Nights, adopted by 39% of listings. This highlights the market's preference for longer commitments.
- A significant segment (11.3%) caters to monthly stays (30+ nights) in El Paso, pointing to opportunities in the extended-stay market.
Recommendations
- Align with the market by considering a 4-6 Nights minimum stay, as 39% of El Paso hosts use this setting.
- If feasible, allowing 1-night stays, especially midweek or during low season, could capture last-minute bookings, as only 7.5% currently do.
- Explore offering discounts for stays of 30+ nights to attract the 11.3% of the market seeking extended stays.
- Adjust minimum nights based on seasonality – potentially shorter during low season and longer during peak demand periods in El Paso.
El Paso Airbnb Cancellation Policy Trends Analysis (2025)
Super Strict 60 Days
1 listings
0.7% of total
Flexible
27 listings
19.1% of total
Moderate
39 listings
27.7% of total
Firm
34 listings
24.1% of total
Strict
40 listings
28.4% of total
Cancellation Policy Insights for El Paso
- The prevailing Airbnb cancellation policy trend in El Paso is Strict, used by 28.4% of listings.
- A majority (52.5%) of hosts in El Paso utilize Firm or Strict policies, indicating a market where hosts prioritize booking security.
Recommendations for Hosts
- Consider adopting a Strict policy to align with the 28.4% market standard in El Paso.
- Regularly review your cancellation policy against competitors and market demand shifts in El Paso.
El Paso STR Booking Lead Time Analysis (2025)
Average Booking Lead Time by Month
Booking Lead Time Insights for El Paso
- The overall average booking lead time for vacation rentals in El Paso is 81 days.
- Guests book furthest in advance for stays during May (average 106 days), likely coinciding with peak travel demand or local events.
- The shortest booking windows occur for stays in September (average 63 days), indicating more last-minute travel plans during this time.
- Seasonally, Spring (100 days avg.) sees the longest lead times, while Summer (81 days avg.) has the shortest, reflecting typical travel planning cycles.
Recommendations for Hosts
- Use the overall average lead time (81 days) as a baseline for your pricing and availability strategy in El Paso.
- For May stays, consider implementing length-of-stay discounts or slightly higher rates for bookings made less than 106 days out to capitalize on advance planning.
- Target marketing efforts for the Spring season well in advance (at least 100 days) to capture early planners.
- Monitor your own booking lead times against these El Paso averages to identify opportunities for dynamic pricing adjustments.
Popular & Essential Airbnb Amenities in El Paso (2025)
Amenity Prevalence
Amenity Insights for El Paso
- Essential amenities in El Paso that guests expect include: Wifi, Kitchen. Lacking these (any) could significantly impact bookings.
- Popular amenities like TV, Hot water, Essentials are common but not universal. Offering these can provide a competitive edge.
Recommendations for Hosts
- Ensure your listing includes all essential amenities for El Paso: Wifi, Kitchen.
- Prioritize adding missing essentials: Wifi, Kitchen.
- Consider adding popular differentiators like TV or Hot water to increase appeal.
- Highlight unique or less common amenities you offer (e.g., hot tub, dedicated workspace, EV charger) in your listing description and photos.
- Regularly check competitor amenities in El Paso to stay competitive.
El Paso Airbnb Guest Demographics & Profile Analysis (2025)
Guest Profile Summary for El Paso
- The typical guest profile for Airbnb in El Paso consists of predominantly international visitors (66%), with top international origins including Germany, typically belonging to the Post-2000s (Gen Z/Alpha) group (50%), primarily speaking English or Spanish.
- Domestic travelers account for 33.8% of guests.
- Key international markets include Spain (33.8%) and Germany (24.7%).
- Top languages spoken are English (36%) followed by Spanish (19.5%).
- A significant demographic segment is the Post-2000s (Gen Z/Alpha) group, representing 50% of guests.
Recommendations for Hosts
- Focus marketing internationally, particularly towards travelers from Germany.
- Tailor amenities and listing descriptions to appeal to the dominant Post-2000s (Gen Z/Alpha) demographic (e.g., highlight fast WiFi, smart home features, local guides).
- Highlight unique local experiences or amenities relevant to the primary guest profile.
- Consider seasonal promotions aligned with peak travel times for key origin markets.
Nearby Short-Term Rental Market Comparison
How does the El Paso Airbnb market stack up against its neighbors? Compare key performance metrics like average monthly revenue, ADR, and occupancy rates in surrounding areas to understand the broader regional STR landscape.
| Market | Active Properties | Monthly Revenue | Daily Rate | Avg. Occupancy |
|---|---|---|---|---|
| El Sauzal | 94 | $2,759 | $231.94 | 52% |
| La Victoria de Acentejo | 18 | $2,591 | $227.75 | 54% |
| Santa Úrsula | 134 | $2,276 | $200.12 | 49% |
| Adeje | 3,043 | $2,203 | $189.97 | 51% |
| San Miguel de Abona | 666 | $1,918 | $173.37 | 49% |
| El Rosario | 227 | $1,846 | $140.14 | 56% |
| Los Realejos | 263 | $1,626 | $119.12 | 54% |
| Santiago del Teide | 773 | $1,616 | $140.24 | 50% |
| La Orotava | 267 | $1,614 | $133.19 | 51% |
| La Matanza de Acentejo | 121 | $1,594 | $119.03 | 52% |