Candelaria Airbnb Market Analysis 2025: Short Term Rental Data & Vacation Rental Statistics in Canary Islands, Spain
Is Airbnb profitable in Candelaria in 2025? Explore comprehensive Airbnb analytics for Candelaria, Canary Islands, Spain to uncover income potential. This 2025 STR market report for Candelaria, based on AirROI data from April 2024 to March 2025, reveals key trends in the market of 282 active listings.
Whether you're considering an Airbnb investment in Candelaria, optimizing your existing vacation rental, or exploring rental arbitrage opportunities, understanding the Candelaria Airbnb data is crucial. Navigating the high regulation landscape is key to maximizing your short term rental income potential. Let's dive into the specifics.
Key Candelaria Airbnb Performance Metrics Overview
Monthly Airbnb Revenue Variations & Income Potential in Candelaria (2025)
Understanding the monthly revenue variations for Airbnb listings in Candelaria is key to maximizing your short term rental income potential. Seasonality significantly impacts earnings. Our analysis, based on data from the past 12 months, shows that the peak revenue month for STRs in Candelaria is typically January, while September often presents the lowest earnings, highlighting opportunities for strategic pricing adjustments during shoulder and low seasons. Explore the typical Airbnb income in Candelaria across different performance tiers:
- Best-in-class properties (Top 10%) achieve $3,612+ monthly, often utilizing dynamic pricing and superior guest experiences.
- Strong performing properties (Top 25%) earn $2,421 or more, indicating effective management and desirable locations/amenities.
- Typical properties (Median) generate around $1,601 per month, representing the average market performance.
- Entry-level properties (Bottom 25%) see earnings around $861, often with potential for optimization.
Average Monthly Airbnb Earnings Trend in Candelaria
Candelaria Airbnb Occupancy Rate Trends (2025)
Maximize your bookings by understanding the Candelaria STR occupancy trends. Seasonal demand shifts significantly influence how often properties are booked. Typically, Januarysees the highest demand (peak season occupancy), while June experiences the lowest (low season). Effective strategies, like adjusting minimum stays or offering promotions, can boost occupancy during slower periods. Here's how different property tiers perform in Candelaria:
- Best-in-class properties (Top 10%) achieve 90%+ occupancy, indicating high desirability and potentially optimized availability.
- Strong performing properties (Top 25%) maintain 77% or higher occupancy, suggesting good market fit and guest satisfaction.
- Typical properties (Median) have an occupancy rate around 56%.
- Entry-level properties (Bottom 25%) average 30% occupancy, potentially facing higher vacancy.
Average Monthly Occupancy Rate Trend in Candelaria
Average Daily Rate (ADR) Airbnb Trends in Candelaria (2025)
Effective short term rental pricing strategy in Candelaria involves understanding monthly ADR fluctuations. The Average Daily Rate (ADR) for Airbnb in Candelaria typically peaks in December and dips lowest during May. Leveraging Airbnb dynamic pricing tools or strategies based on this seasonality can significantly boost revenue. Here's a look at the typical nightly rates achieved:
- Best-in-class properties (Top 10%) command rates of $197+ per night, often due to premium features or locations.
- Strong performing properties (Top 25%) achieve nightly rates of $126 or more.
- Typical properties (Median) charge around $89 per night.
- Entry-level properties (Bottom 25%) earn around $64 per night.
Average Daily Rate (ADR) Trend by Month in Candelaria
Get Live Candelaria Market Intelligence 👇

Explore Real-time Analytics
Airbnb Seasonality Analysis & Trends in Candelaria (2025)
Peak Season (January, December, February)
- Revenue averages $2,359 per month
- Occupancy rates average 66.0%
- Daily rates average $139
Shoulder Season
- Revenue averages $1,853 per month
- Occupancy maintains around 51.5%
- Daily rates hold near $120
Low Season (June, September, October)
- Revenue drops to average $1,486 per month
- Occupancy decreases to average 45.0%
- Daily rates adjust to average $113
Seasonality Insights for Candelaria
- The Airbnb seasonality in Candelaria shows moderate seasonality with distinct peak and low periods. While the sections above show seasonal averages, it's also insightful to look at the extremes:
- During the high season, the absolute peak month showcases Candelaria's highest earning potential, with monthly revenues capable of climbing to $2,436, occupancy reaching a high of 69.0%, and ADRs peaking at $142.
- Conversely, the slowest single month of the year, typically falling within the low season, marks the market's lowest point. In this month, revenue might dip to $1,313, occupancy could drop to 37.9%, and ADRs may adjust down to $112.
- Understanding both the seasonal averages and these monthly peaks and troughs in revenue, occupancy, and ADR is crucial for maximizing your Airbnb profit potential in Candelaria.
Seasonal Strategies for Maximizing Profit
- Peak Season: Maximize revenue through premium pricing and potentially longer minimum stays. Ensure high availability.
- Low Season: Offer competitive pricing, special promotions (e.g., extended stay discounts), and flexible cancellation policies. Target off-season travelers like remote workers or budget-conscious guests.
- Shoulder Seasons: Implement dynamic pricing that balances peak and low rates. Target weekend travelers or specific events. Offer slightly more flexible terms than peak season.
- Regularly analyze your own performance against these Candelaria seasonality benchmarks and adjust your pricing and availability strategy accordingly.
Best Areas for Airbnb Investment in Candelaria (2025)
Exploring the top neighborhoods for short-term rentals in Candelaria? This section highlights key areas, outlining why they are attractive for hosts and guests, along with notable local attractions. Consider these locations based on your target guest profile and investment strategy.
| Neighborhood / Area | Why Host Here? (Target Guests & Appeal) | Key Attractions & Landmarks |
|---|---|---|
| Candelaria Beach | A popular beach destination known for its stunning views and easy access to local eateries. Ideal for tourists looking to relax by the sea and enjoy water sports. | Candelaria Beach, Playa de la Arena, Candelaria Sanctuary, Punta del Hidalgo, El Teide National Park |
| Candelaria Town Center | The heart of Candelaria, rich in history and culture. This area attracts visitors interested in local traditions and festivals, making it a great spot for cultural tourism. | Basilica de Nuestra Señora de Candelaria, Candelaria Market, Plaza de la Patrona de Canarias, El Buzanada Church, Cultural Festivals |
| Playa de las Caletillas | A tranquil beach area known for its family-friendly atmosphere and calm waters, perfect for families and individuals looking for a peaceful vacation. | Caletillas Beach, Swimming Pools, Local Restaurants, Coastal Walks, Sunset Views |
| Barrio de la Luz | An upcoming neighborhood known for its vibrant community and artistic vibe. A great choice for travelers looking for a unique experience and local interactions. | Street Art, Cultural Events, Local Cafes, Art Studios, Community Markets |
| Tejina | A nearby quaint village offering a more authentic Canarian experience. Attracts visitors who want to escape the more touristy areas and enjoy nature. | Tejina Church, Vineyards, Scenic Hiking Trails, Local Wine Tastings, Traditional Festivals |
| Los Christianos | Although slightly outside Candelaria, this area is a bustling tourist hub with a plethora of attractions and conveniences. It's a good option for investment due to its popularity. | Los Cristianos Beach, Marine Walkway, Shopping Centers, Bars and Nightlife, Family-Friendly Attractions |
| San Andrés | Another charming coastal village known for its iconic beach and local cuisine. Great for visitors looking to savor local flavors and enjoy beach activities. | Playa de las Teresitas, Local Seafood Restaurants, Scenic Views, Historical Sites, Water Sports |
| Mirador de La Peña | Offers breathtaking views and is a hotspot for nature lovers and photographers. This unique location is perfect for those seeking adventure and exploration. | Mirador Views, Hiking Trails, Nature Reserves, Photography Spots, Cultural Interpretive Centers |
Understanding Airbnb License Requirements & STR Laws in Candelaria (2025)
Yes, Candelaria, Canary Islands, Spain enforces high STR regulations. Obtaining a license and ensuring compliance is almost certainly required according to current 2025 STR laws. Always verify the latest short term rental regulations and Airbnb license requirements directly with local government authorities for Candelaria to ensure full compliance before hosting.
(Source: AirROI data, 2025, based on 38% licensed listings)
Top Performing Airbnb Properties in Candelaria (2025)
Benchmark your potential! Explore examples of top-performing Airbnb properties in Candelariabased on Trailing Twelve Month (TTM) revenue. Analyze their characteristics, revenue, occupancy rate, and ADR to understand what drives success in this market.

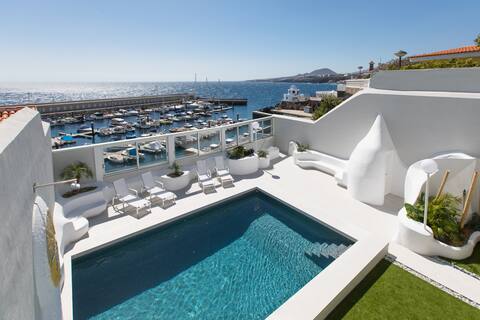
GREAT CHALETS IN CANDELARIA WITH POOL.
Entire Place • 5 bedrooms
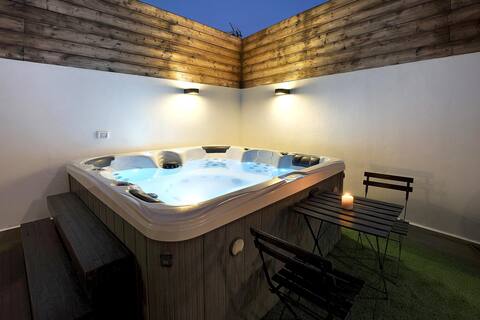
Newport Bay Villa: exclusive & luxury experience
Entire Place • 4 bedrooms

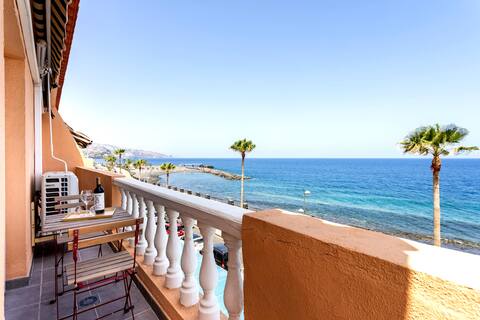
Home2Book Stunning Sea Views House, Private Pool
Entire Place • 5 bedrooms
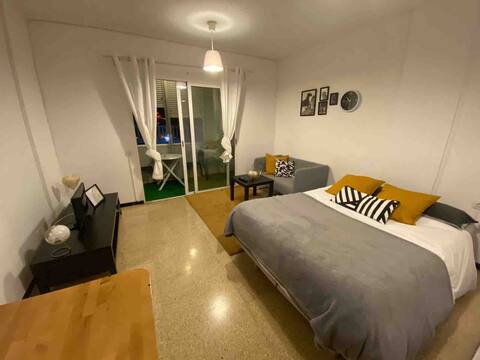
Casa Miranda
Entire Place • 2 bedrooms
Home2Book Stunning Sea Front Caletillas, Pool
Entire Place • 3 bedrooms
Not available at the moment
Entire Place • N/A
Note: Performance varies based on location, size, amenities, seasonality, and management quality. Data reflects the past 12 months.
Top Performing Airbnb Hosts in Candelaria (2025)
Learn from the best! This table showcases top-performing Airbnb hosts in Candelaria based on the number of properties managed and estimated total revenue over the past year. Analyze their scale and performance metrics.
| Host Name | Properties | Grossing Revenue | Stay Reviews | Avg Rating |
|---|---|---|---|---|
| Home2Book | 18 | $535,973 | 219 | 3.93/5.0 |
| Live My Place Properties | 8 | $119,122 | 191 | 4.16/5.0 |
| Maria Gabriele | 9 | $110,223 | 287 | 4.74/5.0 |
| Holidu | 3 | $95,884 | 86 | 3.20/5.0 |
| Top Kanaren | 4 | $95,282 | 83 | 4.70/5.0 |
| Apartamentos | 6 | $86,072 | 376 | 4.70/5.0 |
| Kervin | 1 | $84,019 | 60 | 4.83/5.0 |
| Fran | 4 | $79,179 | 74 | 4.97/5.0 |
| Luxury | 1 | $79,173 | 22 | 4.73/5.0 |
| Angeles | 2 | $70,986 | 172 | 4.99/5.0 |
Analyzing the strategies of top hosts, such as their property selection, pricing, and guest communication, can offer valuable lessons for optimizing your own Airbnb operations in Candelaria.
Dive Deeper: Advanced Candelaria STR Market Data (2025)
Ready to unlock more insights? AirROI provides access to advanced metrics and comprehensive Airbnb data for Candelaria. Explore detailed analytics beyond this report to refine your investment strategy, optimize pricing, and maximize your vacation rental profits.
Explore Advanced MetricsCandelaria Short-Term Rental Market Composition (2025): Property & Room Types
Room Type Distribution
Property Type Distribution
Market Composition Insights for Candelaria
- The Candelaria Airbnb market composition is heavily skewed towards Entire Home/Apt listings, which make up 94.3% of the 282 active rentals. This indicates strong guest preference for privacy and space.
- Looking at the property type distribution in Candelaria, Apartment/Condo properties are the most common (69.9%), reflecting the local real estate landscape.
- Houses represent a significant 27.7% portion, catering likely to families or larger groups.
- Smaller segments like hotel/boutique, others (combined 2.5%) offer potential for unique stay experiences.
Candelaria Airbnb Room Capacity Analysis (2025): Bedroom Distribution
Distribution of Listings by Number of Bedrooms
Room Capacity Insights for Candelaria
- The dominant room capacity in Candelaria is 2 bedrooms listings, making up 39.7% of the market. This suggests a strong demand for properties suitable for couples or solo travelers.
- Together, 2 bedrooms and 1 bedroom properties represent 76.2% of the active Airbnb listings in Candelaria, indicating a high concentration in these sizes.
Candelaria Vacation Rental Guest Capacity Trends (2025)
Distribution of Listings by Guest Capacity
Guest Capacity Insights for Candelaria
- The most common guest capacity trend in Candelaria vacation rentals is listings accommodating 4 guests (37.6%). This suggests the primary traveler segment is likely small families or groups.
- Properties designed for 4 guests and 2 guests dominate the Candelaria STR market, accounting for 58.2% of listings.
- 18.1% of properties accommodate 6+ guests, serving the market segment for larger families or group travel in Candelaria.
- On average, properties in Candelaria are equipped to host 3.8 guests.
Candelaria Airbnb Booking Patterns (2025): Available vs. Booked Days
Available Days Distribution
Booked Days Distribution
Booking Pattern Insights for Candelaria
- The most common availability pattern in Candelaria falls within the 271-366 days range, representing 34.4% of listings. This suggests many properties have significant open periods on their calendars.
- Approximately 63.1% of listings show high availability (181+ days open annually), indicating potential for increased bookings or specific owner usage patterns.
- For booked days, the 91-180 days range is most frequent in Candelaria (28%), reflecting common guest stay durations or potential owner blocking patterns.
- A notable 38.3% of properties secure long booking periods (181+ days booked per year), highlighting successful long-term rental strategies or significant owner usage.
Candelaria Airbnb Minimum Stay Requirements Analysis
Distribution of Listings by Minimum Night Requirement
1 Night
23 listings
8.7% of total
2 Nights
26 listings
9.8% of total
3 Nights
47 listings
17.8% of total
4-6 Nights
81 listings
30.7% of total
7-29 Nights
23 listings
8.7% of total
30+ Nights
64 listings
24.2% of total
Key Insights
- The most prevalent minimum stay requirement in Candelaria is 4-6 Nights, adopted by 30.7% of listings. This highlights the market's preference for longer commitments.
- Very short stays (1-2 nights) are less common (18.5%), suggesting hosts prefer slightly longer bookings to optimize turnover.
- A significant segment (24.2%) caters to monthly stays (30+ nights) in Candelaria, pointing to opportunities in the extended-stay market.
Recommendations
- Align with the market by considering a 4-6 Nights minimum stay, as 30.7% of Candelaria hosts use this setting.
- If feasible, allowing 1-night stays, especially midweek or during low season, could capture last-minute bookings, as only 8.7% currently do.
- Explore offering discounts for stays of 30+ nights to attract the 24.2% of the market seeking extended stays.
- Adjust minimum nights based on seasonality – potentially shorter during low season and longer during peak demand periods in Candelaria.
Candelaria Airbnb Cancellation Policy Trends Analysis (2025)
Super Strict 30 Days
5 listings
2.1% of total
Flexible
42 listings
17.7% of total
Moderate
114 listings
48.1% of total
Firm
47 listings
19.8% of total
Strict
29 listings
12.2% of total
Cancellation Policy Insights for Candelaria
- The prevailing Airbnb cancellation policy trend in Candelaria is Moderate, used by 48.1% of listings.
- There's a relatively balanced mix between guest-friendly (65.8%) and stricter (32.0%) policies, offering choices for different guest needs.
Recommendations for Hosts
- Consider adopting a Moderate policy to align with the 48.1% market standard in Candelaria.
- Using a Strict policy might deter some guests, as only 12.2% of listings use it. Evaluate if potential revenue protection outweighs possible lower booking rates.
- Regularly review your cancellation policy against competitors and market demand shifts in Candelaria.
Candelaria STR Booking Lead Time Analysis (2025)
Average Booking Lead Time by Month
Booking Lead Time Insights for Candelaria
- The overall average booking lead time for vacation rentals in Candelaria is 63 days.
- Guests book furthest in advance for stays during July (average 91 days), likely coinciding with peak travel demand or local events.
- The shortest booking windows occur for stays in September (average 56 days), indicating more last-minute travel plans during this time.
- Seasonally, Summer (80 days avg.) sees the longest lead times, while Fall (61 days avg.) has the shortest, reflecting typical travel planning cycles.
Recommendations for Hosts
- Use the overall average lead time (63 days) as a baseline for your pricing and availability strategy in Candelaria.
- For July stays, consider implementing length-of-stay discounts or slightly higher rates for bookings made less than 91 days out to capitalize on advance planning.
- Target marketing efforts for the Summer season well in advance (at least 80 days) to capture early planners.
- Monitor your own booking lead times against these Candelaria averages to identify opportunities for dynamic pricing adjustments.
Popular & Essential Airbnb Amenities in Candelaria (2025)
Amenity Prevalence
Amenity Insights for Candelaria
- Essential amenities in Candelaria that guests expect include: Wifi, Kitchen, TV, Washer. Lacking these (any) could significantly impact bookings.
- Popular amenities like Hot water, Essentials, Dishes and silverware are common but not universal. Offering these can provide a competitive edge.
Recommendations for Hosts
- Ensure your listing includes all essential amenities for Candelaria: Wifi, Kitchen, TV, Washer.
- Prioritize adding missing essentials: Wifi, Kitchen, TV, Washer.
- Consider adding popular differentiators like Hot water or Essentials to increase appeal.
- Highlight unique or less common amenities you offer (e.g., hot tub, dedicated workspace, EV charger) in your listing description and photos.
- Regularly check competitor amenities in Candelaria to stay competitive.
Candelaria Airbnb Guest Demographics & Profile Analysis (2025)
Guest Profile Summary for Candelaria
- The typical guest profile for Airbnb in Candelaria consists of predominantly international visitors (71%), with top international origins including Germany, typically belonging to the Post-2000s (Gen Z/Alpha) group (50%), primarily speaking English or Spanish.
- Domestic travelers account for 29.5% of guests.
- Key international markets include Spain (29.5%) and Germany (17%).
- Top languages spoken are English (36.6%) followed by Spanish (17.8%).
- A significant demographic segment is the Post-2000s (Gen Z/Alpha) group, representing 50% of guests.
Recommendations for Hosts
- Focus marketing internationally, particularly towards travelers from Germany.
- Tailor amenities and listing descriptions to appeal to the dominant Post-2000s (Gen Z/Alpha) demographic (e.g., highlight fast WiFi, smart home features, local guides).
- Highlight unique local experiences or amenities relevant to the primary guest profile.
- Consider seasonal promotions aligned with peak travel times for key origin markets.
Nearby Short-Term Rental Market Comparison
How does the Candelaria Airbnb market stack up against its neighbors? Compare key performance metrics like average monthly revenue, ADR, and occupancy rates in surrounding areas to understand the broader regional STR landscape.
| Market | Active Properties | Monthly Revenue | Daily Rate | Avg. Occupancy |
|---|---|---|---|---|
| El Sauzal | 94 | $2,759 | $231.94 | 52% |
| La Victoria de Acentejo | 18 | $2,591 | $227.75 | 54% |
| Santa Úrsula | 134 | $2,276 | $200.12 | 49% |
| Adeje | 3,043 | $2,203 | $189.97 | 51% |
| San Miguel de Abona | 666 | $1,918 | $173.37 | 49% |
| El Rosario | 227 | $1,846 | $140.14 | 56% |
| San Bartolomé de Tirajana | 2,717 | $1,640 | $155.10 | 48% |
| Los Realejos | 263 | $1,626 | $119.12 | 54% |
| Santiago del Teide | 773 | $1,616 | $140.24 | 50% |
| La Orotava | 267 | $1,614 | $133.19 | 51% |