Buenavista del Norte Airbnb Market Analysis 2025: Short Term Rental Data & Vacation Rental Statistics in Canary Islands, Spain
Is Airbnb profitable in Buenavista del Norte in 2025? Explore comprehensive Airbnb analytics for Buenavista del Norte, Canary Islands, Spain to uncover income potential. This 2025 STR market report for Buenavista del Norte, based on AirROI data from April 2024 to March 2025, reveals key trends in the niche market of 60 active listings.
Whether you're considering an Airbnb investment in Buenavista del Norte, optimizing your existing vacation rental, or exploring rental arbitrage opportunities, understanding the Buenavista del Norte Airbnb data is crucial. Understanding the local regulations is key to maximizing your short term rental income potential. Let's dive into the specifics.
Key Buenavista del Norte Airbnb Performance Metrics Overview
Monthly Airbnb Revenue Variations & Income Potential in Buenavista del Norte (2025)
Understanding the monthly revenue variations for Airbnb listings in Buenavista del Norte is key to maximizing your short term rental income potential. Seasonality significantly impacts earnings. Our analysis, based on data from the past 12 months, shows that the peak revenue month for STRs in Buenavista del Norte is typically January, while September often presents the lowest earnings, highlighting opportunities for strategic pricing adjustments during shoulder and low seasons. Explore the typical Airbnb income in Buenavista del Norte across different performance tiers:
- Best-in-class properties (Top 10%) achieve $3,199+ monthly, often utilizing dynamic pricing and superior guest experiences.
- Strong performing properties (Top 25%) earn $1,992 or more, indicating effective management and desirable locations/amenities.
- Typical properties (Median) generate around $1,258 per month, representing the average market performance.
- Entry-level properties (Bottom 25%) see earnings around $686, often with potential for optimization.
Average Monthly Airbnb Earnings Trend in Buenavista del Norte
Buenavista del Norte Airbnb Occupancy Rate Trends (2025)
Maximize your bookings by understanding the Buenavista del Norte STR occupancy trends. Seasonal demand shifts significantly influence how often properties are booked. Typically, Januarysees the highest demand (peak season occupancy), while June experiences the lowest (low season). Effective strategies, like adjusting minimum stays or offering promotions, can boost occupancy during slower periods. Here's how different property tiers perform in Buenavista del Norte:
- Best-in-class properties (Top 10%) achieve 86%+ occupancy, indicating high desirability and potentially optimized availability.
- Strong performing properties (Top 25%) maintain 70% or higher occupancy, suggesting good market fit and guest satisfaction.
- Typical properties (Median) have an occupancy rate around 47%.
- Entry-level properties (Bottom 25%) average 24% occupancy, potentially facing higher vacancy.
Average Monthly Occupancy Rate Trend in Buenavista del Norte
Average Daily Rate (ADR) Airbnb Trends in Buenavista del Norte (2025)
Effective short term rental pricing strategy in Buenavista del Norte involves understanding monthly ADR fluctuations. The Average Daily Rate (ADR) for Airbnb in Buenavista del Norte typically peaks in November and dips lowest during March. Leveraging Airbnb dynamic pricing tools or strategies based on this seasonality can significantly boost revenue. Here's a look at the typical nightly rates achieved:
- Best-in-class properties (Top 10%) command rates of $228+ per night, often due to premium features or locations.
- Strong performing properties (Top 25%) achieve nightly rates of $135 or more.
- Typical properties (Median) charge around $90 per night.
- Entry-level properties (Bottom 25%) earn around $69 per night.
Average Daily Rate (ADR) Trend by Month in Buenavista del Norte
Get Live Buenavista del Norte Market Intelligence 👇

Explore Real-time Analytics
Airbnb Seasonality Analysis & Trends in Buenavista del Norte (2025)
Peak Season (January, December, April)
- Revenue averages $2,088 per month
- Occupancy rates average 57.3%
- Daily rates average $132
Shoulder Season
- Revenue averages $1,617 per month
- Occupancy maintains around 48.2%
- Daily rates hold near $132
Low Season (June, August, September)
- Revenue drops to average $1,186 per month
- Occupancy decreases to average 36.4%
- Daily rates adjust to average $132
Seasonality Insights for Buenavista del Norte
- The Airbnb seasonality in Buenavista del Norte shows highly seasonal trends requiring careful strategy. While the sections above show seasonal averages, it's also insightful to look at the extremes:
- During the high season, the absolute peak month showcases Buenavista del Norte's highest earning potential, with monthly revenues capable of climbing to $2,258, occupancy reaching a high of 65.7%, and ADRs peaking at $135.
- Conversely, the slowest single month of the year, typically falling within the low season, marks the market's lowest point. In this month, revenue might dip to $1,101, occupancy could drop to 33.0%, and ADRs may adjust down to $127.
- Understanding both the seasonal averages and these monthly peaks and troughs in revenue, occupancy, and ADR is crucial for maximizing your Airbnb profit potential in Buenavista del Norte.
Seasonal Strategies for Maximizing Profit
- Peak Season: Maximize revenue through premium pricing and potentially longer minimum stays. Ensure high availability.
- Low Season: Offer competitive pricing, special promotions (e.g., extended stay discounts), and flexible cancellation policies. Target off-season travelers like remote workers or budget-conscious guests.
- Shoulder Seasons: Implement dynamic pricing that balances peak and low rates. Target weekend travelers or specific events. Offer slightly more flexible terms than peak season.
- Regularly analyze your own performance against these Buenavista del Norte seasonality benchmarks and adjust your pricing and availability strategy accordingly.
Best Areas for Airbnb Investment in Buenavista del Norte (2025)
Exploring the top neighborhoods for short-term rentals in Buenavista del Norte? This section highlights key areas, outlining why they are attractive for hosts and guests, along with notable local attractions. Consider these locations based on your target guest profile and investment strategy.
| Neighborhood / Area | Why Host Here? (Target Guests & Appeal) | Key Attractions & Landmarks |
|---|---|---|
| Los Gigantes | Popular for its stunning cliffs and magnificent ocean views, attracting tourists for boat trips and whale watching. | Los Gigantes Cliffs, Whale Watching Tours, Beach of Los Gigantes, Local Restaurants, Trekking Routes |
| Playa de las Américas | A lively tourist area known for its vibrant nightlife, gorgeous beaches, and numerous restaurants and shops. | Las Vistas Beach, Siam Park, Aqualand Costa Adeje, Wide range of bars and clubs, Magma Art and Congress Centre |
| Costa Adeje | High-end area with luxury resorts, perfect for families and upscale travelers looking for relaxation and leisure activities. | El Duque Beach, La Pinta Beach, Water Sports Activities, Shopping Malls, Golf Courses |
| Puerto de la Cruz | Known for its beautiful gardens and botanical parks which attract nature lovers and families. | Loro Parque, Botanical Gardens, Lake Martiánez, Historical Center, Local Gastronomy |
| La Orotava | Charming town known for its traditional Canarian architecture and unique local culture, ideal for visitors seeking an authentic experience. | Casa de los Balcones, Botanical Garden, Iglesia de la Concepción, Cultural Events, Local Markets |
| San Cristóbal de La Laguna | A UNESCO World Heritage site with a rich history and vibrant student life, attracting culture and history enthusiasts. | Cathedral of La Laguna, Historic Town Center, Museums, Universities, Street Markets |
| El Médano | Famous for its beautiful windsurfing and kitesurfing spots, attracting adventure seekers and beach lovers. | El Médano Beach, Windsurfing and Kitesurfing, Natural Dunes, Local Seafood Restaurants |
| Garachico | A picturesque coastal town known for its natural swimming pools and volcanic history, perfect for visitors looking for stunning visuals and tranquility. | Natural Swimming Pools, Historical Town Center, Church of Santa Ana, Paseo de San Telmo, Local Artisan Shops |
Understanding Airbnb License Requirements & STR Laws in Buenavista del Norte (2025)
With 20% of listings showing registration in 2025, understanding potential Airbnb license requirements is crucial in Buenavista del Norte. Always verify the latest short term rental regulations and Airbnb license requirements directly with local government authorities for Buenavista del Norte to ensure full compliance before hosting.
(Source: AirROI data, 2025, based on 20% licensed listings)
Top Performing Airbnb Properties in Buenavista del Norte (2025)
Benchmark your potential! Explore examples of top-performing Airbnb properties in Buenavista del Nortebased on Trailing Twelve Month (TTM) revenue. Analyze their characteristics, revenue, occupancy rate, and ADR to understand what drives success in this market.
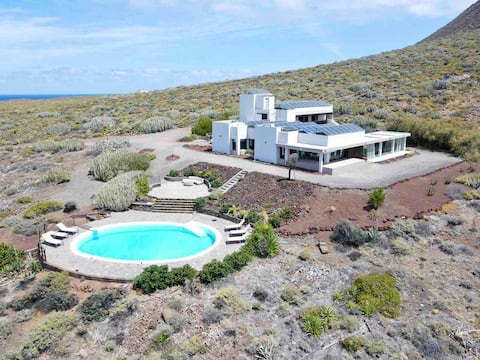
Stunning Villa with pool and amazing sea views
Entire Place • 7 bedrooms
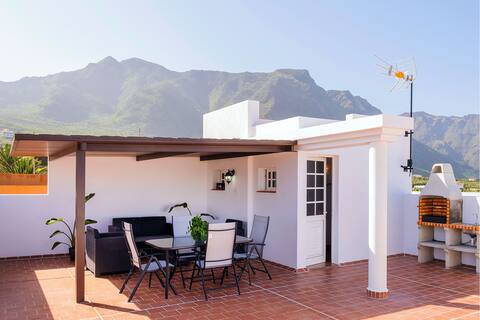
Live Buenavista Terrace with views and BBQ
Entire Place • 3 bedrooms
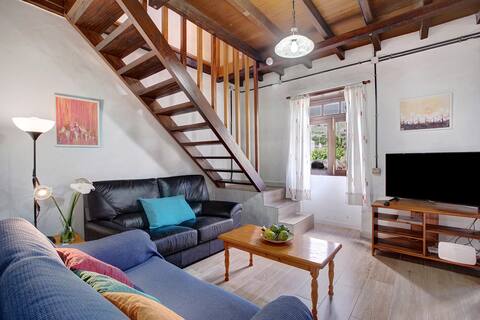
La Zahorra house
Entire Place • 3 bedrooms
Casa Guergue by V.V Canary Ocean Homes
Entire Place • 2 bedrooms
Live Buenavista del Norte with terrace
Entire Place • 4 bedrooms
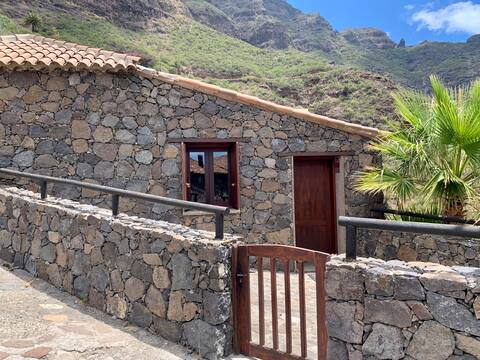
Sweet Home Masca
Private Room • 1 bedroom
Note: Performance varies based on location, size, amenities, seasonality, and management quality. Data reflects the past 12 months.
Top Performing Airbnb Hosts in Buenavista del Norte (2025)
Learn from the best! This table showcases top-performing Airbnb hosts in Buenavista del Norte based on the number of properties managed and estimated total revenue over the past year. Analyze their scale and performance metrics.
| Host Name | Properties | Grossing Revenue | Stay Reviews | Avg Rating |
|---|---|---|---|---|
| Live My Place Properties | 4 | $132,983 | 118 | 4.75/5.0 |
| Adalberto | 1 | $87,447 | 22 | 4.82/5.0 |
| Canary Homes Collection | 8 | $76,010 | 105 | 4.88/5.0 |
| Home2Book | 2 | $47,239 | 125 | 4.63/5.0 |
| Holidu | 1 | $42,328 | 7 | 5.00/5.0 |
| V.V Canary Ocean Homes | 1 | $42,180 | 77 | 4.92/5.0 |
| Joel | 2 | $41,549 | 699 | 4.84/5.0 |
| Adelaida Del Carmen | 2 | $37,074 | 30 | 4.95/5.0 |
| Mario | 1 | $32,651 | 150 | 4.97/5.0 |
| Viña Camello | 1 | $26,273 | 27 | 4.93/5.0 |
Analyzing the strategies of top hosts, such as their property selection, pricing, and guest communication, can offer valuable lessons for optimizing your own Airbnb operations in Buenavista del Norte.
Dive Deeper: Advanced Buenavista del Norte STR Market Data (2025)
Ready to unlock more insights? AirROI provides access to advanced metrics and comprehensive Airbnb data for Buenavista del Norte. Explore detailed analytics beyond this report to refine your investment strategy, optimize pricing, and maximize your vacation rental profits.
Explore Advanced MetricsBuenavista del Norte Short-Term Rental Market Composition (2025): Property & Room Types
Room Type Distribution
Property Type Distribution
Market Composition Insights for Buenavista del Norte
- The Buenavista del Norte Airbnb market composition is heavily skewed towards Entire Home/Apt listings, which make up 85% of the 60 active rentals. This indicates strong guest preference for privacy and space.
- Looking at the property type distribution in Buenavista del Norte, House properties are the most common (60%), reflecting the local real estate landscape.
- Houses represent a significant 60% portion, catering likely to families or larger groups.
- The presence of 11.7% Hotel/Boutique listings indicates integration with traditional hospitality.
- Smaller segments like others (combined 3.3%) offer potential for unique stay experiences.
Buenavista del Norte Airbnb Room Capacity Analysis (2025): Bedroom Distribution
Distribution of Listings by Number of Bedrooms
Room Capacity Insights for Buenavista del Norte
- The dominant room capacity in Buenavista del Norte is 2 bedrooms listings, making up 46.7% of the market. This suggests a strong demand for properties suitable for couples or solo travelers.
- Together, 2 bedrooms and 1 bedroom properties represent 81.7% of the active Airbnb listings in Buenavista del Norte, indicating a high concentration in these sizes.
Buenavista del Norte Vacation Rental Guest Capacity Trends (2025)
Distribution of Listings by Guest Capacity
Guest Capacity Insights for Buenavista del Norte
- The most common guest capacity trend in Buenavista del Norte vacation rentals is listings accommodating 4 guests (36.7%). This suggests the primary traveler segment is likely small families or groups.
- Properties designed for 4 guests and 2 guests dominate the Buenavista del Norte STR market, accounting for 60.0% of listings.
- On average, properties in Buenavista del Norte are equipped to host 3.5 guests.
Buenavista del Norte Airbnb Booking Patterns (2025): Available vs. Booked Days
Available Days Distribution
Booked Days Distribution
Booking Pattern Insights for Buenavista del Norte
- The most common availability pattern in Buenavista del Norte falls within the 271-366 days range, representing 40% of listings. This suggests many properties have significant open periods on their calendars.
- Approximately 68.3% of listings show high availability (181+ days open annually), indicating potential for increased bookings or specific owner usage patterns.
- For booked days, the 91-180 days range is most frequent in Buenavista del Norte (26.7%), reflecting common guest stay durations or potential owner blocking patterns.
- A notable 33.4% of properties secure long booking periods (181+ days booked per year), highlighting successful long-term rental strategies or significant owner usage.
Buenavista del Norte Airbnb Minimum Stay Requirements Analysis
Distribution of Listings by Minimum Night Requirement
1 Night
8 listings
13.8% of total
2 Nights
10 listings
17.2% of total
3 Nights
9 listings
15.5% of total
4-6 Nights
11 listings
19% of total
7-29 Nights
1 listings
1.7% of total
30+ Nights
19 listings
32.8% of total
Key Insights
- The most prevalent minimum stay requirement in Buenavista del Norte is 30+ Nights, adopted by 32.8% of listings. This highlights the market's preference for longer commitments.
- A significant segment (32.8%) caters to monthly stays (30+ nights) in Buenavista del Norte, pointing to opportunities in the extended-stay market.
Recommendations
- Align with the market by considering a 30+ Nights minimum stay, as 32.8% of Buenavista del Norte hosts use this setting.
- If feasible, allowing 1-night stays, especially midweek or during low season, could capture last-minute bookings, as only 13.8% currently do.
- Explore offering discounts for stays of 30+ nights to attract the 32.8% of the market seeking extended stays.
- Adjust minimum nights based on seasonality – potentially shorter during low season and longer during peak demand periods in Buenavista del Norte.
Buenavista del Norte Airbnb Cancellation Policy Trends Analysis (2025)
Super Strict 30 Days
1 listings
1.9% of total
Super Strict 60 Days
1 listings
1.9% of total
Flexible
14 listings
26.9% of total
Moderate
20 listings
38.5% of total
Firm
9 listings
17.3% of total
Strict
7 listings
13.5% of total
Cancellation Policy Insights for Buenavista del Norte
- The prevailing Airbnb cancellation policy trend in Buenavista del Norte is Moderate, used by 38.5% of listings.
- There's a relatively balanced mix between guest-friendly (65.4%) and stricter (30.8%) policies, offering choices for different guest needs.
Recommendations for Hosts
- Consider adopting a Moderate policy to align with the 38.5% market standard in Buenavista del Norte.
- Using a Strict policy might deter some guests, as only 13.5% of listings use it. Evaluate if potential revenue protection outweighs possible lower booking rates.
- Regularly review your cancellation policy against competitors and market demand shifts in Buenavista del Norte.
Buenavista del Norte STR Booking Lead Time Analysis (2025)
Average Booking Lead Time by Month
Booking Lead Time Insights for Buenavista del Norte
- The overall average booking lead time for vacation rentals in Buenavista del Norte is 57 days.
- Guests book furthest in advance for stays during September (average 78 days), likely coinciding with peak travel demand or local events.
- The shortest booking windows occur for stays in March (average 49 days), indicating more last-minute travel plans during this time.
- Seasonally, Summer (70 days avg.) sees the longest lead times, while Winter (54 days avg.) has the shortest, reflecting typical travel planning cycles.
Recommendations for Hosts
- Use the overall average lead time (57 days) as a baseline for your pricing and availability strategy in Buenavista del Norte.
- For September stays, consider implementing length-of-stay discounts or slightly higher rates for bookings made less than 78 days out to capitalize on advance planning.
- Target marketing efforts for the Summer season well in advance (at least 70 days) to capture early planners.
- Monitor your own booking lead times against these Buenavista del Norte averages to identify opportunities for dynamic pricing adjustments.
Popular & Essential Airbnb Amenities in Buenavista del Norte (2025)
Amenity Prevalence
Amenity Insights for Buenavista del Norte
- Essential amenities in Buenavista del Norte that guests expect include: Wifi. Lacking these (this) could significantly impact bookings.
- Popular amenities like Essentials, Kitchen, Coffee maker are common but not universal. Offering these can provide a competitive edge.
Recommendations for Hosts
- Ensure your listing includes all essential amenities for Buenavista del Norte: Wifi.
- Prioritize adding missing essentials: Wifi.
- Consider adding popular differentiators like Essentials or Kitchen to increase appeal.
- Highlight unique or less common amenities you offer (e.g., hot tub, dedicated workspace, EV charger) in your listing description and photos.
- Regularly check competitor amenities in Buenavista del Norte to stay competitive.
Buenavista del Norte Airbnb Guest Demographics & Profile Analysis (2025)
Guest Profile Summary for Buenavista del Norte
- The typical guest profile for Airbnb in Buenavista del Norte consists of predominantly international visitors (92%), with top international origins including United Kingdom, typically belonging to the Post-2000s (Gen Z/Alpha) group (50%), primarily speaking English or German.
- Domestic travelers account for 8.0% of guests.
- Key international markets include Germany (19.3%) and United Kingdom (17.6%).
- Top languages spoken are English (39.1%) followed by German (14.8%).
- A significant demographic segment is the Post-2000s (Gen Z/Alpha) group, representing 50% of guests.
Recommendations for Hosts
- Focus marketing internationally, particularly towards travelers from United Kingdom.
- Tailor amenities and listing descriptions to appeal to the dominant Post-2000s (Gen Z/Alpha) demographic (e.g., highlight fast WiFi, smart home features, local guides).
- Highlight unique local experiences or amenities relevant to the primary guest profile.
- Consider seasonal promotions aligned with peak travel times for key origin markets.
Nearby Short-Term Rental Market Comparison
How does the Buenavista del Norte Airbnb market stack up against its neighbors? Compare key performance metrics like average monthly revenue, ADR, and occupancy rates in surrounding areas to understand the broader regional STR landscape.
| Market | Active Properties | Monthly Revenue | Daily Rate | Avg. Occupancy |
|---|---|---|---|---|
| El Sauzal | 94 | $2,759 | $231.94 | 52% |
| La Victoria de Acentejo | 18 | $2,591 | $227.75 | 54% |
| Santa Úrsula | 134 | $2,276 | $200.12 | 49% |
| Adeje | 3,043 | $2,203 | $189.97 | 51% |
| San Miguel de Abona | 666 | $1,918 | $173.37 | 49% |
| El Rosario | 227 | $1,846 | $140.14 | 56% |
| San Bartolomé de Tirajana | 2,717 | $1,640 | $155.10 | 48% |
| Los Realejos | 263 | $1,626 | $119.12 | 54% |
| Santiago del Teide | 773 | $1,616 | $140.24 | 50% |
| La Orotava | 267 | $1,614 | $133.19 | 51% |