Betancuria Airbnb Market Analysis 2025: Short Term Rental Data & Vacation Rental Statistics in Canary Islands, Spain
Is Airbnb profitable in Betancuria in 2025? Explore comprehensive Airbnb analytics for Betancuria, Canary Islands, Spain to uncover income potential. This 2025 STR market report for Betancuria, based on AirROI data from April 2024 to March 2025, reveals key trends in the niche market of 25 active listings.
Whether you're considering an Airbnb investment in Betancuria, optimizing your existing vacation rental, or exploring rental arbitrage opportunities, understanding the Betancuria Airbnb data is crucial. Understanding the local regulations is key to maximizing your short term rental income potential. Let's dive into the specifics.
Key Betancuria Airbnb Performance Metrics Overview
Monthly Airbnb Revenue Variations & Income Potential in Betancuria (2025)
Understanding the monthly revenue variations for Airbnb listings in Betancuria is key to maximizing your short term rental income potential. Seasonality significantly impacts earnings. Our analysis, based on data from the past 12 months, shows that the peak revenue month for STRs in Betancuria is typically November, while June often presents the lowest earnings, highlighting opportunities for strategic pricing adjustments during shoulder and low seasons. Explore the typical Airbnb income in Betancuria across different performance tiers:
- Best-in-class properties (Top 10%) achieve $3,176+ monthly, often utilizing dynamic pricing and superior guest experiences.
- Strong performing properties (Top 25%) earn $1,679 or more, indicating effective management and desirable locations/amenities.
- Typical properties (Median) generate around $890 per month, representing the average market performance.
- Entry-level properties (Bottom 25%) see earnings around $515, often with potential for optimization.
Average Monthly Airbnb Earnings Trend in Betancuria
Betancuria Airbnb Occupancy Rate Trends (2025)
Maximize your bookings by understanding the Betancuria STR occupancy trends. Seasonal demand shifts significantly influence how often properties are booked. Typically, Novembersees the highest demand (peak season occupancy), while June experiences the lowest (low season). Effective strategies, like adjusting minimum stays or offering promotions, can boost occupancy during slower periods. Here's how different property tiers perform in Betancuria:
- Best-in-class properties (Top 10%) achieve 84%+ occupancy, indicating high desirability and potentially optimized availability.
- Strong performing properties (Top 25%) maintain 63% or higher occupancy, suggesting good market fit and guest satisfaction.
- Typical properties (Median) have an occupancy rate around 45%.
- Entry-level properties (Bottom 25%) average 22% occupancy, potentially facing higher vacancy.
Average Monthly Occupancy Rate Trend in Betancuria
Average Daily Rate (ADR) Airbnb Trends in Betancuria (2025)
Effective short term rental pricing strategy in Betancuria involves understanding monthly ADR fluctuations. The Average Daily Rate (ADR) for Airbnb in Betancuria typically peaks in November and dips lowest during July. Leveraging Airbnb dynamic pricing tools or strategies based on this seasonality can significantly boost revenue. Here's a look at the typical nightly rates achieved:
- Best-in-class properties (Top 10%) command rates of $177+ per night, often due to premium features or locations.
- Strong performing properties (Top 25%) achieve nightly rates of $116 or more.
- Typical properties (Median) charge around $61 per night.
- Entry-level properties (Bottom 25%) earn around $52 per night.
Average Daily Rate (ADR) Trend by Month in Betancuria
Get Live Betancuria Market Intelligence 👇

Explore Real-time Analytics
Airbnb Seasonality Analysis & Trends in Betancuria (2025)
Peak Season (November, January, August)
- Revenue averages $2,062 per month
- Occupancy rates average 60.2%
- Daily rates average $130
Shoulder Season
- Revenue averages $1,386 per month
- Occupancy maintains around 43.3%
- Daily rates hold near $120
Low Season (March, April, June)
- Revenue drops to average $1,109 per month
- Occupancy decreases to average 37.4%
- Daily rates adjust to average $120
Seasonality Insights for Betancuria
- The Airbnb seasonality in Betancuria shows highly seasonal trends requiring careful strategy. While the sections above show seasonal averages, it's also insightful to look at the extremes:
- During the high season, the absolute peak month showcases Betancuria's highest earning potential, with monthly revenues capable of climbing to $3,061, occupancy reaching a high of 74.0%, and ADRs peaking at $148.
- Conversely, the slowest single month of the year, typically falling within the low season, marks the market's lowest point. In this month, revenue might dip to $1,010, occupancy could drop to 25.6%, and ADRs may adjust down to $105.
- Understanding both the seasonal averages and these monthly peaks and troughs in revenue, occupancy, and ADR is crucial for maximizing your Airbnb profit potential in Betancuria.
Seasonal Strategies for Maximizing Profit
- Peak Season: Maximize revenue through premium pricing and potentially longer minimum stays. Ensure high availability.
- Low Season: Offer competitive pricing, special promotions (e.g., extended stay discounts), and flexible cancellation policies. Target off-season travelers like remote workers or budget-conscious guests.
- Shoulder Seasons: Implement dynamic pricing that balances peak and low rates. Target weekend travelers or specific events. Offer slightly more flexible terms than peak season.
- Regularly analyze your own performance against these Betancuria seasonality benchmarks and adjust your pricing and availability strategy accordingly.
Best Areas for Airbnb Investment in Betancuria (2025)
Exploring the top neighborhoods for short-term rentals in Betancuria? This section highlights key areas, outlining why they are attractive for hosts and guests, along with notable local attractions. Consider these locations based on your target guest profile and investment strategy.
| Neighborhood / Area | Why Host Here? (Target Guests & Appeal) | Key Attractions & Landmarks |
|---|---|---|
| Betancuria Town Center | The historical heart of Betancuria, with charming old buildings and proximity to essential services. Ideal for those wanting a taste of local culture and history. | Betancuria Church, Casa Museo de Betancuria, the archaeological park, local artisan shops, the scenic viewpoints |
| Natural Parks Surrounding Betancuria | The breathtaking landscapes of the natural parks attract nature lovers and hikers. Great for those seeking outdoor adventures and tranquility. | Fuerteventura Natural Park, Hiking trails, Scenic views, Wildlife observation, Photography spots |
| La Oliva | Close to Betancuria and known for its cultural identity, La Oliva has beautiful landscapes and historical sites. Perfect for visitors exploring rural Fuerteventura. | La Oliva Church, Casa de los Coroneles, Cultural festivals, Local markets, Fine views of the landscape |
| Ajuy | A small coastal village known for its black sand beaches and famous caves. Attracts visitors looking for unique coastal experiences. | Ajuy Caves, Ajuy Beach, Local seafood restaurants, Scenic walks, Photography opportunities |
| Pájara | A charming town with traditional Canarian architecture and lush surroundings, perfect for guests wanting a peaceful stay. | Pájara Church, Traditional markets, Local cuisine, Historical sites, Green valleys |
| Costa Calma | While not directly in Betancuria, it's a short drive away and attracts beach lovers with its beautiful coastline and resorts. | Costa Calma Beach, Water sports, Relaxation spots, Restaurants and bars, Nightlife options |
| Morrojable | Close to Betancuria, offers access to stunning beaches and a vibrant town atmosphere, popular with tourists looking for convenience and leisure. | Morrojable Beach, Ferry to Lobos Island, Sunbathing spots, Cafés and shoppes, Local entertainment |
| La Lajita | Known for its animal park and gardens, it's a family-friendly destination close to Betancuria, appealing to travelers with children. | Oasis Park Fuerteventura, Camel rides, Exotic animals, Botanical gardens, Family-friendly activities |
Understanding Airbnb License Requirements & STR Laws in Betancuria (2025)
With 28% of listings showing registration in 2025, understanding potential Airbnb license requirements is crucial in Betancuria. Always verify the latest short term rental regulations and Airbnb license requirements directly with local government authorities for Betancuria to ensure full compliance before hosting.
(Source: AirROI data, 2025, based on 28% licensed listings)
Top Performing Airbnb Properties in Betancuria (2025)
Benchmark your potential! Explore examples of top-performing Airbnb properties in Betancuriabased on Trailing Twelve Month (TTM) revenue. Analyze their characteristics, revenue, occupancy rate, and ADR to understand what drives success in this market.
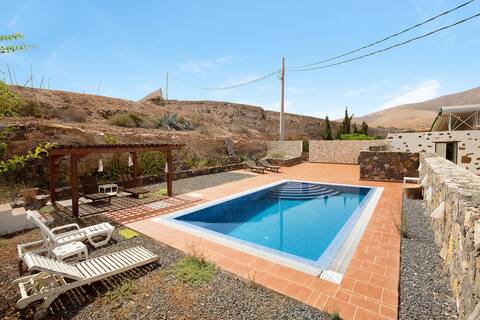
Casa del Valle
Entire Place • 2 bedrooms
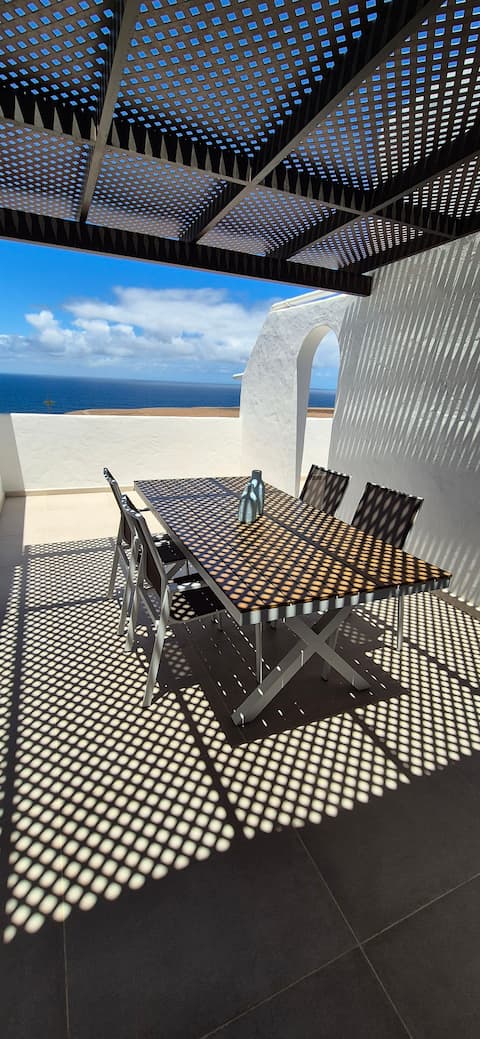
El Loft del Capitán
Entire Place • 2 bedrooms

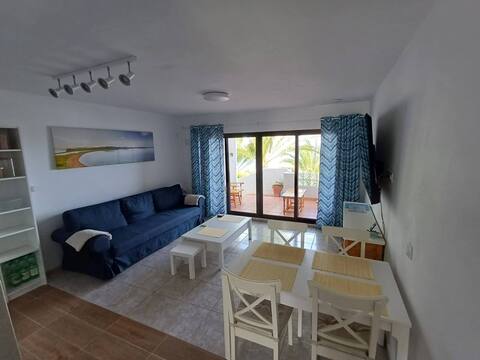
Casa Evelmar
Entire Place • 1 bedroom
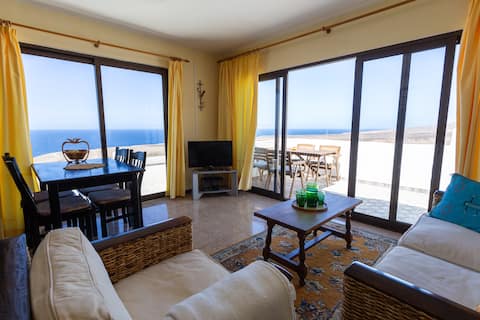
My Fuerta
Entire Place • 2 bedrooms
Casa Avalon
Entire Place • 2 bedrooms
Casa Plaza 1
Entire Place • 1 bedroom
Note: Performance varies based on location, size, amenities, seasonality, and management quality. Data reflects the past 12 months.
Top Performing Airbnb Hosts in Betancuria (2025)
Learn from the best! This table showcases top-performing Airbnb hosts in Betancuria based on the number of properties managed and estimated total revenue over the past year. Analyze their scale and performance metrics.
| Host Name | Properties | Grossing Revenue | Stay Reviews | Avg Rating |
|---|---|---|---|---|
| Holidu | 1 | $63,962 | 30 | 4.90/5.0 |
| Tina Y Heiner | 1 | $42,783 | 6 | 5.00/5.0 |
| Pablo | 1 | $41,585 | 89 | 4.93/5.0 |
| Silvia | 2 | $20,108 | 17 | 2.28/5.0 |
| Bart | 1 | $18,232 | 12 | 4.92/5.0 |
| Nina | 1 | $17,498 | 12 | 5.00/5.0 |
| Romina | 2 | $15,484 | 143 | 4.67/5.0 |
| Holidu | 1 | $9,446 | 14 | 4.29/5.0 |
| Rita | 2 | $9,325 | 24 | 4.92/5.0 |
| Juan | 2 | $9,149 | 273 | 4.61/5.0 |
Analyzing the strategies of top hosts, such as their property selection, pricing, and guest communication, can offer valuable lessons for optimizing your own Airbnb operations in Betancuria.
Dive Deeper: Advanced Betancuria STR Market Data (2025)
Ready to unlock more insights? AirROI provides access to advanced metrics and comprehensive Airbnb data for Betancuria. Explore detailed analytics beyond this report to refine your investment strategy, optimize pricing, and maximize your vacation rental profits.
Explore Advanced MetricsBetancuria Short-Term Rental Market Composition (2025): Property & Room Types
Room Type Distribution
Property Type Distribution
Market Composition Insights for Betancuria
- The Betancuria Airbnb market composition is heavily skewed towards Entire Home/Apt listings, which make up 88% of the 25 active rentals. This indicates strong guest preference for privacy and space.
- Looking at the property type distribution in Betancuria, House properties are the most common (56%), reflecting the local real estate landscape.
- Houses represent a significant 56% portion, catering likely to families or larger groups.
- Smaller segments like hotel/boutique, others (combined 8.0%) offer potential for unique stay experiences.
Betancuria Airbnb Room Capacity Analysis (2025): Bedroom Distribution
Distribution of Listings by Number of Bedrooms
Room Capacity Insights for Betancuria
- The dominant room capacity in Betancuria is 2 bedrooms listings, making up 48% of the market. This suggests a strong demand for properties suitable for couples or solo travelers.
- Together, 2 bedrooms and 1 bedroom properties represent 84.0% of the active Airbnb listings in Betancuria, indicating a high concentration in these sizes.
- Listings with 3+ bedrooms (4.0%) represent a smaller niche, potentially indicating an underserved market for larger group accommodations in Betancuria.
Betancuria Vacation Rental Guest Capacity Trends (2025)
Distribution of Listings by Guest Capacity
Guest Capacity Insights for Betancuria
- The most common guest capacity trend in Betancuria vacation rentals is listings accommodating 4 guests (40%). This suggests the primary traveler segment is likely small families or groups.
- Properties designed for 4 guests and 2 guests dominate the Betancuria STR market, accounting for 68.0% of listings.
- Listings for large groups (6+ guests) are relatively rare (4.0%), potentially indicating an opportunity for hosts targeting this segment in Betancuria.
- On average, properties in Betancuria are equipped to host 3.1 guests.
Betancuria Airbnb Booking Patterns (2025): Available vs. Booked Days
Available Days Distribution
Booked Days Distribution
Booking Pattern Insights for Betancuria
- The most common availability pattern in Betancuria falls within the 271-366 days range, representing 56% of listings. This suggests many properties have significant open periods on their calendars.
- Approximately 72.0% of listings show high availability (181+ days open annually), indicating potential for increased bookings or specific owner usage patterns.
- For booked days, the 31-90 days range is most frequent in Betancuria (28%), reflecting common guest stay durations or potential owner blocking patterns.
- A notable 28.0% of properties secure long booking periods (181+ days booked per year), highlighting successful long-term rental strategies or significant owner usage.
Betancuria Airbnb Minimum Stay Requirements Analysis
Distribution of Listings by Minimum Night Requirement
1 Night
4 listings
16% of total
2 Nights
6 listings
24% of total
3 Nights
2 listings
8% of total
4-6 Nights
8 listings
32% of total
7-29 Nights
3 listings
12% of total
30+ Nights
2 listings
8% of total
Key Insights
- The most prevalent minimum stay requirement in Betancuria is 4-6 Nights, adopted by 32% of listings. This highlights the market's preference for longer commitments.
Recommendations
- Align with the market by considering a 4-6 Nights minimum stay, as 32% of Betancuria hosts use this setting.
- If feasible, allowing 1-night stays, especially midweek or during low season, could capture last-minute bookings, as only 16% currently do.
- Explore offering discounts for stays of 30+ nights to attract the 8% of the market seeking extended stays.
- Adjust minimum nights based on seasonality – potentially shorter during low season and longer during peak demand periods in Betancuria.
Betancuria Airbnb Cancellation Policy Trends Analysis (2025)
Super Strict 30 Days
1 listings
4.3% of total
Flexible
9 listings
39.1% of total
Moderate
4 listings
17.4% of total
Firm
3 listings
13% of total
Strict
6 listings
26.1% of total
Cancellation Policy Insights for Betancuria
- The prevailing Airbnb cancellation policy trend in Betancuria is Flexible, used by 39.1% of listings.
- There's a relatively balanced mix between guest-friendly (56.5%) and stricter (39.1%) policies, offering choices for different guest needs.
Recommendations for Hosts
- Consider adopting a Flexible policy to align with the 39.1% market standard in Betancuria.
- Regularly review your cancellation policy against competitors and market demand shifts in Betancuria.
Betancuria STR Booking Lead Time Analysis (2025)
Average Booking Lead Time by Month
Booking Lead Time Insights for Betancuria
- The overall average booking lead time for vacation rentals in Betancuria is 84 days.
- Guests book furthest in advance for stays during December (average 96 days), likely coinciding with peak travel demand or local events.
- The shortest booking windows occur for stays in September (average 54 days), indicating more last-minute travel plans during this time.
- Seasonally, Winter (76 days avg.) sees the longest lead times, while Summer (64 days avg.) has the shortest, reflecting typical travel planning cycles.
Recommendations for Hosts
- Use the overall average lead time (84 days) as a baseline for your pricing and availability strategy in Betancuria.
- For December stays, consider implementing length-of-stay discounts or slightly higher rates for bookings made less than 96 days out to capitalize on advance planning.
- Target marketing efforts for the Winter season well in advance (at least 76 days) to capture early planners.
- Monitor your own booking lead times against these Betancuria averages to identify opportunities for dynamic pricing adjustments.
Popular & Essential Airbnb Amenities in Betancuria (2025)
Amenity Prevalence
Amenity Insights for Betancuria
- Essential amenities in Betancuria that guests expect include: Wifi. Lacking these (this) could significantly impact bookings.
- Popular amenities like Dishes and silverware, Cooking basics, Kitchen are common but not universal. Offering these can provide a competitive edge.
Recommendations for Hosts
- Ensure your listing includes all essential amenities for Betancuria: Wifi.
- Consider adding popular differentiators like Dishes and silverware or Cooking basics to increase appeal.
- Highlight unique or less common amenities you offer (e.g., hot tub, dedicated workspace, EV charger) in your listing description and photos.
- Regularly check competitor amenities in Betancuria to stay competitive.
Betancuria Airbnb Guest Demographics & Profile Analysis (2025)
Guest Profile Summary for Betancuria
- The typical guest profile for Airbnb in Betancuria consists of predominantly international visitors (80%), with top international origins including Spain, typically belonging to the Post-2000s (Gen Z/Alpha) group (50%), primarily speaking English or German.
- Domestic travelers account for 20.4% of guests.
- Key international markets include Germany (28%) and Spain (20.4%).
- Top languages spoken are English (34.6%) followed by German (17.6%).
- A significant demographic segment is the Post-2000s (Gen Z/Alpha) group, representing 50% of guests.
Recommendations for Hosts
- Focus marketing internationally, particularly towards travelers from Spain.
- Tailor amenities and listing descriptions to appeal to the dominant Post-2000s (Gen Z/Alpha) demographic (e.g., highlight fast WiFi, smart home features, local guides).
- Highlight unique local experiences or amenities relevant to the primary guest profile.
- Consider seasonal promotions aligned with peak travel times for key origin markets.
Nearby Short-Term Rental Market Comparison
How does the Betancuria Airbnb market stack up against its neighbors? Compare key performance metrics like average monthly revenue, ADR, and occupancy rates in surrounding areas to understand the broader regional STR landscape.
| Market | Active Properties | Monthly Revenue | Daily Rate | Avg. Occupancy |
|---|---|---|---|---|
| Yaiza | 1,433 | $2,369 | $242.14 | 50% |
| Lajares | 347 | $2,137 | $169.68 | 53% |
| Tías | 1,491 | $2,055 | $172.05 | 56% |
| Villaverde | 90 | $1,736 | $141.77 | 50% |
| Teguise | 1,351 | $1,657 | $127.61 | 56% |
| San Bartolomé de Tirajana | 2,717 | $1,640 | $155.10 | 48% |
| Agaete | 202 | $1,612 | $121.39 | 51% |
| Mogán | 1,238 | $1,504 | $153.88 | 46% |
| Haría | 475 | $1,465 | $142.83 | 50% |
| Arucas | 96 | $1,396 | $157.05 | 43% |