Artenara Airbnb Market Analysis 2025: Short Term Rental Data & Vacation Rental Statistics in Canary Islands, Spain
Is Airbnb profitable in Artenara in 2025? Explore comprehensive Airbnb analytics for Artenara, Canary Islands, Spain to uncover income potential. This 2025 STR market report for Artenara, based on AirROI data from April 2024 to March 2025, reveals key trends in the niche market of 18 active listings.
Whether you're considering an Airbnb investment in Artenara, optimizing your existing vacation rental, or exploring rental arbitrage opportunities, understanding the Artenara Airbnb data is crucial. Navigating the high regulation landscape is key to maximizing your short term rental income potential. Let's dive into the specifics.
Key Artenara Airbnb Performance Metrics Overview
Monthly Airbnb Revenue Variations & Income Potential in Artenara (2025)
Understanding the monthly revenue variations for Airbnb listings in Artenara is key to maximizing your short term rental income potential. Seasonality significantly impacts earnings. Our analysis, based on data from the past 12 months, shows that the peak revenue month for STRs in Artenara is typically December, while June often presents the lowest earnings, highlighting opportunities for strategic pricing adjustments during shoulder and low seasons. Explore the typical Airbnb income in Artenara across different performance tiers:
- Best-in-class properties (Top 10%) achieve $2,450+ monthly, often utilizing dynamic pricing and superior guest experiences.
- Strong performing properties (Top 25%) earn $1,850 or more, indicating effective management and desirable locations/amenities.
- Typical properties (Median) generate around $1,177 per month, representing the average market performance.
- Entry-level properties (Bottom 25%) see earnings around $770, often with potential for optimization.
Average Monthly Airbnb Earnings Trend in Artenara
Artenara Airbnb Occupancy Rate Trends (2025)
Maximize your bookings by understanding the Artenara STR occupancy trends. Seasonal demand shifts significantly influence how often properties are booked. Typically, Decembersees the highest demand (peak season occupancy), while September experiences the lowest (low season). Effective strategies, like adjusting minimum stays or offering promotions, can boost occupancy during slower periods. Here's how different property tiers perform in Artenara:
- Best-in-class properties (Top 10%) achieve 79%+ occupancy, indicating high desirability and potentially optimized availability.
- Strong performing properties (Top 25%) maintain 65% or higher occupancy, suggesting good market fit and guest satisfaction.
- Typical properties (Median) have an occupancy rate around 47%.
- Entry-level properties (Bottom 25%) average 30% occupancy, potentially facing higher vacancy.
Average Monthly Occupancy Rate Trend in Artenara
Average Daily Rate (ADR) Airbnb Trends in Artenara (2025)
Effective short term rental pricing strategy in Artenara involves understanding monthly ADR fluctuations. The Average Daily Rate (ADR) for Airbnb in Artenara typically peaks in December and dips lowest during May. Leveraging Airbnb dynamic pricing tools or strategies based on this seasonality can significantly boost revenue. Here's a look at the typical nightly rates achieved:
- Best-in-class properties (Top 10%) command rates of $128+ per night, often due to premium features or locations.
- Strong performing properties (Top 25%) achieve nightly rates of $107 or more.
- Typical properties (Median) charge around $86 per night.
- Entry-level properties (Bottom 25%) earn around $66 per night.
Average Daily Rate (ADR) Trend by Month in Artenara
Get Live Artenara Market Intelligence 👇

Explore Real-time Analytics
Airbnb Seasonality Analysis & Trends in Artenara (2025)
Peak Season (December, January, February)
- Revenue averages $2,012 per month
- Occupancy rates average 67.0%
- Daily rates average $97
Shoulder Season
- Revenue averages $1,299 per month
- Occupancy maintains around 47.9%
- Daily rates hold near $90
Low Season (June, July, September)
- Revenue drops to average $769 per month
- Occupancy decreases to average 29.2%
- Daily rates adjust to average $86
Seasonality Insights for Artenara
- The Airbnb seasonality in Artenara shows highly seasonal trends requiring careful strategy. While the sections above show seasonal averages, it's also insightful to look at the extremes:
- During the high season, the absolute peak month showcases Artenara's highest earning potential, with monthly revenues capable of climbing to $2,255, occupancy reaching a high of 71.0%, and ADRs peaking at $99.
- Conversely, the slowest single month of the year, typically falling within the low season, marks the market's lowest point. In this month, revenue might dip to $704, occupancy could drop to 28.4%, and ADRs may adjust down to $84.
- Understanding both the seasonal averages and these monthly peaks and troughs in revenue, occupancy, and ADR is crucial for maximizing your Airbnb profit potential in Artenara.
Seasonal Strategies for Maximizing Profit
- Peak Season: Maximize revenue through premium pricing and potentially longer minimum stays. Ensure high availability.
- Low Season: Offer competitive pricing, special promotions (e.g., extended stay discounts), and flexible cancellation policies. Target off-season travelers like remote workers or budget-conscious guests.
- Shoulder Seasons: Implement dynamic pricing that balances peak and low rates. Target weekend travelers or specific events. Offer slightly more flexible terms than peak season.
- Regularly analyze your own performance against these Artenara seasonality benchmarks and adjust your pricing and availability strategy accordingly.
Best Areas for Airbnb Investment in Artenara (2025)
Exploring the top neighborhoods for short-term rentals in Artenara? This section highlights key areas, outlining why they are attractive for hosts and guests, along with notable local attractions. Consider these locations based on your target guest profile and investment strategy.
| Neighborhood / Area | Why Host Here? (Target Guests & Appeal) | Key Attractions & Landmarks |
|---|---|---|
| Centro de Artenara | The historic center of Artenara with traditional architecture and local charm. A cultural hub that attracts visitors interested in the Canary Islands' heritage and natural beauty. | Church of San Matías, Casa de la Música, Cueva Pintada Museum, Mirador de la Pila, Local artisan shops |
| Pico de las Nieves | The highest point in Gran Canaria, offering stunning panoramic views and hiking opportunities. Attracts nature lovers and adventure seekers. | Pico de las Nieves Lookout, Hiking trails, Roque Nublo, Natural park of Nublo, Beautiful viewpoints |
| Agaete | A coastal town known for its natural swimming pools and beautiful beaches. A great location for those looking to explore the northwestern coastline of Gran Canaria. | Las Salinas, Agaete Natural Pools, Agaete Valley, Cruz de Tejeda, Beaches of Puerto de Las Nieves |
| Firgas | A quaint village famous for its water springs and attractive landscapes. Offers a relaxed atmosphere and scenic beauty, appealing to travelers seeking tranquility. | Firgas Waterfall, Canary Islands Water Pipeline, Basilica de Nuestra Señora de la Candelaria, Mirador de Firgas, Local markets |
| Valleseco | Known for its lush green landscapes and hiking trails. Perfect for eco-tourism and those looking to enjoy nature away from the tourist crowds. | Parque Natural de las Nieves, Pico de las Nieves, Cruz de Tejeda, Hiking routes, Botanical garden |
| Las Palmas de Gran Canaria | The capital city of Gran Canaria, offering a mix of city life, culture, and beach experiences. Great for attracting a diverse range of visitors. | Las Canteras Beach, Vegueta Historic District, Museo Canario, Casa de Colón, Parque de Santa Catalina |
| The Dunes of Maspalomas | Famous for its stunning natural sand dunes and unique desert-like landscape. A major tourist attraction with a variety of accommodations and activities. | Maspalomas Dunes, Maspalomas Lighthouse, Playa de Maspalomas, Camel rides, Nature Reserve |
| Teror | Known for its traditional Canarian architecture and scenic streets. A cultural gem appealing to visitors who want to experience local life and traditions. | Basilica de Nuestra Señora del Pino, Teror Market, Historic streets, Local cuisine, Lovely viewpoints |
Understanding Airbnb License Requirements & STR Laws in Artenara (2025)
Yes, Artenara, Canary Islands, Spain enforces high STR regulations. Obtaining a license and ensuring compliance is almost certainly required according to current 2025 STR laws. Always verify the latest short term rental regulations and Airbnb license requirements directly with local government authorities for Artenara to ensure full compliance before hosting.
(Source: AirROI data, 2025, based on 78% licensed listings)
Top Performing Airbnb Properties in Artenara (2025)
Benchmark your potential! Explore examples of top-performing Airbnb properties in Artenarabased on Trailing Twelve Month (TTM) revenue. Analyze their characteristics, revenue, occupancy rate, and ADR to understand what drives success in this market.

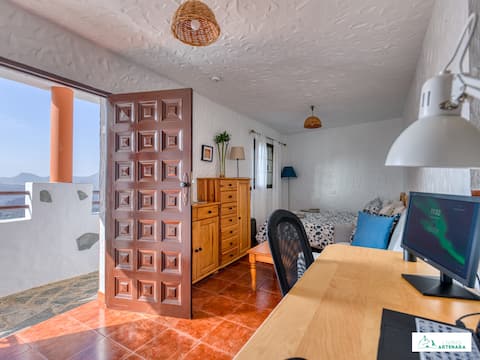
CAVE HOUSE & TERRACE | Remote working | Hiking
Entire Place • 2 bedrooms

Casa Cueva El Mimo
Entire Place • 2 bedrooms

Silence´s cave Rural House. Lic. 2278. Acusa Seca
Entire Place • 2 bedrooms
Superb Family Villa "Cá Migué"
Entire Place • 6 bedrooms

Casa Cueva Las Margaritas
Entire Place • 2 bedrooms
EARTH | Remote Working | Hiking
Entire Place • 1 bedroom
Note: Performance varies based on location, size, amenities, seasonality, and management quality. Data reflects the past 12 months.
Top Performing Airbnb Hosts in Artenara (2025)
Learn from the best! This table showcases top-performing Airbnb hosts in Artenara based on the number of properties managed and estimated total revenue over the past year. Analyze their scale and performance metrics.
| Host Name | Properties | Grossing Revenue | Stay Reviews | Avg Rating |
|---|---|---|---|---|
| Miriam | 6 | $73,148 | 168 | 4.84/5.0 |
| LIVING LAS CANTERAS HOMES - Ju | 3 | $67,318 | 171 | 4.89/5.0 |
| Marta | 2 | $23,093 | 299 | 4.95/5.0 |
| José Manuel | 1 | $21,252 | 44 | 4.93/5.0 |
| Miguel Carmelo | 1 | $20,366 | 89 | 4.82/5.0 |
| Manuel | 1 | $15,444 | 588 | 4.81/5.0 |
| Agustina | 1 | $10,909 | 91 | 4.90/5.0 |
| Helena | 1 | $7,902 | 524 | 4.75/5.0 |
| Daphné | 1 | $1,536 | 51 | 4.67/5.0 |
| Host #30196857 | 1 | $362 | 0 | 0.00/5.0 |
Analyzing the strategies of top hosts, such as their property selection, pricing, and guest communication, can offer valuable lessons for optimizing your own Airbnb operations in Artenara.
Dive Deeper: Advanced Artenara STR Market Data (2025)
Ready to unlock more insights? AirROI provides access to advanced metrics and comprehensive Airbnb data for Artenara. Explore detailed analytics beyond this report to refine your investment strategy, optimize pricing, and maximize your vacation rental profits.
Explore Advanced MetricsArtenara Short-Term Rental Market Composition (2025): Property & Room Types
Room Type Distribution
Property Type Distribution
Market Composition Insights for Artenara
- The Artenara Airbnb market composition is heavily skewed towards Entire Home/Apt listings, which make up 100% of the 18 active rentals. This indicates strong guest preference for privacy and space.
- Looking at the property type distribution in Artenara, House properties are the most common (61.1%), reflecting the local real estate landscape.
- Houses represent a significant 61.1% portion, catering likely to families or larger groups.
Artenara Airbnb Room Capacity Analysis (2025): Bedroom Distribution
Distribution of Listings by Number of Bedrooms
Room Capacity Insights for Artenara
- The dominant room capacity in Artenara is 2 bedrooms listings, making up 44.4% of the market. This suggests a strong demand for properties suitable for couples or solo travelers.
- Together, 2 bedrooms and 1 bedroom properties represent 83.3% of the active Airbnb listings in Artenara, indicating a high concentration in these sizes.
Artenara Vacation Rental Guest Capacity Trends (2025)
Distribution of Listings by Guest Capacity
Guest Capacity Insights for Artenara
- The most common guest capacity trend in Artenara vacation rentals is listings accommodating 4 guests (33.3%). This suggests the primary traveler segment is likely small families or groups.
- Properties designed for 4 guests and 2 guests dominate the Artenara STR market, accounting for 50.0% of listings.
- 22.3% of properties accommodate 6+ guests, serving the market segment for larger families or group travel in Artenara.
- On average, properties in Artenara are equipped to host 4.3 guests.
Artenara Airbnb Booking Patterns (2025): Available vs. Booked Days
Available Days Distribution
Booked Days Distribution
Booking Pattern Insights for Artenara
- The most common availability pattern in Artenara falls within the 181-270 days range, representing 33.3% of listings. This suggests many properties have significant open periods on their calendars.
- Approximately 61.1% of listings show high availability (181+ days open annually), indicating potential for increased bookings or specific owner usage patterns.
- For booked days, the 181-270 days range is most frequent in Artenara (38.9%), reflecting common guest stay durations or potential owner blocking patterns.
- A notable 44.5% of properties secure long booking periods (181+ days booked per year), highlighting successful long-term rental strategies or significant owner usage.
Artenara Airbnb Minimum Stay Requirements Analysis
Distribution of Listings by Minimum Night Requirement
1 Night
1 listings
5.9% of total
2 Nights
4 listings
23.5% of total
3 Nights
2 listings
11.8% of total
4-6 Nights
8 listings
47.1% of total
30+ Nights
2 listings
11.8% of total
Key Insights
- The most prevalent minimum stay requirement in Artenara is 4-6 Nights, adopted by 47.1% of listings. This highlights the market's preference for longer commitments.
- A significant segment (11.8%) caters to monthly stays (30+ nights) in Artenara, pointing to opportunities in the extended-stay market.
Recommendations
- Align with the market by considering a 4-6 Nights minimum stay, as 47.1% of Artenara hosts use this setting.
- If feasible, allowing 1-night stays, especially midweek or during low season, could capture last-minute bookings, as only 5.9% currently do.
- Explore offering discounts for stays of 30+ nights to attract the 11.8% of the market seeking extended stays.
- Adjust minimum nights based on seasonality – potentially shorter during low season and longer during peak demand periods in Artenara.
Artenara Airbnb Cancellation Policy Trends Analysis (2025)
Flexible
2 listings
11.8% of total
Moderate
4 listings
23.5% of total
Firm
6 listings
35.3% of total
Strict
5 listings
29.4% of total
Cancellation Policy Insights for Artenara
- The prevailing Airbnb cancellation policy trend in Artenara is Firm, used by 35.3% of listings.
- A majority (64.7%) of hosts in Artenara utilize Firm or Strict policies, indicating a market where hosts prioritize booking security.
Recommendations for Hosts
- Consider adopting a Firm policy to align with the 35.3% market standard in Artenara.
- Regularly review your cancellation policy against competitors and market demand shifts in Artenara.
Artenara STR Booking Lead Time Analysis (2025)
Average Booking Lead Time by Month
Booking Lead Time Insights for Artenara
- The overall average booking lead time for vacation rentals in Artenara is 48 days.
- Guests book furthest in advance for stays during August (average 72 days), likely coinciding with peak travel demand or local events.
- The shortest booking windows occur for stays in March (average 30 days), indicating more last-minute travel plans during this time.
- Seasonally, Fall (51 days avg.) sees the longest lead times, while Winter (40 days avg.) has the shortest, reflecting typical travel planning cycles.
Recommendations for Hosts
- Use the overall average lead time (48 days) as a baseline for your pricing and availability strategy in Artenara.
- For August stays, consider implementing length-of-stay discounts or slightly higher rates for bookings made less than 72 days out to capitalize on advance planning.
- Target marketing efforts for the Fall season well in advance (at least 51 days) to capture early planners.
- Monitor your own booking lead times against these Artenara averages to identify opportunities for dynamic pricing adjustments.
Popular & Essential Airbnb Amenities in Artenara (2025)
Amenity Prevalence
Amenity Insights for Artenara
- Popular amenities like Hot water, Kitchen, Dishes and silverware are common but not universal. Offering these can provide a competitive edge.
- Warning: Wifi is not universally provided but is considered essential globally. Ensure reliable Wifi is offered.
Recommendations for Hosts
- Consider adding popular differentiators like Hot water or Kitchen to increase appeal.
- Highlight unique or less common amenities you offer (e.g., hot tub, dedicated workspace, EV charger) in your listing description and photos.
- Regularly check competitor amenities in Artenara to stay competitive.
Artenara Airbnb Guest Demographics & Profile Analysis (2025)
Guest Profile Summary for Artenara
- The typical guest profile for Airbnb in Artenara consists of predominantly international visitors (82%), with top international origins including United Kingdom, typically belonging to the Post-2000s (Gen Z/Alpha) group (50%), primarily speaking English or German.
- Domestic travelers account for 18.4% of guests.
- Key international markets include Germany (20.8%) and United Kingdom (20%).
- Top languages spoken are English (41.6%) followed by German (16.8%).
- A significant demographic segment is the Post-2000s (Gen Z/Alpha) group, representing 50% of guests.
Recommendations for Hosts
- Focus marketing internationally, particularly towards travelers from United Kingdom.
- Tailor amenities and listing descriptions to appeal to the dominant Post-2000s (Gen Z/Alpha) demographic (e.g., highlight fast WiFi, smart home features, local guides).
- Highlight unique local experiences or amenities relevant to the primary guest profile.
- Consider seasonal promotions aligned with peak travel times for key origin markets.
Nearby Short-Term Rental Market Comparison
How does the Artenara Airbnb market stack up against its neighbors? Compare key performance metrics like average monthly revenue, ADR, and occupancy rates in surrounding areas to understand the broader regional STR landscape.
| Market | Active Properties | Monthly Revenue | Daily Rate | Avg. Occupancy |
|---|---|---|---|---|
| El Sauzal | 94 | $2,759 | $231.94 | 52% |
| La Victoria de Acentejo | 18 | $2,591 | $227.75 | 54% |
| Santa Úrsula | 134 | $2,276 | $200.12 | 49% |
| Adeje | 3,043 | $2,203 | $189.97 | 51% |
| San Miguel de Abona | 666 | $1,918 | $173.37 | 49% |
| El Rosario | 227 | $1,846 | $140.14 | 56% |
| San Bartolomé de Tirajana | 2,717 | $1,640 | $155.10 | 48% |
| Los Realejos | 263 | $1,626 | $119.12 | 54% |
| Santiago del Teide | 773 | $1,616 | $140.24 | 50% |
| La Orotava | 267 | $1,614 | $133.19 | 51% |