Son Verí Airbnb Market Analysis 2025: Short Term Rental Data & Vacation Rental Statistics in Balearic Islands, Spain
Is Airbnb profitable in Son Verí in 2025? Explore comprehensive Airbnb analytics for Son Verí, Balearic Islands, Spain to uncover income potential. This 2025 STR market report for Son Verí, based on AirROI data from April 2024 to March 2025, reveals key trends in the niche market of 58 active listings.
Whether you're considering an Airbnb investment in Son Verí, optimizing your existing vacation rental, or exploring rental arbitrage opportunities, understanding the Son Verí Airbnb data is crucial. Navigating the high regulation landscape is key to maximizing your short term rental income potential. Let's dive into the specifics.
Key Son Verí Airbnb Performance Metrics Overview
Monthly Airbnb Revenue Variations & Income Potential in Son Verí (2025)
Understanding the monthly revenue variations for Airbnb listings in Son Verí is key to maximizing your short term rental income potential. Seasonality significantly impacts earnings. Our analysis, based on data from the past 12 months, shows that the peak revenue month for STRs in Son Verí is typically August, while February often presents the lowest earnings, highlighting opportunities for strategic pricing adjustments during shoulder and low seasons. Explore the typical Airbnb income in Son Verí across different performance tiers:
- Best-in-class properties (Top 10%) achieve $9,460+ monthly, often utilizing dynamic pricing and superior guest experiences.
- Strong performing properties (Top 25%) earn $3,924 or more, indicating effective management and desirable locations/amenities.
- Typical properties (Median) generate around $1,801 per month, representing the average market performance.
- Entry-level properties (Bottom 25%) see earnings around $939, often with potential for optimization.
Average Monthly Airbnb Earnings Trend in Son Verí
Son Verí Airbnb Occupancy Rate Trends (2025)
Maximize your bookings by understanding the Son Verí STR occupancy trends. Seasonal demand shifts significantly influence how often properties are booked. Typically, Augustsees the highest demand (peak season occupancy), while January experiences the lowest (low season). Effective strategies, like adjusting minimum stays or offering promotions, can boost occupancy during slower periods. Here's how different property tiers perform in Son Verí:
- Best-in-class properties (Top 10%) achieve 85%+ occupancy, indicating high desirability and potentially optimized availability.
- Strong performing properties (Top 25%) maintain 67% or higher occupancy, suggesting good market fit and guest satisfaction.
- Typical properties (Median) have an occupancy rate around 40%.
- Entry-level properties (Bottom 25%) average 19% occupancy, potentially facing higher vacancy.
Average Monthly Occupancy Rate Trend in Son Verí
Average Daily Rate (ADR) Airbnb Trends in Son Verí (2025)
Effective short term rental pricing strategy in Son Verí involves understanding monthly ADR fluctuations. The Average Daily Rate (ADR) for Airbnb in Son Verí typically peaks in August and dips lowest during April. Leveraging Airbnb dynamic pricing tools or strategies based on this seasonality can significantly boost revenue. Here's a look at the typical nightly rates achieved:
- Best-in-class properties (Top 10%) command rates of $557+ per night, often due to premium features or locations.
- Strong performing properties (Top 25%) achieve nightly rates of $237 or more.
- Typical properties (Median) charge around $127 per night.
- Entry-level properties (Bottom 25%) earn around $64 per night.
Average Daily Rate (ADR) Trend by Month in Son Verí
Get Live Son Verí Market Intelligence 👇

Explore Real-time Analytics
Airbnb Seasonality Analysis & Trends in Son Verí (2025)
Peak Season (August, July, June)
- Revenue averages $6,077 per month
- Occupancy rates average 53.7%
- Daily rates average $262
Shoulder Season
- Revenue averages $3,361 per month
- Occupancy maintains around 43.4%
- Daily rates hold near $237
Low Season (January, February, December)
- Revenue drops to average $1,343 per month
- Occupancy decreases to average 36.2%
- Daily rates adjust to average $238
Seasonality Insights for Son Verí
- The Airbnb seasonality in Son Verí shows highly seasonal trends requiring careful strategy. While the sections above show seasonal averages, it's also insightful to look at the extremes:
- During the high season, the absolute peak month showcases Son Verí's highest earning potential, with monthly revenues capable of climbing to $6,482, occupancy reaching a high of 60.2%, and ADRs peaking at $269.
- Conversely, the slowest single month of the year, typically falling within the low season, marks the market's lowest point. In this month, revenue might dip to $1,244, occupancy could drop to 33.2%, and ADRs may adjust down to $213.
- Understanding both the seasonal averages and these monthly peaks and troughs in revenue, occupancy, and ADR is crucial for maximizing your Airbnb profit potential in Son Verí.
Seasonal Strategies for Maximizing Profit
- Peak Season: Maximize revenue through premium pricing and potentially longer minimum stays. Ensure high availability.
- Low Season: Offer competitive pricing, special promotions (e.g., extended stay discounts), and flexible cancellation policies. Target off-season travelers like remote workers or budget-conscious guests.
- Shoulder Seasons: Implement dynamic pricing that balances peak and low rates. Target weekend travelers or specific events. Offer slightly more flexible terms than peak season.
- Regularly analyze your own performance against these Son Verí seasonality benchmarks and adjust your pricing and availability strategy accordingly.
Best Areas for Airbnb Investment in Son Verí (2025)
Exploring the top neighborhoods for short-term rentals in Son Verí? This section highlights key areas, outlining why they are attractive for hosts and guests, along with notable local attractions. Consider these locations based on your target guest profile and investment strategy.
| Neighborhood / Area | Why Host Here? (Target Guests & Appeal) | Key Attractions & Landmarks |
|---|---|---|
| Son Verí | A charming coastal area known for its relaxed atmosphere, beautiful beaches, and proximity to Palma. Ideal for tourists looking for a tranquil getaway near the sea. | Son Verí Beach, Restaurants along the coast, Close to Palma city, Historical sites nearby, Water sports opportunities |
| S'Arenal | Popular tourist destination with vibrant nightlife and a wide range of activities. Great for attracting young travelers and party-goers. | Aqualand El Arenal, S'Arenal beach, Nightclubs and bars, Shopping centers, Local markets |
| Cala Blava | A quiet residential area known for its stunning sea views and crystal-clear waters, perfect for family vacations and relaxing retreats. | Cala Blava Beach, Cliffs and walking paths, Diving spots, Local cafes and restaurants, Nearby water activities |
| Las Maravillas | A vibrant area that's close to the airport and ideal for those who love the nightlife in Arenal but want a quieter retreat. | Las Maravillas Beach, Local eateries, Proximity to Palma, Scenic coastal pathways, Water sports activities |
| El Molinar | A picturesque fishing village with a laid-back vibe, attracting tourists looking for authenticity and local culture. | El Molinar beaches, Promenade and sea views, Dining by the sea, Cultural experiences, Arts and crafts shops |
| Porto Pi | A trendy area known for its marina and shopping, appealing to those looking for a mix of relaxation and urban lifestyle. | Porto Pi Marina, Shopping Center Porto Pi, Restaurants and bars, Cultural attractions nearby, Beautiful waterfront views |
| Palma City Center | The heart of Mallorca with historical attractions, shopping, and dining. Perfect for tourists seeking a bustling urban experience with cultural richness. | La Seu Cathedral, Bellver Castle, Palma's Old Town, Shopping areas, Local tapas bars |
| Can Pastilla | A family-friendly area with a long beach and plenty of activities, suitable for summer vacations and family stays. | Can Pastilla Beach, Water parks nearby, Promenade with cafes, Family-friendly restaurants, Proximity to Palma |
Understanding Airbnb License Requirements & STR Laws in Son Verí (2025)
Yes, Son Verí, Balearic Islands, Spain enforces high STR regulations. Obtaining a license and ensuring compliance is almost certainly required according to current 2025 STR laws. Always verify the latest short term rental regulations and Airbnb license requirements directly with local government authorities for Son Verí to ensure full compliance before hosting.
(Source: AirROI data, 2025, based on 45% licensed listings)
Top Performing Airbnb Properties in Son Verí (2025)
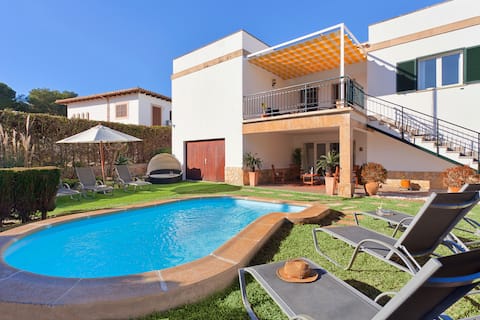
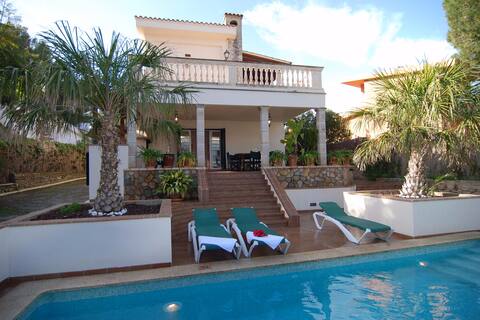
Benchmark your potential! Explore examples of top-performing Airbnb properties in Son Veríbased on Trailing Twelve Month (TTM) revenue. Analyze their characteristics, revenue, occupancy rate, and ADR to understand what drives success in this market.
Villa Son Veri de la Marina
Entire Place • 8 bedrooms
Villa Son Veri d 'All
Entire Place • 7 bedrooms
Frontline, Son Veri Pool Villa
Entire Place • 6 bedrooms
Villa Ribera de Son Veri
Entire Place • 6 bedrooms
Villa Son Veri Miramar
Entire Place • 6 bedrooms
SOL VERI. Elegant Villa with private pool and BBQ.
Entire Place • 5 bedrooms
Note: Performance varies based on location, size, amenities, seasonality, and management quality. Data reflects the past 12 months.
Top Performing Airbnb Hosts in Son Verí (2025)
Learn from the best! This table showcases top-performing Airbnb hosts in Son Verí based on the number of properties managed and estimated total revenue over the past year. Analyze their scale and performance metrics.
| Host Name | Properties | Grossing Revenue | Stay Reviews | Avg Rating |
|---|---|---|---|---|
| Portic | 6 | $646,125 | 235 | 4.33/5.0 |
| Holidu | 1 | $181,530 | 32 | 5.00/5.0 |
| Trinidad | 1 | $142,998 | 19 | 4.89/5.0 |
| Miquel | 1 | $106,534 | 39 | 5.00/5.0 |
| Mickey | 1 | $106,333 | 26 | 4.69/5.0 |
| Hotel_Fenix | 12 | $97,516 | 941 | 4.59/5.0 |
| Laura | 2 | $93,692 | 156 | 4.88/5.0 |
| Host #189406477 | 5 | $78,529 | 6 | 0.00/5.0 |
| Cristina | 2 | $75,173 | 21 | 4.95/5.0 |
| Amina | 2 | $71,271 | 141 | 4.80/5.0 |
Analyzing the strategies of top hosts, such as their property selection, pricing, and guest communication, can offer valuable lessons for optimizing your own Airbnb operations in Son Verí.
Dive Deeper: Advanced Son Verí STR Market Data (2025)
Ready to unlock more insights? AirROI provides access to advanced metrics and comprehensive Airbnb data for Son Verí. Explore detailed analytics beyond this report to refine your investment strategy, optimize pricing, and maximize your vacation rental profits.
Explore Advanced MetricsSon Verí Short-Term Rental Market Composition (2025): Property & Room Types
Room Type Distribution
Property Type Distribution
Market Composition Insights for Son Verí
- The Son Verí Airbnb market composition is heavily skewed towards Private Room listings, which make up 50% of the 58 active rentals. This indicates strong guest preference for privacy and space.
- Looking at the property type distribution in Son Verí, House properties are the most common (37.9%), reflecting the local real estate landscape.
- Houses represent a significant 37.9% portion, catering likely to families or larger groups.
- The presence of 24.1% Hotel/Boutique listings indicates integration with traditional hospitality.
Son Verí Airbnb Room Capacity Analysis (2025): Bedroom Distribution
Distribution of Listings by Number of Bedrooms
Room Capacity Insights for Son Verí
- The dominant room capacity in Son Verí is 1 bedroom listings, making up 43.1% of the market. This suggests a strong demand for properties suitable for couples or solo travelers.
- Together, 1 bedroom and 5+ bedrooms properties represent 58.6% of the active Airbnb listings in Son Verí, indicating a high concentration in these sizes.
- A significant 29.3% of listings offer 3+ bedrooms, catering to larger groups and families seeking more space in Son Verí.
Son Verí Vacation Rental Guest Capacity Trends (2025)
Distribution of Listings by Guest Capacity
Guest Capacity Insights for Son Verí
- The most common guest capacity trend in Son Verí vacation rentals is listings accommodating 2 guests (25.9%). This suggests the primary traveler segment is likely couples or solo travelers.
- Properties designed for 2 guests and 8+ guests dominate the Son Verí STR market, accounting for 43.1% of listings.
- 27.5% of properties accommodate 6+ guests, serving the market segment for larger families or group travel in Son Verí.
- On average, properties in Son Verí are equipped to host 3.7 guests.
Son Verí Airbnb Booking Patterns (2025): Available vs. Booked Days
Available Days Distribution
Booked Days Distribution
Booking Pattern Insights for Son Verí
- The most common availability pattern in Son Verí falls within the 271-366 days range, representing 41.4% of listings. This suggests many properties have significant open periods on their calendars.
- Approximately 75.9% of listings show high availability (181+ days open annually), indicating potential for increased bookings or specific owner usage patterns.
- For booked days, the 91-180 days range is most frequent in Son Verí (34.5%), reflecting common guest stay durations or potential owner blocking patterns.
- A notable 24.1% of properties secure long booking periods (181+ days booked per year), highlighting successful long-term rental strategies or significant owner usage.
Son Verí Airbnb Minimum Stay Requirements Analysis
Distribution of Listings by Minimum Night Requirement
1 Night
22 listings
45.8% of total
2 Nights
5 listings
10.4% of total
3 Nights
2 listings
4.2% of total
4-6 Nights
9 listings
18.8% of total
7-29 Nights
8 listings
16.7% of total
30+ Nights
2 listings
4.2% of total
Key Insights
- The most prevalent minimum stay requirement in Son Verí is 1 Night, adopted by 45.8% of listings. This highlights the market's preference for shorter, flexible bookings.
Recommendations
- Align with the market by considering a 1 Night minimum stay, as 45.8% of Son Verí hosts use this setting.
- Adjust minimum nights based on seasonality – potentially shorter during low season and longer during peak demand periods in Son Verí.
Son Verí Airbnb Cancellation Policy Trends Analysis (2025)
Super Strict 30 Days
6 listings
13.6% of total
Flexible
3 listings
6.8% of total
Moderate
15 listings
34.1% of total
Firm
9 listings
20.5% of total
Strict
11 listings
25% of total
Cancellation Policy Insights for Son Verí
- The prevailing Airbnb cancellation policy trend in Son Verí is Moderate, used by 34.1% of listings.
- There's a relatively balanced mix between guest-friendly (40.9%) and stricter (45.5%) policies, offering choices for different guest needs.
Recommendations for Hosts
- Consider adopting a Moderate policy to align with the 34.1% market standard in Son Verí.
- Regularly review your cancellation policy against competitors and market demand shifts in Son Verí.
Son Verí STR Booking Lead Time Analysis (2025)
Average Booking Lead Time by Month
Booking Lead Time Insights for Son Verí
- The overall average booking lead time for vacation rentals in Son Verí is 60 days.
- Guests book furthest in advance for stays during July (average 103 days), likely coinciding with peak travel demand or local events.
- The shortest booking windows occur for stays in February (average 23 days), indicating more last-minute travel plans during this time.
- Seasonally, Summer (90 days avg.) sees the longest lead times, while Winter (59 days avg.) has the shortest, reflecting typical travel planning cycles.
Recommendations for Hosts
- Use the overall average lead time (60 days) as a baseline for your pricing and availability strategy in Son Verí.
- For July stays, consider implementing length-of-stay discounts or slightly higher rates for bookings made less than 103 days out to capitalize on advance planning.
- Target marketing efforts for the Summer season well in advance (at least 90 days) to capture early planners.
- Monitor your own booking lead times against these Son Verí averages to identify opportunities for dynamic pricing adjustments.
Popular & Essential Airbnb Amenities in Son Verí (2025)
Amenity Prevalence
Amenity Insights for Son Verí
- Essential amenities in Son Verí that guests expect include: Wifi. Lacking these (this) could significantly impact bookings.
- Popular amenities like Hair dryer, Essentials, Air conditioning are common but not universal. Offering these can provide a competitive edge.
Recommendations for Hosts
- Ensure your listing includes all essential amenities for Son Verí: Wifi.
- Prioritize adding missing essentials: Wifi.
- Consider adding popular differentiators like Hair dryer or Essentials to increase appeal.
- Highlight unique or less common amenities you offer (e.g., hot tub, dedicated workspace, EV charger) in your listing description and photos.
- Regularly check competitor amenities in Son Verí to stay competitive.
Son Verí Airbnb Guest Demographics & Profile Analysis (2025)
Guest Profile Summary for Son Verí
- The typical guest profile for Airbnb in Son Verí consists of predominantly international visitors (96%), with top international origins including United Kingdom, typically belonging to the Post-2000s (Gen Z/Alpha) group (50%), primarily speaking English or German.
- Domestic travelers account for 4.0% of guests.
- Key international markets include Germany (27.8%) and United Kingdom (16.3%).
- Top languages spoken are English (42%) followed by German (16.7%).
- A significant demographic segment is the Post-2000s (Gen Z/Alpha) group, representing 50% of guests.
Recommendations for Hosts
- Focus marketing internationally, particularly towards travelers from United Kingdom.
- Tailor amenities and listing descriptions to appeal to the dominant Post-2000s (Gen Z/Alpha) demographic (e.g., highlight fast WiFi, smart home features, local guides).
- Highlight unique local experiences or amenities relevant to the primary guest profile.
- Consider seasonal promotions aligned with peak travel times for key origin markets.
Nearby Short-Term Rental Market Comparison
How does the Son Verí Airbnb market stack up against its neighbors? Compare key performance metrics like average monthly revenue, ADR, and occupancy rates in surrounding areas to understand the broader regional STR landscape.
| Market | Active Properties | Monthly Revenue | Daily Rate | Avg. Occupancy |
|---|---|---|---|---|
| sa Carroca | 98 | $10,551 | $862.81 | 52% |
| Can Germà | 25 | $9,819 | $927.22 | 47% |
| Can Tomàs | 26 | $9,321 | $878.17 | 47% |
| Es Cubells | 31 | $8,883 | $1002.54 | 54% |
| Sant Rafel de sa Creu | 46 | $7,518 | $730.00 | 45% |
| Vista Mar | 64 | $7,047 | $750.94 | 46% |
| Algaida | 79 | $6,918 | $709.08 | 48% |
| Vista Alegre | 18 | $6,413 | $1214.28 | 42% |
| Mancor de la Vall | 35 | $6,389 | $620.29 | 54% |
| Sant Josep de sa Talaia | 256 | $6,308 | $699.24 | 48% |