Ses Rotes Velles Airbnb Market Analysis 2025: Short Term Rental Data & Vacation Rental Statistics in Balearic Islands, Spain
Is Airbnb profitable in Ses Rotes Velles in 2025? Explore comprehensive Airbnb analytics for Ses Rotes Velles, Balearic Islands, Spain to uncover income potential. This 2025 STR market report for Ses Rotes Velles, based on AirROI data from April 2024 to March 2025, reveals key trends in the niche market of 18 active listings.
Whether you're considering an Airbnb investment in Ses Rotes Velles, optimizing your existing vacation rental, or exploring rental arbitrage opportunities, understanding the Ses Rotes Velles Airbnb data is crucial. Understanding the local regulations is key to maximizing your short term rental income potential. Let's dive into the specifics.
Key Ses Rotes Velles Airbnb Performance Metrics Overview
Monthly Airbnb Revenue Variations & Income Potential in Ses Rotes Velles (2025)
Understanding the monthly revenue variations for Airbnb listings in Ses Rotes Velles is key to maximizing your short term rental income potential. Seasonality significantly impacts earnings. Our analysis, based on data from the past 12 months, shows that the peak revenue month for STRs in Ses Rotes Velles is typically August, while January often presents the lowest earnings, highlighting opportunities for strategic pricing adjustments during shoulder and low seasons. Explore the typical Airbnb income in Ses Rotes Velles across different performance tiers:
- Best-in-class properties (Top 10%) achieve $11,005+ monthly, often utilizing dynamic pricing and superior guest experiences.
- Strong performing properties (Top 25%) earn $4,898 or more, indicating effective management and desirable locations/amenities.
- Typical properties (Median) generate around $2,703 per month, representing the average market performance.
- Entry-level properties (Bottom 25%) see earnings around $1,487, often with potential for optimization.
Average Monthly Airbnb Earnings Trend in Ses Rotes Velles
Ses Rotes Velles Airbnb Occupancy Rate Trends (2025)
Maximize your bookings by understanding the Ses Rotes Velles STR occupancy trends. Seasonal demand shifts significantly influence how often properties are booked. Typically, Augustsees the highest demand (peak season occupancy), while November experiences the lowest (low season). Effective strategies, like adjusting minimum stays or offering promotions, can boost occupancy during slower periods. Here's how different property tiers perform in Ses Rotes Velles:
- Best-in-class properties (Top 10%) achieve 89%+ occupancy, indicating high desirability and potentially optimized availability.
- Strong performing properties (Top 25%) maintain 79% or higher occupancy, suggesting good market fit and guest satisfaction.
- Typical properties (Median) have an occupancy rate around 57%.
- Entry-level properties (Bottom 25%) average 29% occupancy, potentially facing higher vacancy.
Average Monthly Occupancy Rate Trend in Ses Rotes Velles
Average Daily Rate (ADR) Airbnb Trends in Ses Rotes Velles (2025)
Effective short term rental pricing strategy in Ses Rotes Velles involves understanding monthly ADR fluctuations. The Average Daily Rate (ADR) for Airbnb in Ses Rotes Velles typically peaks in December and dips lowest during April. Leveraging Airbnb dynamic pricing tools or strategies based on this seasonality can significantly boost revenue. Here's a look at the typical nightly rates achieved:
- Best-in-class properties (Top 10%) command rates of $450+ per night, often due to premium features or locations.
- Strong performing properties (Top 25%) achieve nightly rates of $302 or more.
- Typical properties (Median) charge around $126 per night.
- Entry-level properties (Bottom 25%) earn around $94 per night.
Average Daily Rate (ADR) Trend by Month in Ses Rotes Velles
Get Live Ses Rotes Velles Market Intelligence 👇

Explore Real-time Analytics
Airbnb Seasonality Analysis & Trends in Ses Rotes Velles (2025)
Peak Season (August, July, September)
- Revenue averages $7,333 per month
- Occupancy rates average 69.6%
- Daily rates average $204
Shoulder Season
- Revenue averages $3,730 per month
- Occupancy maintains around 55.4%
- Daily rates hold near $239
Low Season (January, February, December)
- Revenue drops to average $1,676 per month
- Occupancy decreases to average 42.9%
- Daily rates adjust to average $343
Seasonality Insights for Ses Rotes Velles
- The Airbnb seasonality in Ses Rotes Velles shows highly seasonal trends requiring careful strategy. While the sections above show seasonal averages, it's also insightful to look at the extremes:
- During the high season, the absolute peak month showcases Ses Rotes Velles's highest earning potential, with monthly revenues capable of climbing to $8,373, occupancy reaching a high of 72.9%, and ADRs peaking at $345.
- Conversely, the slowest single month of the year, typically falling within the low season, marks the market's lowest point. In this month, revenue might dip to $1,441, occupancy could drop to 41.3%, and ADRs may adjust down to $186.
- Understanding both the seasonal averages and these monthly peaks and troughs in revenue, occupancy, and ADR is crucial for maximizing your Airbnb profit potential in Ses Rotes Velles.
Seasonal Strategies for Maximizing Profit
- Peak Season: Maximize revenue through premium pricing and potentially longer minimum stays. Ensure high availability.
- Low Season: Offer competitive pricing, special promotions (e.g., extended stay discounts), and flexible cancellation policies. Target off-season travelers like remote workers or budget-conscious guests.
- Shoulder Seasons: Implement dynamic pricing that balances peak and low rates. Target weekend travelers or specific events. Offer slightly more flexible terms than peak season.
- Regularly analyze your own performance against these Ses Rotes Velles seasonality benchmarks and adjust your pricing and availability strategy accordingly.
Best Areas for Airbnb Investment in Ses Rotes Velles (2025)
Exploring the top neighborhoods for short-term rentals in Ses Rotes Velles? This section highlights key areas, outlining why they are attractive for hosts and guests, along with notable local attractions. Consider these locations based on your target guest profile and investment strategy.
| Neighborhood / Area | Why Host Here? (Target Guests & Appeal) | Key Attractions & Landmarks |
|---|---|---|
| Sant Antoni de Portmany | Popular tourist destination known for its vibrant nightlife and beautiful beaches. Attracts young travelers looking for beach clubs and nightlife options. | Café del Mar, Sunset Strip, Es Vedrà, Aquarium Cap Blanc, San Antonio's beaches |
| Ibiza Town | The historic capital of Ibiza, offering a mix of culture, history, and nightlife. A prime location for visitors interested in both heritage and entertainment. | Dalt Vila, Ibiza Castle, Marina Botafoch, Pacha Nightclub, Las Salinas Beach |
| Santa Eulària des Riu | Charming coastal town with a family-friendly atmosphere. It's less party-oriented and caters to families and couples seeking relaxation and local culture. | Santa Eulària Church, Las Dalias Hippy Market, Calas de Santa Eulària, Punta Arabí Hippy Market, S'Argamassa |
| San José (Sant Josep de sa Talaia) | Known for its stunning landscapes and traditional Ibiza charm. Great for those looking for a quieter, more authentic Ibiza experience away from the crowds. | Cala Jondal, Cala Tarida, Es Cubells, Cala d'Hort, Ses Salines National Park |
| Talamanca | A laid-back area close to Ibiza Town, offering a picturesque beach and tranquility while being just a short distance from nightlife. | Talamanca Beach, La Torre Ibiza, Pacha, Ibiza Marina, Restaurants and beach bars |
| Formentera | A small island known for its breathtaking beaches and natural beauty. Ideal for those looking to escape the party scene of Ibiza while still enjoying luxurious accommodations. | Playa de Ses Illetes, Cala Saona, Es Pujols, La Savina, Lighthouse of La Mola |
| Sant Joan de Labritja | Known for its beautiful rural settings and stunning coastline. Peaceful atmosphere attracting nature lovers and those looking to unwind. | Cala Xarraca, Sant Joan Church, Port de Sant Miquel, Natural Park of Ses Salines, Bamboo Ibiza |
| Es Canar | A quieter area popular with families, featuring beautiful beaches and a relaxed vibe. Great for long-term stays and vacations. | Hippie Market, Platja d'es Canar, Cala Nova Beach, Restaurants and beachfront bars, Parc Natural de ses Salines |
Understanding Airbnb License Requirements & STR Laws in Ses Rotes Velles (2025)
With 28% of listings showing registration in 2025, understanding potential Airbnb license requirements is crucial in Ses Rotes Velles. Always verify the latest short term rental regulations and Airbnb license requirements directly with local government authorities for Ses Rotes Velles to ensure full compliance before hosting.
(Source: AirROI data, 2025, based on 28% licensed listings)
Top Performing Airbnb Properties in Ses Rotes Velles (2025)
Benchmark your potential! Explore examples of top-performing Airbnb properties in Ses Rotes Vellesbased on Trailing Twelve Month (TTM) revenue. Analyze their characteristics, revenue, occupancy rate, and ADR to understand what drives success in this market.

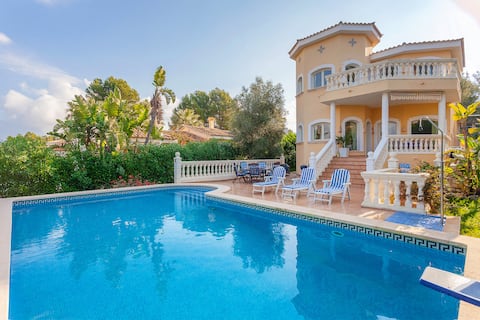
Sea View Villa Buena Vista in Santa Ponsa
Entire Place • 3 bedrooms
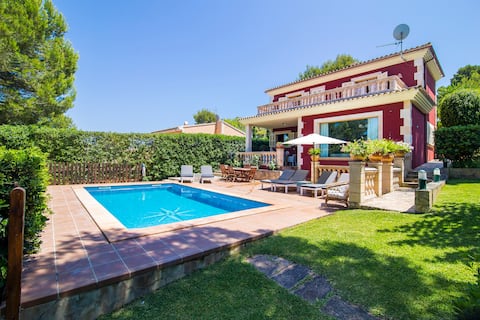
Villa Margarita
Entire Place • 3 bedrooms
5★ Luxury Mediterranean Villa, Santa Ponsa
Entire Place • 4 bedrooms
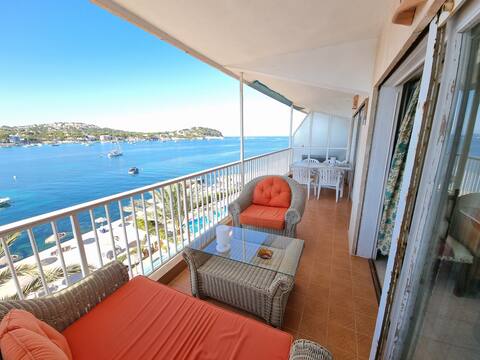
Santa Ponsa Great big apartament,front line, pool
Entire Place • 3 bedrooms
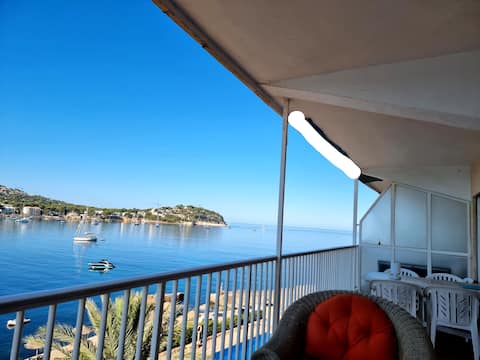
Apartament with marvellous views to the sea
Entire Place • 3 bedrooms
Villa Calmatzo in Santa Ponsa, Close to the Sea, Workation
Entire Place • 3 bedrooms
Note: Performance varies based on location, size, amenities, seasonality, and management quality. Data reflects the past 12 months.
Top Performing Airbnb Hosts in Ses Rotes Velles (2025)
Learn from the best! This table showcases top-performing Airbnb hosts in Ses Rotes Velles based on the number of properties managed and estimated total revenue over the past year. Analyze their scale and performance metrics.
| Host Name | Properties | Grossing Revenue | Stay Reviews | Avg Rating |
|---|---|---|---|---|
| Tatjana | 1 | $149,537 | 21 | 5.00/5.0 |
| Alex | 2 | $104,084 | 142 | 4.91/5.0 |
| Portic | 1 | $90,980 | 12 | 4.33/5.0 |
| Host #348805075 | 1 | $74,579 | 54 | 4.74/5.0 |
| Michelle Martine | 2 | $51,939 | 223 | 4.92/5.0 |
| Stefan | 1 | $44,870 | 3 | 5.00/5.0 |
| Pedro | 1 | $32,430 | 26 | 4.92/5.0 |
| Zeger | 1 | $29,404 | 20 | 5.00/5.0 |
| Alex | 1 | $22,342 | 330 | 4.69/5.0 |
| AnaBel | 1 | $20,380 | 160 | 4.69/5.0 |
Analyzing the strategies of top hosts, such as their property selection, pricing, and guest communication, can offer valuable lessons for optimizing your own Airbnb operations in Ses Rotes Velles.
Dive Deeper: Advanced Ses Rotes Velles STR Market Data (2025)
Ready to unlock more insights? AirROI provides access to advanced metrics and comprehensive Airbnb data for Ses Rotes Velles. Explore detailed analytics beyond this report to refine your investment strategy, optimize pricing, and maximize your vacation rental profits.
Explore Advanced MetricsSes Rotes Velles Short-Term Rental Market Composition (2025): Property & Room Types
Room Type Distribution
Property Type Distribution
Market Composition Insights for Ses Rotes Velles
- The Ses Rotes Velles Airbnb market composition is heavily skewed towards Entire Home/Apt listings, which make up 94.4% of the 18 active rentals. This indicates strong guest preference for privacy and space.
- Looking at the property type distribution in Ses Rotes Velles, Apartment/Condo properties are the most common (55.6%), reflecting the local real estate landscape.
- Houses represent a significant 44.4% portion, catering likely to families or larger groups.
Ses Rotes Velles Airbnb Room Capacity Analysis (2025): Bedroom Distribution
Distribution of Listings by Number of Bedrooms
Room Capacity Insights for Ses Rotes Velles
- The dominant room capacity in Ses Rotes Velles is 3 bedrooms listings, making up 38.9% of the market. This suggests a strong demand for properties suitable for families or small groups.
- Together, 3 bedrooms and 1 bedroom properties represent 77.8% of the active Airbnb listings in Ses Rotes Velles, indicating a high concentration in these sizes.
- A significant 50.0% of listings offer 3+ bedrooms, catering to larger groups and families seeking more space in Ses Rotes Velles.
Ses Rotes Velles Vacation Rental Guest Capacity Trends (2025)
Distribution of Listings by Guest Capacity
Guest Capacity Insights for Ses Rotes Velles
- The most common guest capacity trend in Ses Rotes Velles vacation rentals is listings accommodating 6 guests (33.3%). This suggests the primary traveler segment is likely larger groups.
- Properties designed for 6 guests and 3 guests dominate the Ses Rotes Velles STR market, accounting for 55.5% of listings.
- 50.0% of properties accommodate 6+ guests, serving the market segment for larger families or group travel in Ses Rotes Velles.
- On average, properties in Ses Rotes Velles are equipped to host 4.4 guests.
Ses Rotes Velles Airbnb Booking Patterns (2025): Available vs. Booked Days
Available Days Distribution
Booked Days Distribution
Booking Pattern Insights for Ses Rotes Velles
- The most common availability pattern in Ses Rotes Velles falls within the 181-270 days range, representing 38.9% of listings. This suggests many properties have significant open periods on their calendars.
- Approximately 66.7% of listings show high availability (181+ days open annually), indicating potential for increased bookings or specific owner usage patterns.
- For booked days, the 91-180 days range is most frequent in Ses Rotes Velles (38.9%), reflecting common guest stay durations or potential owner blocking patterns.
- A notable 33.3% of properties secure long booking periods (181+ days booked per year), highlighting successful long-term rental strategies or significant owner usage.
Ses Rotes Velles Airbnb Minimum Stay Requirements Analysis
Distribution of Listings by Minimum Night Requirement
2 Nights
3 listings
18.8% of total
3 Nights
1 listings
6.3% of total
4-6 Nights
6 listings
37.5% of total
7-29 Nights
3 listings
18.8% of total
30+ Nights
3 listings
18.8% of total
Key Insights
- The most prevalent minimum stay requirement in Ses Rotes Velles is 4-6 Nights, adopted by 37.5% of listings. This highlights the market's preference for longer commitments.
- Very short stays (1-2 nights) are less common (18.8%), suggesting hosts prefer slightly longer bookings to optimize turnover.
- A significant segment (18.8%) caters to monthly stays (30+ nights) in Ses Rotes Velles, pointing to opportunities in the extended-stay market.
Recommendations
- Align with the market by considering a 4-6 Nights minimum stay, as 37.5% of Ses Rotes Velles hosts use this setting.
- Explore offering discounts for stays of 30+ nights to attract the 18.8% of the market seeking extended stays.
- Adjust minimum nights based on seasonality – potentially shorter during low season and longer during peak demand periods in Ses Rotes Velles.
Ses Rotes Velles Airbnb Cancellation Policy Trends Analysis (2025)
Super Strict 30 Days
1 listings
6.7% of total
Flexible
1 listings
6.7% of total
Moderate
2 listings
13.3% of total
Firm
6 listings
40% of total
Strict
5 listings
33.3% of total
Cancellation Policy Insights for Ses Rotes Velles
- The prevailing Airbnb cancellation policy trend in Ses Rotes Velles is Firm, used by 40% of listings.
- A majority (73.3%) of hosts in Ses Rotes Velles utilize Firm or Strict policies, indicating a market where hosts prioritize booking security.
Recommendations for Hosts
- Consider adopting a Firm policy to align with the 40% market standard in Ses Rotes Velles.
- With 33.3% using Strict terms, this is a viable option in Ses Rotes Velles, particularly for high-value properties or during peak demand periods.
- Regularly review your cancellation policy against competitors and market demand shifts in Ses Rotes Velles.
Ses Rotes Velles STR Booking Lead Time Analysis (2025)
Average Booking Lead Time by Month
Booking Lead Time Insights for Ses Rotes Velles
- The overall average booking lead time for vacation rentals in Ses Rotes Velles is 97 days.
- Guests book furthest in advance for stays during August (average 146 days), likely coinciding with peak travel demand or local events.
- The shortest booking windows occur for stays in March (average 33 days), indicating more last-minute travel plans during this time.
- Seasonally, Summer (143 days avg.) sees the longest lead times, while Winter (40 days avg.) has the shortest, reflecting typical travel planning cycles.
Recommendations for Hosts
- Use the overall average lead time (97 days) as a baseline for your pricing and availability strategy in Ses Rotes Velles.
- For August stays, consider implementing length-of-stay discounts or slightly higher rates for bookings made less than 146 days out to capitalize on advance planning.
- Target marketing efforts for the Summer season well in advance (at least 143 days) to capture early planners.
- Monitor your own booking lead times against these Ses Rotes Velles averages to identify opportunities for dynamic pricing adjustments.
Popular & Essential Airbnb Amenities in Ses Rotes Velles (2025)
Amenity Prevalence
Amenity Insights for Ses Rotes Velles
- Essential amenities in Ses Rotes Velles that guests expect include: Wifi, Kitchen. Lacking these (any) could significantly impact bookings.
- Popular amenities like Microwave, Refrigerator, Dishes and silverware are common but not universal. Offering these can provide a competitive edge.
Recommendations for Hosts
- Ensure your listing includes all essential amenities for Ses Rotes Velles: Wifi, Kitchen.
- Consider adding popular differentiators like Microwave or Refrigerator to increase appeal.
- Highlight unique or less common amenities you offer (e.g., hot tub, dedicated workspace, EV charger) in your listing description and photos.
- Regularly check competitor amenities in Ses Rotes Velles to stay competitive.
Ses Rotes Velles Airbnb Guest Demographics & Profile Analysis (2025)
Guest Profile Summary for Ses Rotes Velles
- The typical guest profile for Airbnb in Ses Rotes Velles consists of predominantly international visitors (93%), with top international origins including Germany, typically belonging to the Post-2000s (Gen Z/Alpha) group (50%), primarily speaking English or Spanish.
- Domestic travelers account for 7.5% of guests.
- Key international markets include United Kingdom (20.6%) and Germany (17.8%).
- Top languages spoken are English (40.5%) followed by Spanish (11.7%).
- A significant demographic segment is the Post-2000s (Gen Z/Alpha) group, representing 50% of guests.
Recommendations for Hosts
- Focus marketing internationally, particularly towards travelers from Germany.
- Tailor amenities and listing descriptions to appeal to the dominant Post-2000s (Gen Z/Alpha) demographic (e.g., highlight fast WiFi, smart home features, local guides).
- Highlight unique local experiences or amenities relevant to the primary guest profile.
- Consider seasonal promotions aligned with peak travel times for key origin markets.
Nearby Short-Term Rental Market Comparison
How does the Ses Rotes Velles Airbnb market stack up against its neighbors? Compare key performance metrics like average monthly revenue, ADR, and occupancy rates in surrounding areas to understand the broader regional STR landscape.
| Market | Active Properties | Monthly Revenue | Daily Rate | Avg. Occupancy |
|---|---|---|---|---|
| sa Carroca | 98 | $10,551 | $862.81 | 52% |
| Can Germà | 25 | $9,819 | $927.22 | 47% |
| Can Tomàs | 26 | $9,321 | $878.17 | 47% |
| Es Cubells | 31 | $8,883 | $1002.54 | 54% |
| Sant Rafel de sa Creu | 46 | $7,518 | $730.00 | 45% |
| Vista Mar | 64 | $7,047 | $750.94 | 46% |
| Algaida | 79 | $6,918 | $709.08 | 48% |
| Vista Alegre | 18 | $6,413 | $1214.28 | 42% |
| Mancor de la Vall | 35 | $6,389 | $620.29 | 54% |
| Sant Josep de sa Talaia | 256 | $6,308 | $699.24 | 48% |