Sencelles Airbnb Market Analysis 2025: Short Term Rental Data & Vacation Rental Statistics in Balearic Islands, Spain
Is Airbnb profitable in Sencelles in 2025? Explore comprehensive Airbnb analytics for Sencelles, Balearic Islands, Spain to uncover income potential. This 2025 STR market report for Sencelles, based on AirROI data from April 2024 to March 2025, reveals key trends in the niche market of 76 active listings.
Whether you're considering an Airbnb investment in Sencelles, optimizing your existing vacation rental, or exploring rental arbitrage opportunities, understanding the Sencelles Airbnb data is crucial. Navigating the high regulation landscape is key to maximizing your short term rental income potential. Let's dive into the specifics.
Key Sencelles Airbnb Performance Metrics Overview
Monthly Airbnb Revenue Variations & Income Potential in Sencelles (2025)
Understanding the monthly revenue variations for Airbnb listings in Sencelles is key to maximizing your short term rental income potential. Seasonality significantly impacts earnings. Our analysis, based on data from the past 12 months, shows that the peak revenue month for STRs in Sencelles is typically August, while February often presents the lowest earnings, highlighting opportunities for strategic pricing adjustments during shoulder and low seasons. Explore the typical Airbnb income in Sencelles across different performance tiers:
- Best-in-class properties (Top 10%) achieve $14,807+ monthly, often utilizing dynamic pricing and superior guest experiences.
- Strong performing properties (Top 25%) earn $8,164 or more, indicating effective management and desirable locations/amenities.
- Typical properties (Median) generate around $4,080 per month, representing the average market performance.
- Entry-level properties (Bottom 25%) see earnings around $1,737, often with potential for optimization.
Average Monthly Airbnb Earnings Trend in Sencelles
Sencelles Airbnb Occupancy Rate Trends (2025)
Maximize your bookings by understanding the Sencelles STR occupancy trends. Seasonal demand shifts significantly influence how often properties are booked. Typically, Augustsees the highest demand (peak season occupancy), while March experiences the lowest (low season). Effective strategies, like adjusting minimum stays or offering promotions, can boost occupancy during slower periods. Here's how different property tiers perform in Sencelles:
- Best-in-class properties (Top 10%) achieve 85%+ occupancy, indicating high desirability and potentially optimized availability.
- Strong performing properties (Top 25%) maintain 65% or higher occupancy, suggesting good market fit and guest satisfaction.
- Typical properties (Median) have an occupancy rate around 43%.
- Entry-level properties (Bottom 25%) average 18% occupancy, potentially facing higher vacancy.
Average Monthly Occupancy Rate Trend in Sencelles
Average Daily Rate (ADR) Airbnb Trends in Sencelles (2025)
Effective short term rental pricing strategy in Sencelles involves understanding monthly ADR fluctuations. The Average Daily Rate (ADR) for Airbnb in Sencelles typically peaks in July and dips lowest during February. Leveraging Airbnb dynamic pricing tools or strategies based on this seasonality can significantly boost revenue. Here's a look at the typical nightly rates achieved:
- Best-in-class properties (Top 10%) command rates of $1,435+ per night, often due to premium features or locations.
- Strong performing properties (Top 25%) achieve nightly rates of $602 or more.
- Typical properties (Median) charge around $308 per night.
- Entry-level properties (Bottom 25%) earn around $185 per night.
Average Daily Rate (ADR) Trend by Month in Sencelles
Get Live Sencelles Market Intelligence 👇

Explore Real-time Analytics
Airbnb Seasonality Analysis & Trends in Sencelles (2025)
Peak Season (August, July, June)
- Revenue averages $10,638 per month
- Occupancy rates average 59.3%
- Daily rates average $655
Shoulder Season
- Revenue averages $6,129 per month
- Occupancy maintains around 43.0%
- Daily rates hold near $574
Low Season (February, March, November)
- Revenue drops to average $3,269 per month
- Occupancy decreases to average 30.4%
- Daily rates adjust to average $512
Seasonality Insights for Sencelles
- The Airbnb seasonality in Sencelles shows highly seasonal trends requiring careful strategy. While the sections above show seasonal averages, it's also insightful to look at the extremes:
- During the high season, the absolute peak month showcases Sencelles's highest earning potential, with monthly revenues capable of climbing to $11,406, occupancy reaching a high of 68.4%, and ADRs peaking at $661.
- Conversely, the slowest single month of the year, typically falling within the low season, marks the market's lowest point. In this month, revenue might dip to $2,938, occupancy could drop to 24.8%, and ADRs may adjust down to $499.
- Understanding both the seasonal averages and these monthly peaks and troughs in revenue, occupancy, and ADR is crucial for maximizing your Airbnb profit potential in Sencelles.
Seasonal Strategies for Maximizing Profit
- Peak Season: Maximize revenue through premium pricing and potentially longer minimum stays. Ensure high availability.
- Low Season: Offer competitive pricing, special promotions (e.g., extended stay discounts), and flexible cancellation policies. Target off-season travelers like remote workers or budget-conscious guests.
- Shoulder Seasons: Implement dynamic pricing that balances peak and low rates. Target weekend travelers or specific events. Offer slightly more flexible terms than peak season.
- Regularly analyze your own performance against these Sencelles seasonality benchmarks and adjust your pricing and availability strategy accordingly.
Best Areas for Airbnb Investment in Sencelles (2025)
Exploring the top neighborhoods for short-term rentals in Sencelles? This section highlights key areas, outlining why they are attractive for hosts and guests, along with notable local attractions. Consider these locations based on your target guest profile and investment strategy.
| Neighborhood / Area | Why Host Here? (Target Guests & Appeal) | Key Attractions & Landmarks |
|---|---|---|
| Sencelles Town Center | The heart of Sencelles, offering a blend of local culture, traditional architecture, and a community feel. It's an ideal spot for guests wanting an authentic Balearic experience away from the tourist crowds. | Iglesia de Sant Pere, Cultural events, Local markets, Town squares, Artisan shops |
| Es Figueral | A serene countryside area perfect for those looking to escape the hustle and bustle. It attracts nature lovers and those seeking relaxation with beautiful landscapes and local wildlife. | Nature trails, Vineyards, Scenic viewpoints, Traditional farms |
| Son Roig | Popular among families and groups looking for spacious accommodations. Offers a peaceful setting with the convenience of nearby amenities and attractions. | Family-friendly parks, Local restaurants, Cycling routes |
| Sencelles Vineyards | Known for its lush vineyards and wine production, this area is great for wine enthusiasts and offers a rural charm that draws tourists interested in Balearic wines and gastronomy. | Vineyard tours, Wine tasting events, Local gastronomy experiences |
| Selva | Close to Sencelles and surrounded by stunning mountain views, it provides a tranquil getaway with options for hiking and outdoor activities. | Serra de Tramuntana, Hiking trails, Local wildlife, Scenic landscapes |
| Santa Eugenia | Rich in agricultural tradition and close to local farms. Ideal for guests wanting to experience the rural Balearic lifestyle and taste local produce. | Local farms, Farmers markets, Agricultural tours |
| Algaida | Situated not far from Sencelles, Algaida offers a peaceful village life with beautiful scenery, making it perfect for guests looking for a traditional Balearic stay. | Historic buildings, Cultural heritage, Local festivities |
| Consell | A charming town with access to local markets and traditional crafts, attracting those looking for a genuine experience of Balearic Island life. | Weekly markets, Handicraft shops, Cultural festivals |
Understanding Airbnb License Requirements & STR Laws in Sencelles (2025)
Yes, Sencelles, Balearic Islands, Spain enforces high STR regulations. Obtaining a license and ensuring compliance is almost certainly required according to current 2025 STR laws. Always verify the latest short term rental regulations and Airbnb license requirements directly with local government authorities for Sencelles to ensure full compliance before hosting.
(Source: AirROI data, 2025, based on 62% licensed listings)
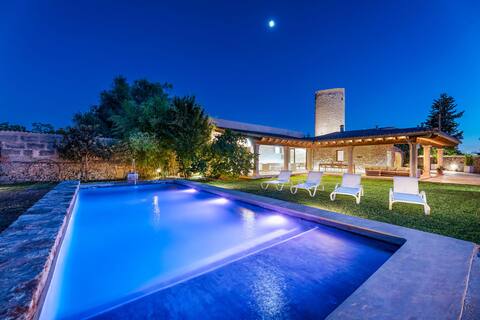
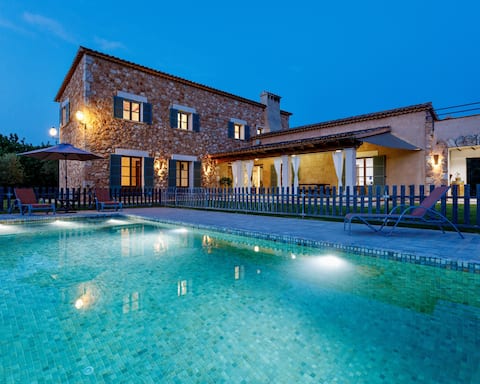
Top Performing Airbnb Properties in Sencelles (2025)
Benchmark your potential! Explore examples of top-performing Airbnb properties in Sencellesbased on Trailing Twelve Month (TTM) revenue. Analyze their characteristics, revenue, occupancy rate, and ADR to understand what drives success in this market.
Can Estela
Entire Place • 4 bedrooms
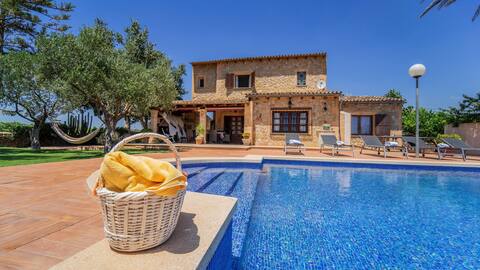
Vinyes Can Grau
Entire Place • 3 bedrooms
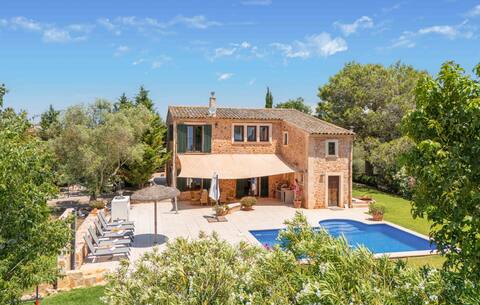
Finca Kiana
Entire Place • 4 bedrooms
Cas Cushion Jacuzzi, gym & pool
Entire Place • 3 bedrooms
Sa Teulera de Sencelles
Entire Place • 5 bedrooms
SPECTACULAR VILLA DOROTEA
Entire Place • 8 bedrooms
Note: Performance varies based on location, size, amenities, seasonality, and management quality. Data reflects the past 12 months.
Top Performing Airbnb Hosts in Sencelles (2025)
Learn from the best! This table showcases top-performing Airbnb hosts in Sencelles based on the number of properties managed and estimated total revenue over the past year. Analyze their scale and performance metrics.
| Host Name | Properties | Grossing Revenue | Stay Reviews | Avg Rating |
|---|---|---|---|---|
| Homerti | 8 | $477,033 | 125 | 4.71/5.0 |
| Holidu | 1 | $366,184 | 24 | 4.96/5.0 |
| Holidu | 1 | $279,136 | 33 | 5.00/5.0 |
| Holidu | 2 | $203,656 | 31 | 4.98/5.0 |
| Holidu | 1 | $188,809 | 15 | 4.93/5.0 |
| Joana Maria | 1 | $167,967 | 20 | 5.00/5.0 |
| Mar | 3 | $161,595 | 154 | 4.75/5.0 |
| Holidu | 1 | $129,145 | 7 | 5.00/5.0 |
| Guillermo | 1 | $128,704 | 130 | 4.70/5.0 |
| Host #469211146 | 1 | $120,247 | 2 | 0.00/5.0 |
Analyzing the strategies of top hosts, such as their property selection, pricing, and guest communication, can offer valuable lessons for optimizing your own Airbnb operations in Sencelles.
Dive Deeper: Advanced Sencelles STR Market Data (2025)
Ready to unlock more insights? AirROI provides access to advanced metrics and comprehensive Airbnb data for Sencelles. Explore detailed analytics beyond this report to refine your investment strategy, optimize pricing, and maximize your vacation rental profits.
Explore Advanced MetricsSencelles Short-Term Rental Market Composition (2025): Property & Room Types
Room Type Distribution
Property Type Distribution
Market Composition Insights for Sencelles
- The Sencelles Airbnb market composition is heavily skewed towards Entire Home/Apt listings, which make up 98.7% of the 76 active rentals. This indicates strong guest preference for privacy and space.
- Looking at the property type distribution in Sencelles, House properties are the most common (84.2%), reflecting the local real estate landscape.
- Houses represent a significant 84.2% portion, catering likely to families or larger groups.
- Smaller segments like hotel/boutique (combined 3.9%) offer potential for unique stay experiences.
Sencelles Airbnb Room Capacity Analysis (2025): Bedroom Distribution
Distribution of Listings by Number of Bedrooms
Room Capacity Insights for Sencelles
- The dominant room capacity in Sencelles is 3 bedrooms listings, making up 31.6% of the market. This suggests a strong demand for properties suitable for families or small groups.
- Together, 3 bedrooms and 2 bedrooms properties represent 55.3% of the active Airbnb listings in Sencelles, indicating a high concentration in these sizes.
- A significant 64.5% of listings offer 3+ bedrooms, catering to larger groups and families seeking more space in Sencelles.
Sencelles Vacation Rental Guest Capacity Trends (2025)
Distribution of Listings by Guest Capacity
Guest Capacity Insights for Sencelles
- The most common guest capacity trend in Sencelles vacation rentals is listings accommodating 8+ guests (32.9%). This suggests the primary traveler segment is likely larger groups.
- Properties designed for 8+ guests and 6 guests dominate the Sencelles STR market, accounting for 57.9% of listings.
- 57.9% of properties accommodate 6+ guests, serving the market segment for larger families or group travel in Sencelles.
- On average, properties in Sencelles are equipped to host 5.7 guests.
Sencelles Airbnb Booking Patterns (2025): Available vs. Booked Days
Available Days Distribution
Booked Days Distribution
Booking Pattern Insights for Sencelles
- The most common availability pattern in Sencelles falls within the 271-366 days range, representing 42.1% of listings. This suggests many properties have significant open periods on their calendars.
- Approximately 78.9% of listings show high availability (181+ days open annually), indicating potential for increased bookings or specific owner usage patterns.
- For booked days, the 91-180 days range is most frequent in Sencelles (36.8%), reflecting common guest stay durations or potential owner blocking patterns.
- A notable 22.3% of properties secure long booking periods (181+ days booked per year), highlighting successful long-term rental strategies or significant owner usage.
Sencelles Airbnb Minimum Stay Requirements Analysis
Distribution of Listings by Minimum Night Requirement
1 Night
17 listings
23.9% of total
2 Nights
3 listings
4.2% of total
3 Nights
6 listings
8.5% of total
4-6 Nights
22 listings
31% of total
7-29 Nights
13 listings
18.3% of total
30+ Nights
10 listings
14.1% of total
Key Insights
- The most prevalent minimum stay requirement in Sencelles is 4-6 Nights, adopted by 31% of listings. This highlights the market's preference for longer commitments.
- A significant segment (14.1%) caters to monthly stays (30+ nights) in Sencelles, pointing to opportunities in the extended-stay market.
Recommendations
- Align with the market by considering a 4-6 Nights minimum stay, as 31% of Sencelles hosts use this setting.
- If feasible, allowing 1-night stays, especially midweek or during low season, could capture last-minute bookings, as only 23.9% currently do.
- Explore offering discounts for stays of 30+ nights to attract the 14.1% of the market seeking extended stays.
- Adjust minimum nights based on seasonality – potentially shorter during low season and longer during peak demand periods in Sencelles.
Sencelles Airbnb Cancellation Policy Trends Analysis (2025)
Super Strict 30 Days
2 listings
3.1% of total
Super Strict 60 Days
4 listings
6.3% of total
Flexible
2 listings
3.1% of total
Moderate
5 listings
7.8% of total
Firm
33 listings
51.6% of total
Strict
18 listings
28.1% of total
Cancellation Policy Insights for Sencelles
- The prevailing Airbnb cancellation policy trend in Sencelles is Firm, used by 51.6% of listings.
- A majority (79.7%) of hosts in Sencelles utilize Firm or Strict policies, indicating a market where hosts prioritize booking security.
Recommendations for Hosts
- Consider adopting a Firm policy to align with the 51.6% market standard in Sencelles.
- Regularly review your cancellation policy against competitors and market demand shifts in Sencelles.
Sencelles STR Booking Lead Time Analysis (2025)
Average Booking Lead Time by Month
Booking Lead Time Insights for Sencelles
- The overall average booking lead time for vacation rentals in Sencelles is 86 days.
- Guests book furthest in advance for stays during July (average 125 days), likely coinciding with peak travel demand or local events.
- The shortest booking windows occur for stays in February (average 42 days), indicating more last-minute travel plans during this time.
- Seasonally, Summer (104 days avg.) sees the longest lead times, while Winter (48 days avg.) has the shortest, reflecting typical travel planning cycles.
Recommendations for Hosts
- Use the overall average lead time (86 days) as a baseline for your pricing and availability strategy in Sencelles.
- For July stays, consider implementing length-of-stay discounts or slightly higher rates for bookings made less than 125 days out to capitalize on advance planning.
- Target marketing efforts for the Summer season well in advance (at least 104 days) to capture early planners.
- Monitor your own booking lead times against these Sencelles averages to identify opportunities for dynamic pricing adjustments.
Popular & Essential Airbnb Amenities in Sencelles (2025)
Amenity Prevalence
Amenity Insights for Sencelles
- Essential amenities in Sencelles that guests expect include: Kitchen, Wifi, Washer. Lacking these (any) could significantly impact bookings.
- Popular amenities like TV, Essentials, Coffee maker are common but not universal. Offering these can provide a competitive edge.
Recommendations for Hosts
- Ensure your listing includes all essential amenities for Sencelles: Kitchen, Wifi, Washer.
- Prioritize adding missing essentials: Wifi, Washer.
- Consider adding popular differentiators like TV or Essentials to increase appeal.
- Highlight unique or less common amenities you offer (e.g., hot tub, dedicated workspace, EV charger) in your listing description and photos.
- Regularly check competitor amenities in Sencelles to stay competitive.
Sencelles Airbnb Guest Demographics & Profile Analysis (2025)
Guest Profile Summary for Sencelles
- The typical guest profile for Airbnb in Sencelles consists of predominantly international visitors (87%), with top international origins including France, typically belonging to the Post-2000s (Gen Z/Alpha) group (50%), primarily speaking English or German.
- Domestic travelers account for 12.9% of guests.
- Key international markets include Germany (28.5%) and France (17.3%).
- Top languages spoken are English (39.8%) followed by German (18.1%).
- A significant demographic segment is the Post-2000s (Gen Z/Alpha) group, representing 50% of guests.
Recommendations for Hosts
- Focus marketing internationally, particularly towards travelers from France.
- Tailor amenities and listing descriptions to appeal to the dominant Post-2000s (Gen Z/Alpha) demographic (e.g., highlight fast WiFi, smart home features, local guides).
- Highlight unique local experiences or amenities relevant to the primary guest profile.
- Consider seasonal promotions aligned with peak travel times for key origin markets.
Nearby Short-Term Rental Market Comparison
How does the Sencelles Airbnb market stack up against its neighbors? Compare key performance metrics like average monthly revenue, ADR, and occupancy rates in surrounding areas to understand the broader regional STR landscape.
| Market | Active Properties | Monthly Revenue | Daily Rate | Avg. Occupancy |
|---|---|---|---|---|
| sa Carroca | 98 | $10,551 | $862.81 | 52% |
| Can Germà | 25 | $9,819 | $927.22 | 47% |
| Can Tomàs | 26 | $9,321 | $878.17 | 47% |
| Es Cubells | 31 | $8,883 | $1002.54 | 54% |
| Sant Rafel de sa Creu | 46 | $7,518 | $730.00 | 45% |
| Vista Mar | 64 | $7,047 | $750.94 | 46% |
| Algaida | 79 | $6,918 | $709.08 | 48% |
| Vista Alegre | 18 | $6,413 | $1214.28 | 42% |
| Mancor de la Vall | 35 | $6,389 | $620.29 | 54% |
| Sant Josep de sa Talaia | 256 | $6,308 | $699.24 | 48% |