Selva Airbnb Market Analysis 2025: Short Term Rental Data & Vacation Rental Statistics in Balearic Islands, Spain
Is Airbnb profitable in Selva in 2025? Explore comprehensive Airbnb analytics for Selva, Balearic Islands, Spain to uncover income potential. This 2025 STR market report for Selva, based on AirROI data from April 2024 to March 2025, reveals key trends in the niche market of 158 active listings.
Whether you're considering an Airbnb investment in Selva, optimizing your existing vacation rental, or exploring rental arbitrage opportunities, understanding the Selva Airbnb data is crucial. Navigating the high regulation landscape is key to maximizing your short term rental income potential. Let's dive into the specifics.
Key Selva Airbnb Performance Metrics Overview
Monthly Airbnb Revenue Variations & Income Potential in Selva (2025)
Understanding the monthly revenue variations for Airbnb listings in Selva is key to maximizing your short term rental income potential. Seasonality significantly impacts earnings. Our analysis, based on data from the past 12 months, shows that the peak revenue month for STRs in Selva is typically July, while March often presents the lowest earnings, highlighting opportunities for strategic pricing adjustments during shoulder and low seasons. Explore the typical Airbnb income in Selva across different performance tiers:
- Best-in-class properties (Top 10%) achieve $12,570+ monthly, often utilizing dynamic pricing and superior guest experiences.
- Strong performing properties (Top 25%) earn $6,082 or more, indicating effective management and desirable locations/amenities.
- Typical properties (Median) generate around $3,417 per month, representing the average market performance.
- Entry-level properties (Bottom 25%) see earnings around $1,761, often with potential for optimization.
Average Monthly Airbnb Earnings Trend in Selva
Selva Airbnb Occupancy Rate Trends (2025)
Maximize your bookings by understanding the Selva STR occupancy trends. Seasonal demand shifts significantly influence how often properties are booked. Typically, Augustsees the highest demand (peak season occupancy), while January experiences the lowest (low season). Effective strategies, like adjusting minimum stays or offering promotions, can boost occupancy during slower periods. Here's how different property tiers perform in Selva:
- Best-in-class properties (Top 10%) achieve 78%+ occupancy, indicating high desirability and potentially optimized availability.
- Strong performing properties (Top 25%) maintain 65% or higher occupancy, suggesting good market fit and guest satisfaction.
- Typical properties (Median) have an occupancy rate around 47%.
- Entry-level properties (Bottom 25%) average 22% occupancy, potentially facing higher vacancy.
Average Monthly Occupancy Rate Trend in Selva
Average Daily Rate (ADR) Airbnb Trends in Selva (2025)
Effective short term rental pricing strategy in Selva involves understanding monthly ADR fluctuations. The Average Daily Rate (ADR) for Airbnb in Selva typically peaks in August and dips lowest during April. Leveraging Airbnb dynamic pricing tools or strategies based on this seasonality can significantly boost revenue. Here's a look at the typical nightly rates achieved:
- Best-in-class properties (Top 10%) command rates of $933+ per night, often due to premium features or locations.
- Strong performing properties (Top 25%) achieve nightly rates of $433 or more.
- Typical properties (Median) charge around $268 per night.
- Entry-level properties (Bottom 25%) earn around $175 per night.
Average Daily Rate (ADR) Trend by Month in Selva
Get Live Selva Market Intelligence 👇

Explore Real-time Analytics
Airbnb Seasonality Analysis & Trends in Selva (2025)
Peak Season (July, August, June)
- Revenue averages $9,763 per month
- Occupancy rates average 62.4%
- Daily rates average $424
Shoulder Season
- Revenue averages $5,363 per month
- Occupancy maintains around 45.0%
- Daily rates hold near $390
Low Season (January, February, March)
- Revenue drops to average $2,777 per month
- Occupancy decreases to average 27.5%
- Daily rates adjust to average $403
Seasonality Insights for Selva
- The Airbnb seasonality in Selva shows highly seasonal trends requiring careful strategy. While the sections above show seasonal averages, it's also insightful to look at the extremes:
- During the high season, the absolute peak month showcases Selva's highest earning potential, with monthly revenues capable of climbing to $10,669, occupancy reaching a high of 67.4%, and ADRs peaking at $433.
- Conversely, the slowest single month of the year, typically falling within the low season, marks the market's lowest point. In this month, revenue might dip to $2,568, occupancy could drop to 22.8%, and ADRs may adjust down to $370.
- Understanding both the seasonal averages and these monthly peaks and troughs in revenue, occupancy, and ADR is crucial for maximizing your Airbnb profit potential in Selva.
Seasonal Strategies for Maximizing Profit
- Peak Season: Maximize revenue through premium pricing and potentially longer minimum stays. Ensure high availability.
- Low Season: Offer competitive pricing, special promotions (e.g., extended stay discounts), and flexible cancellation policies. Target off-season travelers like remote workers or budget-conscious guests.
- Shoulder Seasons: Implement dynamic pricing that balances peak and low rates. Target weekend travelers or specific events. Offer slightly more flexible terms than peak season.
- Regularly analyze your own performance against these Selva seasonality benchmarks and adjust your pricing and availability strategy accordingly.
Best Areas for Airbnb Investment in Selva (2025)
Exploring the top neighborhoods for short-term rentals in Selva? This section highlights key areas, outlining why they are attractive for hosts and guests, along with notable local attractions. Consider these locations based on your target guest profile and investment strategy.
| Neighborhood / Area | Why Host Here? (Target Guests & Appeal) | Key Attractions & Landmarks |
|---|---|---|
| Cala de Sant Vicenç | A stunning coastal area known for its crystal-clear waters and beautiful beaches. Attracts visitors looking for relaxation and nature, making it ideal for vacation rentals. | Cala Molins, Cala Clara, Natural Park of S'Albufera de Mallorca, Snorkeling spots, Hiking trails |
| Port de Pollença | A picturesque harbor town with a charming promenade, restaurants, and beautiful beaches. Perfect for families and couples seeking a laid-back vacation atmosphere. | Pine Walk, Formentor Beach, Pollensa Bay, Water sports, Local markets |
| Alcudia | Known for its historic old town and stunning beaches, Alcudia is popular with tourists looking for cultural experiences and outdoor activities. | Alcudia Old Town, Playa de Alcudia, Roman ruins, S'Albufera Natural Park, Water parks |
| Inca | Located in the heart of Mallorca, Inca is famous for its leather goods and local market. It's a great option for travelers seeking culture and local shopping experiences. | Inca Market, Leather workshops, Wine tasting tours, Local restaurants |
| Sóller | A charming town set in a scenic valley, known for its historic tram and beautiful scenery. Ideal for those wanting to explore nature and enjoy local cuisine. | Sóller Tram, Serra de Tramuntana, Botanical Garden, Church of Saint Bartomeu |
| Palma Nova | A vibrant resort area popular with families and beach-goers, offering a variety of amenities and entertainment options. | Palma Nova Beach, Water parks, Bingo Palace, Local nightlife |
| Santa Ponsa | A popular destination for tourists seeking a lively atmosphere with plenty of activities, restaurants, and nightlife. | Santa Ponsa Beach, Golf courses, Local shops, Lively bars |
| Magaluf | Famous for its bustling nightlife and entertainment options, attracting younger crowds looking for fun and excitement. | Magaluf Beach, Katmandu Park, Nightclubs, Water sports |
Understanding Airbnb License Requirements & STR Laws in Selva (2025)
Yes, Selva, Balearic Islands, Spain enforces high STR regulations. Obtaining a license and ensuring compliance is almost certainly required according to current 2025 STR laws. Always verify the latest short term rental regulations and Airbnb license requirements directly with local government authorities for Selva to ensure full compliance before hosting.
(Source: AirROI data, 2025, based on 68% licensed listings)
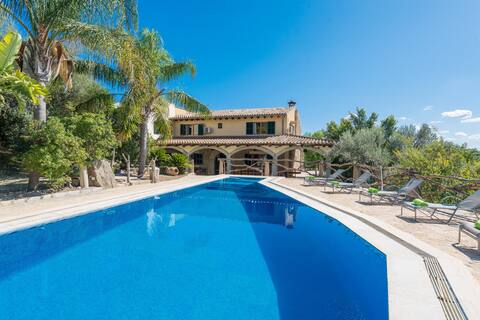
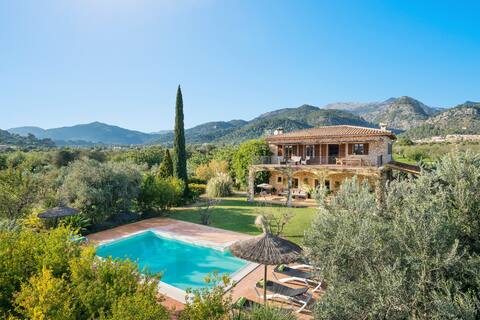
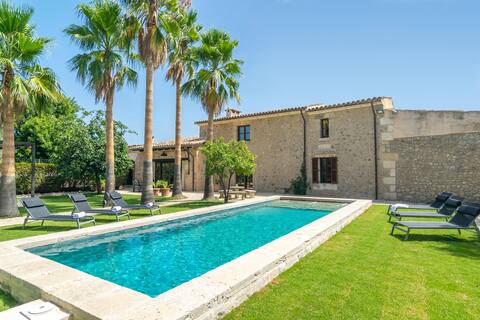
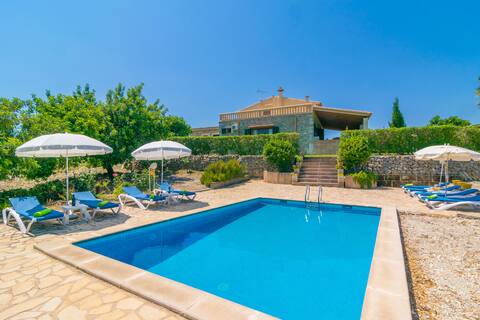
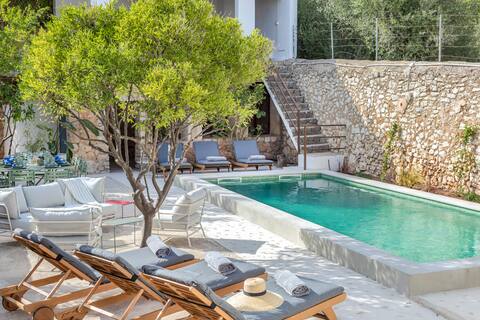
Top Performing Airbnb Properties in Selva (2025)
Benchmark your potential! Explore examples of top-performing Airbnb properties in Selvabased on Trailing Twelve Month (TTM) revenue. Analyze their characteristics, revenue, occupancy rate, and ADR to understand what drives success in this market.
Cas Carro (sa Teulera)
Entire Place • 6 bedrooms
Cas Colector
Entire Place • 4 bedrooms
S' hort Des CapellÀ Verona
Entire Place • 3 bedrooms
Cal Tio
Entire Place • 4 bedrooms
Cantabou Sa Coma D 'inca
Entire Place • 4 bedrooms
The Convent of Biniamar - Charm in the Tramontana
Entire Place • 6 bedrooms
Note: Performance varies based on location, size, amenities, seasonality, and management quality. Data reflects the past 12 months.
Top Performing Airbnb Hosts in Selva (2025)
Learn from the best! This table showcases top-performing Airbnb hosts in Selva based on the number of properties managed and estimated total revenue over the past year. Analyze their scale and performance metrics.
| Host Name | Properties | Grossing Revenue | Stay Reviews | Avg Rating |
|---|---|---|---|---|
| Homerti | 16 | $3,054,280 | 246 | 3.55/5.0 |
| Villafy Mallorca | 9 | $377,574 | 71 | 3.54/5.0 |
| Fernando | 1 | $219,238 | 44 | 4.98/5.0 |
| Sealand Villas | 2 | $189,658 | 27 | 4.71/5.0 |
| Foravila | 4 | $164,900 | 62 | 4.86/5.0 |
| House Mallorca | 2 | $147,339 | 19 | 2.34/5.0 |
| Antonia | 1 | $144,241 | 12 | 5.00/5.0 |
| Pascual | 4 | $142,113 | 181 | 4.92/5.0 |
| Holidu | 1 | $129,835 | 28 | 4.75/5.0 |
| Kirsten | 1 | $126,325 | 144 | 4.97/5.0 |
Analyzing the strategies of top hosts, such as their property selection, pricing, and guest communication, can offer valuable lessons for optimizing your own Airbnb operations in Selva.
Dive Deeper: Advanced Selva STR Market Data (2025)
Ready to unlock more insights? AirROI provides access to advanced metrics and comprehensive Airbnb data for Selva. Explore detailed analytics beyond this report to refine your investment strategy, optimize pricing, and maximize your vacation rental profits.
Explore Advanced MetricsSelva Short-Term Rental Market Composition (2025): Property & Room Types
Room Type Distribution
Property Type Distribution
Market Composition Insights for Selva
- The Selva Airbnb market composition is heavily skewed towards Entire Home/Apt listings, which make up 88.6% of the 158 active rentals. This indicates strong guest preference for privacy and space.
- Looking at the property type distribution in Selva, House properties are the most common (83.5%), reflecting the local real estate landscape.
- Houses represent a significant 83.5% portion, catering likely to families or larger groups.
- The presence of 9.5% Hotel/Boutique listings indicates integration with traditional hospitality.
- Smaller segments like others (combined 0.6%) offer potential for unique stay experiences.
Selva Airbnb Room Capacity Analysis (2025): Bedroom Distribution
Distribution of Listings by Number of Bedrooms
Room Capacity Insights for Selva
- The dominant room capacity in Selva is 3 bedrooms listings, making up 25.3% of the market. This suggests a strong demand for properties suitable for families or small groups.
- Together, 3 bedrooms and 4 bedrooms properties represent 48.7% of the active Airbnb listings in Selva, indicating a high concentration in these sizes.
- A significant 60.7% of listings offer 3+ bedrooms, catering to larger groups and families seeking more space in Selva.
Selva Vacation Rental Guest Capacity Trends (2025)
Distribution of Listings by Guest Capacity
Guest Capacity Insights for Selva
- The most common guest capacity trend in Selva vacation rentals is listings accommodating 8+ guests (31%). This suggests the primary traveler segment is likely larger groups.
- Properties designed for 8+ guests and 6 guests dominate the Selva STR market, accounting for 57.6% of listings.
- 60.8% of properties accommodate 6+ guests, serving the market segment for larger families or group travel in Selva.
- On average, properties in Selva are equipped to host 5.4 guests.
Selva Airbnb Booking Patterns (2025): Available vs. Booked Days
Available Days Distribution
Booked Days Distribution
Booking Pattern Insights for Selva
- The most common availability pattern in Selva falls within the 271-366 days range, representing 41.8% of listings. This suggests many properties have significant open periods on their calendars.
- Approximately 72.8% of listings show high availability (181+ days open annually), indicating potential for increased bookings or specific owner usage patterns.
- For booked days, the 181-270 days range is most frequent in Selva (28.5%), reflecting common guest stay durations or potential owner blocking patterns.
- A notable 31.7% of properties secure long booking periods (181+ days booked per year), highlighting successful long-term rental strategies or significant owner usage.
Selva Airbnb Minimum Stay Requirements Analysis
Distribution of Listings by Minimum Night Requirement
1 Night
47 listings
32.2% of total
2 Nights
5 listings
3.4% of total
3 Nights
9 listings
6.2% of total
4-6 Nights
50 listings
34.2% of total
7-29 Nights
14 listings
9.6% of total
30+ Nights
21 listings
14.4% of total
Key Insights
- The most prevalent minimum stay requirement in Selva is 4-6 Nights, adopted by 34.2% of listings. This highlights the market's preference for longer commitments.
- A significant segment (14.4%) caters to monthly stays (30+ nights) in Selva, pointing to opportunities in the extended-stay market.
Recommendations
- Align with the market by considering a 4-6 Nights minimum stay, as 34.2% of Selva hosts use this setting.
- Explore offering discounts for stays of 30+ nights to attract the 14.4% of the market seeking extended stays.
- Adjust minimum nights based on seasonality – potentially shorter during low season and longer during peak demand periods in Selva.
Selva Airbnb Cancellation Policy Trends Analysis (2025)
Super Strict 30 Days
5 listings
3.8% of total
Super Strict 60 Days
9 listings
6.9% of total
Flexible
9 listings
6.9% of total
Moderate
17 listings
13.1% of total
Firm
39 listings
30% of total
Strict
51 listings
39.2% of total
Cancellation Policy Insights for Selva
- The prevailing Airbnb cancellation policy trend in Selva is Strict, used by 39.2% of listings.
- A majority (69.2%) of hosts in Selva utilize Firm or Strict policies, indicating a market where hosts prioritize booking security.
Recommendations for Hosts
- Consider adopting a Strict policy to align with the 39.2% market standard in Selva.
- With 39.2% using Strict terms, this is a viable option in Selva, particularly for high-value properties or during peak demand periods.
- Regularly review your cancellation policy against competitors and market demand shifts in Selva.
Selva STR Booking Lead Time Analysis (2025)
Average Booking Lead Time by Month
Booking Lead Time Insights for Selva
- The overall average booking lead time for vacation rentals in Selva is 105 days.
- Guests book furthest in advance for stays during August (average 144 days), likely coinciding with peak travel demand or local events.
- The shortest booking windows occur for stays in February (average 48 days), indicating more last-minute travel plans during this time.
- Seasonally, Summer (136 days avg.) sees the longest lead times, while Winter (63 days avg.) has the shortest, reflecting typical travel planning cycles.
Recommendations for Hosts
- Use the overall average lead time (105 days) as a baseline for your pricing and availability strategy in Selva.
- For August stays, consider implementing length-of-stay discounts or slightly higher rates for bookings made less than 144 days out to capitalize on advance planning.
- Target marketing efforts for the Summer season well in advance (at least 136 days) to capture early planners.
- Monitor your own booking lead times against these Selva averages to identify opportunities for dynamic pricing adjustments.
Popular & Essential Airbnb Amenities in Selva (2025)
Amenity Prevalence
Amenity Insights for Selva
- Essential amenities in Selva that guests expect include: Wifi, TV. Lacking these (any) could significantly impact bookings.
- Popular amenities like Kitchen, Washer, Essentials are common but not universal. Offering these can provide a competitive edge.
Recommendations for Hosts
- Ensure your listing includes all essential amenities for Selva: Wifi, TV.
- Prioritize adding missing essentials: Wifi, TV.
- Consider adding popular differentiators like Kitchen or Washer to increase appeal.
- Highlight unique or less common amenities you offer (e.g., hot tub, dedicated workspace, EV charger) in your listing description and photos.
- Regularly check competitor amenities in Selva to stay competitive.
Selva Airbnb Guest Demographics & Profile Analysis (2025)
Guest Profile Summary for Selva
- The typical guest profile for Airbnb in Selva consists of predominantly international visitors (94%), with top international origins including United Kingdom, typically belonging to the Post-2000s (Gen Z/Alpha) group (50%), primarily speaking English or German.
- Domestic travelers account for 5.8% of guests.
- Key international markets include Germany (32.8%) and United Kingdom (14.5%).
- Top languages spoken are English (41.4%) followed by German (21.4%).
- A significant demographic segment is the Post-2000s (Gen Z/Alpha) group, representing 50% of guests.
Recommendations for Hosts
- Focus marketing internationally, particularly towards travelers from United Kingdom.
- Tailor amenities and listing descriptions to appeal to the dominant Post-2000s (Gen Z/Alpha) demographic (e.g., highlight fast WiFi, smart home features, local guides).
- Highlight unique local experiences or amenities relevant to the primary guest profile.
- Consider seasonal promotions aligned with peak travel times for key origin markets.
Nearby Short-Term Rental Market Comparison
How does the Selva Airbnb market stack up against its neighbors? Compare key performance metrics like average monthly revenue, ADR, and occupancy rates in surrounding areas to understand the broader regional STR landscape.
| Market | Active Properties | Monthly Revenue | Daily Rate | Avg. Occupancy |
|---|---|---|---|---|
| sa Carroca | 98 | $10,551 | $862.81 | 52% |
| Can Germà | 25 | $9,819 | $927.22 | 47% |
| Can Tomàs | 26 | $9,321 | $878.17 | 47% |
| Es Cubells | 31 | $8,883 | $1002.54 | 54% |
| Sant Rafel de sa Creu | 46 | $7,518 | $730.00 | 45% |
| Vista Mar | 64 | $7,047 | $750.94 | 46% |
| Algaida | 79 | $6,918 | $709.08 | 48% |
| Vista Alegre | 18 | $6,413 | $1214.28 | 42% |
| Mancor de la Vall | 35 | $6,389 | $620.29 | 54% |
| Sant Josep de sa Talaia | 256 | $6,308 | $699.24 | 48% |