sa Torre Airbnb Market Analysis 2025: Short Term Rental Data & Vacation Rental Statistics in Balearic Islands, Spain
Is Airbnb profitable in sa Torre in 2025? Explore comprehensive Airbnb analytics for sa Torre, Balearic Islands, Spain to uncover income potential. This 2025 STR market report for sa Torre, based on AirROI data from April 2024 to March 2025, reveals key trends in the niche market of 24 active listings.
Whether you're considering an Airbnb investment in sa Torre, optimizing your existing vacation rental, or exploring rental arbitrage opportunities, understanding the sa Torre Airbnb data is crucial. Understanding the local regulations is key to maximizing your short term rental income potential. Let's dive into the specifics.
Key sa Torre Airbnb Performance Metrics Overview
Monthly Airbnb Revenue Variations & Income Potential in sa Torre (2025)
Understanding the monthly revenue variations for Airbnb listings in sa Torre is key to maximizing your short term rental income potential. Seasonality significantly impacts earnings. Our analysis, based on data from the past 12 months, shows that the peak revenue month for STRs in sa Torre is typically July, while January often presents the lowest earnings, highlighting opportunities for strategic pricing adjustments during shoulder and low seasons. Explore the typical Airbnb income in sa Torre across different performance tiers:
- Best-in-class properties (Top 10%) achieve $11,835+ monthly, often utilizing dynamic pricing and superior guest experiences.
- Strong performing properties (Top 25%) earn $7,208 or more, indicating effective management and desirable locations/amenities.
- Typical properties (Median) generate around $3,098 per month, representing the average market performance.
- Entry-level properties (Bottom 25%) see earnings around $1,284, often with potential for optimization.
Average Monthly Airbnb Earnings Trend in sa Torre
sa Torre Airbnb Occupancy Rate Trends (2025)
Maximize your bookings by understanding the sa Torre STR occupancy trends. Seasonal demand shifts significantly influence how often properties are booked. Typically, Julysees the highest demand (peak season occupancy), while January experiences the lowest (low season). Effective strategies, like adjusting minimum stays or offering promotions, can boost occupancy during slower periods. Here's how different property tiers perform in sa Torre:
- Best-in-class properties (Top 10%) achieve 70%+ occupancy, indicating high desirability and potentially optimized availability.
- Strong performing properties (Top 25%) maintain 55% or higher occupancy, suggesting good market fit and guest satisfaction.
- Typical properties (Median) have an occupancy rate around 37%.
- Entry-level properties (Bottom 25%) average 15% occupancy, potentially facing higher vacancy.
Average Monthly Occupancy Rate Trend in sa Torre
Average Daily Rate (ADR) Airbnb Trends in sa Torre (2025)
Effective short term rental pricing strategy in sa Torre involves understanding monthly ADR fluctuations. The Average Daily Rate (ADR) for Airbnb in sa Torre typically peaks in July and dips lowest during January. Leveraging Airbnb dynamic pricing tools or strategies based on this seasonality can significantly boost revenue. Here's a look at the typical nightly rates achieved:
- Best-in-class properties (Top 10%) command rates of $1,061+ per night, often due to premium features or locations.
- Strong performing properties (Top 25%) achieve nightly rates of $641 or more.
- Typical properties (Median) charge around $359 per night.
- Entry-level properties (Bottom 25%) earn around $112 per night.
Average Daily Rate (ADR) Trend by Month in sa Torre
Get Live sa Torre Market Intelligence 👇

Explore Real-time Analytics
Airbnb Seasonality Analysis & Trends in sa Torre (2025)
Peak Season (July, August, June)
- Revenue averages $10,040 per month
- Occupancy rates average 60.9%
- Daily rates average $536
Shoulder Season
- Revenue averages $4,269 per month
- Occupancy maintains around 33.6%
- Daily rates hold near $498
Low Season (January, February, December)
- Revenue drops to average $715 per month
- Occupancy decreases to average 22.0%
- Daily rates adjust to average $452
Seasonality Insights for sa Torre
- The Airbnb seasonality in sa Torre shows highly seasonal trends requiring careful strategy. While the sections above show seasonal averages, it's also insightful to look at the extremes:
- During the high season, the absolute peak month showcases sa Torre's highest earning potential, with monthly revenues capable of climbing to $12,528, occupancy reaching a high of 73.0%, and ADRs peaking at $540.
- Conversely, the slowest single month of the year, typically falling within the low season, marks the market's lowest point. In this month, revenue might dip to $335, occupancy could drop to 11.1%, and ADRs may adjust down to $448.
- Understanding both the seasonal averages and these monthly peaks and troughs in revenue, occupancy, and ADR is crucial for maximizing your Airbnb profit potential in sa Torre.
Seasonal Strategies for Maximizing Profit
- Peak Season: Maximize revenue through premium pricing and potentially longer minimum stays. Ensure high availability.
- Low Season: Offer competitive pricing, special promotions (e.g., extended stay discounts), and flexible cancellation policies. Target off-season travelers like remote workers or budget-conscious guests.
- Shoulder Seasons: Implement dynamic pricing that balances peak and low rates. Target weekend travelers or specific events. Offer slightly more flexible terms than peak season.
- Regularly analyze your own performance against these sa Torre seasonality benchmarks and adjust your pricing and availability strategy accordingly.
Best Areas for Airbnb Investment in sa Torre (2025)
Exploring the top neighborhoods for short-term rentals in sa Torre? This section highlights key areas, outlining why they are attractive for hosts and guests, along with notable local attractions. Consider these locations based on your target guest profile and investment strategy.
| Neighborhood / Area | Why Host Here? (Target Guests & Appeal) | Key Attractions & Landmarks |
|---|---|---|
| Sa Torre | A charming residential area known for its tranquil atmosphere and proximity to stunning beaches. Ideal for families and couples looking for a peaceful getaway in the sun. | Beach access at nearby Playa de Palma, Sa Torre Castle, Cultural sites in Llucmajor, Proximity to golf courses like Son Gual, Nature walks in the surrounding countryside |
| Mallorca Beach | This area boasts some of the most beautiful beaches in Mallorca, attracting beach lovers and sunbathers year-round. A hotspot for summer tourism with plenty of amenities. | Playa de Palma, Water sports activities, Beach clubs and bars, Beach volleyball courts, Cycling routes along the coast |
| Camp de Mar | A picturesque location known for its calm waters and luxury resorts. Attracts tourists looking for a high-end vacation experience, perfect for upscale short-term rentals. | Camp de Mar beach, The famous Camp de Mar restaurant, Mediterranean hiking trails, Nearby golf courses |
| Palma de Mallorca | The vibrant capital of the Balearic Islands, known for its historic architecture, vibrant nightlife, and cultural attractions. A prime location for attracting a diverse range of visitors. | Palma Cathedral, Bellver Castle, Old Town historical sites, Shopping at Avinguda Jaume III, Exciting nightlife in Santa Catalina |
| Magaluf | A well-known tourist destination famed for its lively nightlife and entertainment options. Great for attracting young tourists looking for a party atmosphere. | Magaluf Beach, Parks and recreational activities, Close to the Western Water Park, Bars and nightclubs |
| Santa Ponsa | A family-friendly resort area offering a mix of relaxation and activities, with plenty of dining options. Popular among families and couples. | Santa Ponsa Beach, The Tree of Life park, Golf courses nearby, Water sports activities, Shopping areas |
| Porto Colom | A quaint coastal village known for its charming marina and laid-back vibe. Perfect for tourists looking for a more relaxed holiday experience. | Porto Colom Marina, Beaches and coves, Waterside restaurants, Hiking trails around the coast |
| Andratx | An upscale area that is popular among visitors for its beautiful scenery and luxurious homes. Ideal for hosting Airbnb with a focus on quality and exclusivity. | Andratx port, Nearby beaches, Art galleries, Boutique shops, Cultural festivals |
Understanding Airbnb License Requirements & STR Laws in sa Torre (2025)
With 29% of listings showing registration in 2025, understanding potential Airbnb license requirements is crucial in sa Torre. Always verify the latest short term rental regulations and Airbnb license requirements directly with local government authorities for sa Torre to ensure full compliance before hosting.
(Source: AirROI data, 2025, based on 29% licensed listings)
Top Performing Airbnb Properties in sa Torre (2025)
Benchmark your potential! Explore examples of top-performing Airbnb properties in sa Torrebased on Trailing Twelve Month (TTM) revenue. Analyze their characteristics, revenue, occupancy rate, and ADR to understand what drives success in this market.

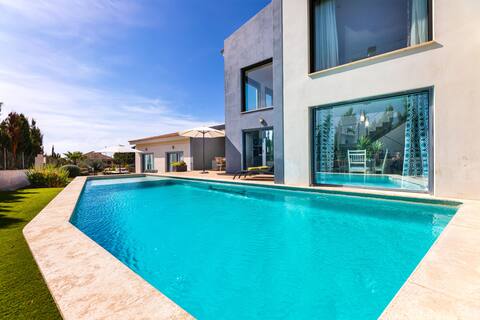
Gorgeous home in sa torre with private swimming
Entire Place • 5 bedrooms
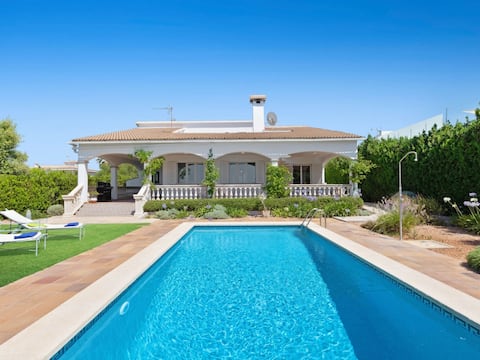
Villa La Primera
Entire Place • 3 bedrooms
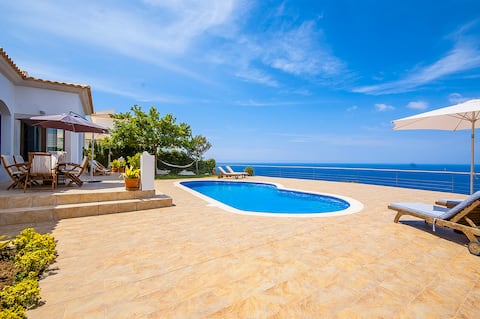
Villa Paraíso Perdido
Entire Place • 3 bedrooms

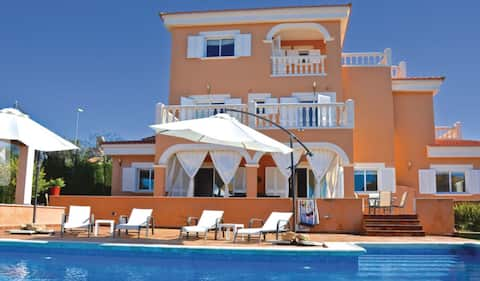
Villa Santa Catalina
Entire Place • 4 bedrooms
Villa Voramar
Entire Place • 4 bedrooms
Magnificent villa in Mallorca
Entire Place • 5 bedrooms
Note: Performance varies based on location, size, amenities, seasonality, and management quality. Data reflects the past 12 months.
Top Performing Airbnb Hosts in sa Torre (2025)
Learn from the best! This table showcases top-performing Airbnb hosts in sa Torre based on the number of properties managed and estimated total revenue over the past year. Analyze their scale and performance metrics.
| Host Name | Properties | Grossing Revenue | Stay Reviews | Avg Rating |
|---|---|---|---|---|
| Host #357235863 | 1 | $122,004 | 4 | 4.50/5.0 |
| Host #469211146 | 1 | $111,863 | 2 | 0.00/5.0 |
| Panchorentals . Es | 1 | $84,292 | 105 | 4.66/5.0 |
| Homerti | 2 | $83,881 | 18 | 2.39/5.0 |
| Host #570848723 | 1 | $73,018 | 0 | 0.00/5.0 |
| Host #568885399 | 1 | $62,894 | 0 | 0.00/5.0 |
| José & Carolina | 1 | $61,072 | 37 | 4.76/5.0 |
| Posima | 1 | $50,595 | 6 | 5.00/5.0 |
| Cristina | 1 | $48,461 | 15 | 4.87/5.0 |
| Mercedes | 1 | $43,600 | 62 | 4.63/5.0 |
Analyzing the strategies of top hosts, such as their property selection, pricing, and guest communication, can offer valuable lessons for optimizing your own Airbnb operations in sa Torre.
Dive Deeper: Advanced sa Torre STR Market Data (2025)
Ready to unlock more insights? AirROI provides access to advanced metrics and comprehensive Airbnb data for sa Torre. Explore detailed analytics beyond this report to refine your investment strategy, optimize pricing, and maximize your vacation rental profits.
Explore Advanced Metricssa Torre Short-Term Rental Market Composition (2025): Property & Room Types
Room Type Distribution
Property Type Distribution
Market Composition Insights for sa Torre
- The sa Torre Airbnb market composition is heavily skewed towards Entire Home/Apt listings, which make up 70.8% of the 24 active rentals. This indicates strong guest preference for privacy and space.
- Looking at the property type distribution in sa Torre, House properties are the most common (87.5%), reflecting the local real estate landscape.
- Houses represent a significant 87.5% portion, catering likely to families or larger groups.
- Smaller segments like outdoor/unique (combined 4.2%) offer potential for unique stay experiences.
sa Torre Airbnb Room Capacity Analysis (2025): Bedroom Distribution
Distribution of Listings by Number of Bedrooms
Room Capacity Insights for sa Torre
- The dominant room capacity in sa Torre is 4 bedrooms listings, making up 25% of the market. This suggests a strong demand for properties suitable for families or small groups.
- Together, 4 bedrooms and 3 bedrooms properties represent 41.7% of the active Airbnb listings in sa Torre, indicating a high concentration in these sizes.
- A significant 58.4% of listings offer 3+ bedrooms, catering to larger groups and families seeking more space in sa Torre.
sa Torre Vacation Rental Guest Capacity Trends (2025)
Distribution of Listings by Guest Capacity
Guest Capacity Insights for sa Torre
- The most common guest capacity trend in sa Torre vacation rentals is listings accommodating 8+ guests (25%). This suggests the primary traveler segment is likely larger groups.
- Properties designed for 8+ guests and 6 guests dominate the sa Torre STR market, accounting for 50.0% of listings.
- 54.2% of properties accommodate 6+ guests, serving the market segment for larger families or group travel in sa Torre.
- On average, properties in sa Torre are equipped to host 4.4 guests.
sa Torre Airbnb Booking Patterns (2025): Available vs. Booked Days
Available Days Distribution
Booked Days Distribution
Booking Pattern Insights for sa Torre
- The most common availability pattern in sa Torre falls within the 271-366 days range, representing 62.5% of listings. This suggests many properties have significant open periods on their calendars.
- Approximately 87.5% of listings show high availability (181+ days open annually), indicating potential for increased bookings or specific owner usage patterns.
- For booked days, the 31-90 days range is most frequent in sa Torre (33.3%), reflecting common guest stay durations or potential owner blocking patterns.
- A notable 12.5% of properties secure long booking periods (181+ days booked per year), highlighting successful long-term rental strategies or significant owner usage.
sa Torre Airbnb Minimum Stay Requirements Analysis
Distribution of Listings by Minimum Night Requirement
1 Night
11 listings
57.9% of total
2 Nights
1 listings
5.3% of total
4-6 Nights
4 listings
21.1% of total
7-29 Nights
1 listings
5.3% of total
30+ Nights
2 listings
10.5% of total
Key Insights
- The most prevalent minimum stay requirement in sa Torre is 1 Night, adopted by 57.9% of listings. This highlights the market's preference for shorter, flexible bookings.
- A strong majority (63.2%) of the sa Torre Airbnb data shows acceptance of very short stays (1-2 nights), indicating a dynamic, high-turnover market.
- A significant segment (10.5%) caters to monthly stays (30+ nights) in sa Torre, pointing to opportunities in the extended-stay market.
Recommendations
- Align with the market by considering a 1 Night minimum stay, as 57.9% of sa Torre hosts use this setting.
- Explore offering discounts for stays of 30+ nights to attract the 10.5% of the market seeking extended stays.
- Adjust minimum nights based on seasonality – potentially shorter during low season and longer during peak demand periods in sa Torre.
sa Torre Airbnb Cancellation Policy Trends Analysis (2025)
Super Strict 60 Days
2 listings
11.1% of total
Flexible
6 listings
33.3% of total
Moderate
4 listings
22.2% of total
Firm
2 listings
11.1% of total
Strict
4 listings
22.2% of total
Cancellation Policy Insights for sa Torre
- The prevailing Airbnb cancellation policy trend in sa Torre is Flexible, used by 33.3% of listings.
- There's a relatively balanced mix between guest-friendly (55.5%) and stricter (33.3%) policies, offering choices for different guest needs.
Recommendations for Hosts
- Consider adopting a Flexible policy to align with the 33.3% market standard in sa Torre.
- Regularly review your cancellation policy against competitors and market demand shifts in sa Torre.
sa Torre STR Booking Lead Time Analysis (2025)
Average Booking Lead Time by Month
Booking Lead Time Insights for sa Torre
- The overall average booking lead time for vacation rentals in sa Torre is 85 days.
- Guests book furthest in advance for stays during July (average 147 days), likely coinciding with peak travel demand or local events.
- The shortest booking windows occur for stays in January (average 14 days), indicating more last-minute travel plans during this time.
- Seasonally, Summer (132 days avg.) sees the longest lead times, while Winter (32 days avg.) has the shortest, reflecting typical travel planning cycles.
Recommendations for Hosts
- Use the overall average lead time (85 days) as a baseline for your pricing and availability strategy in sa Torre.
- For July stays, consider implementing length-of-stay discounts or slightly higher rates for bookings made less than 147 days out to capitalize on advance planning.
- During January, focus on last-minute booking availability and promotions, as guests book with very short notice (14 days avg.).
- Target marketing efforts for the Summer season well in advance (at least 132 days) to capture early planners.
- Monitor your own booking lead times against these sa Torre averages to identify opportunities for dynamic pricing adjustments.
Popular & Essential Airbnb Amenities in sa Torre (2025)
Amenity Prevalence
Amenity Insights for sa Torre
- Essential amenities in sa Torre that guests expect include: TV, Wifi, Kitchen. Lacking these (any) could significantly impact bookings.
- Popular amenities like Heating, Coffee maker, Washer are common but not universal. Offering these can provide a competitive edge.
- A pool is a highly desired but not standard amenity, making it a key feature for attracting guests seeking leisure in sa Torre.
Recommendations for Hosts
- Ensure your listing includes all essential amenities for sa Torre: TV, Wifi, Kitchen.
- Prioritize adding missing essentials: Kitchen.
- Consider adding popular differentiators like Heating or Coffee maker to increase appeal.
- Highlight unique or less common amenities you offer (e.g., hot tub, dedicated workspace, EV charger) in your listing description and photos.
- Regularly check competitor amenities in sa Torre to stay competitive.
sa Torre Airbnb Guest Demographics & Profile Analysis (2025)
Guest Profile Summary for sa Torre
- The typical guest profile for Airbnb in sa Torre consists of predominantly international visitors (99%), with top international origins including United States, typically belonging to the Post-2000s (Gen Z/Alpha) group (50%), primarily speaking English or German.
- Domestic travelers account for 1.4% of guests.
- Key international markets include Germany (26.4%) and United States (18.1%).
- Top languages spoken are English (42.4%) followed by German (18.2%).
- A significant demographic segment is the Post-2000s (Gen Z/Alpha) group, representing 50% of guests.
Recommendations for Hosts
- Focus marketing internationally, particularly towards travelers from United States.
- Tailor amenities and listing descriptions to appeal to the dominant Post-2000s (Gen Z/Alpha) demographic (e.g., highlight fast WiFi, smart home features, local guides).
- Highlight unique local experiences or amenities relevant to the primary guest profile.
- Consider seasonal promotions aligned with peak travel times for key origin markets.
Nearby Short-Term Rental Market Comparison
How does the sa Torre Airbnb market stack up against its neighbors? Compare key performance metrics like average monthly revenue, ADR, and occupancy rates in surrounding areas to understand the broader regional STR landscape.
| Market | Active Properties | Monthly Revenue | Daily Rate | Avg. Occupancy |
|---|---|---|---|---|
| sa Carroca | 98 | $10,551 | $862.81 | 52% |
| Can Germà | 25 | $9,819 | $927.22 | 47% |
| Can Tomàs | 26 | $9,321 | $878.17 | 47% |
| Es Cubells | 31 | $8,883 | $1002.54 | 54% |
| Sant Rafel de sa Creu | 46 | $7,518 | $730.00 | 45% |
| Vista Mar | 64 | $7,047 | $750.94 | 46% |
| Algaida | 79 | $6,918 | $709.08 | 48% |
| Vista Alegre | 18 | $6,413 | $1214.28 | 42% |
| Mancor de la Vall | 35 | $6,389 | $620.29 | 54% |
| Sant Josep de sa Talaia | 256 | $6,308 | $699.24 | 48% |