sa Carroca Airbnb Market Analysis 2025: Short Term Rental Data & Vacation Rental Statistics in Balearic Islands, Spain
Is Airbnb profitable in sa Carroca in 2025? Explore comprehensive Airbnb analytics for sa Carroca, Balearic Islands, Spain to uncover income potential. This 2025 STR market report for sa Carroca, based on AirROI data from April 2024 to March 2025, reveals key trends in the niche market of 98 active listings.
Whether you're considering an Airbnb investment in sa Carroca, optimizing your existing vacation rental, or exploring rental arbitrage opportunities, understanding the sa Carroca Airbnb data is crucial. Navigating the high regulation landscape is key to maximizing your short term rental income potential. Let's dive into the specifics.
Key sa Carroca Airbnb Performance Metrics Overview
Monthly Airbnb Revenue Variations & Income Potential in sa Carroca (2025)
Understanding the monthly revenue variations for Airbnb listings in sa Carroca is key to maximizing your short term rental income potential. Seasonality significantly impacts earnings. Our analysis, based on data from the past 12 months, shows that the peak revenue month for STRs in sa Carroca is typically August, while March often presents the lowest earnings, highlighting opportunities for strategic pricing adjustments during shoulder and low seasons. Explore the typical Airbnb income in sa Carroca across different performance tiers:
- Best-in-class properties (Top 10%) achieve $28,216+ monthly, often utilizing dynamic pricing and superior guest experiences.
- Strong performing properties (Top 25%) earn $16,387 or more, indicating effective management and desirable locations/amenities.
- Typical properties (Median) generate around $9,464 per month, representing the average market performance.
- Entry-level properties (Bottom 25%) see earnings around $5,253, often with potential for optimization.
Average Monthly Airbnb Earnings Trend in sa Carroca
sa Carroca Airbnb Occupancy Rate Trends (2025)
Maximize your bookings by understanding the sa Carroca STR occupancy trends. Seasonal demand shifts significantly influence how often properties are booked. Typically, Augustsees the highest demand (peak season occupancy), while January experiences the lowest (low season). Effective strategies, like adjusting minimum stays or offering promotions, can boost occupancy during slower periods. Here's how different property tiers perform in sa Carroca:
- Best-in-class properties (Top 10%) achieve 78%+ occupancy, indicating high desirability and potentially optimized availability.
- Strong performing properties (Top 25%) maintain 60% or higher occupancy, suggesting good market fit and guest satisfaction.
- Typical properties (Median) have an occupancy rate around 45%.
- Entry-level properties (Bottom 25%) average 26% occupancy, potentially facing higher vacancy.
Average Monthly Occupancy Rate Trend in sa Carroca
Average Daily Rate (ADR) Airbnb Trends in sa Carroca (2025)
Effective short term rental pricing strategy in sa Carroca involves understanding monthly ADR fluctuations. The Average Daily Rate (ADR) for Airbnb in sa Carroca typically peaks in August and dips lowest during March. Leveraging Airbnb dynamic pricing tools or strategies based on this seasonality can significantly boost revenue. Here's a look at the typical nightly rates achieved:
- Best-in-class properties (Top 10%) command rates of $1,779+ per night, often due to premium features or locations.
- Strong performing properties (Top 25%) achieve nightly rates of $1,030 or more.
- Typical properties (Median) charge around $625 per night.
- Entry-level properties (Bottom 25%) earn around $329 per night.
Average Daily Rate (ADR) Trend by Month in sa Carroca
Get Live sa Carroca Market Intelligence 👇

Explore Real-time Analytics
Airbnb Seasonality Analysis & Trends in sa Carroca (2025)
Peak Season (August, June, July)
- Revenue averages $23,663 per month
- Occupancy rates average 65.4%
- Daily rates average $977
Shoulder Season
- Revenue averages $12,474 per month
- Occupancy maintains around 44.8%
- Daily rates hold near $782
Low Season (January, February, March)
- Revenue drops to average $4,446 per month
- Occupancy decreases to average 23.7%
- Daily rates adjust to average $680
Seasonality Insights for sa Carroca
- The Airbnb seasonality in sa Carroca shows highly seasonal trends requiring careful strategy. While the sections above show seasonal averages, it's also insightful to look at the extremes:
- During the high season, the absolute peak month showcases sa Carroca's highest earning potential, with monthly revenues capable of climbing to $24,199, occupancy reaching a high of 68.4%, and ADRs peaking at $1,003.
- Conversely, the slowest single month of the year, typically falling within the low season, marks the market's lowest point. In this month, revenue might dip to $3,010, occupancy could drop to 20.2%, and ADRs may adjust down to $666.
- Understanding both the seasonal averages and these monthly peaks and troughs in revenue, occupancy, and ADR is crucial for maximizing your Airbnb profit potential in sa Carroca.
Seasonal Strategies for Maximizing Profit
- Peak Season: Maximize revenue through premium pricing and potentially longer minimum stays. Ensure high availability.
- Low Season: Offer competitive pricing, special promotions (e.g., extended stay discounts), and flexible cancellation policies. Target off-season travelers like remote workers or budget-conscious guests.
- Shoulder Seasons: Implement dynamic pricing that balances peak and low rates. Target weekend travelers or specific events. Offer slightly more flexible terms than peak season.
- Regularly analyze your own performance against these sa Carroca seasonality benchmarks and adjust your pricing and availability strategy accordingly.
Best Areas for Airbnb Investment in sa Carroca (2025)
Exploring the top neighborhoods for short-term rentals in sa Carroca? This section highlights key areas, outlining why they are attractive for hosts and guests, along with notable local attractions. Consider these locations based on your target guest profile and investment strategy.
| Neighborhood / Area | Why Host Here? (Target Guests & Appeal) | Key Attractions & Landmarks |
|---|---|---|
| Santa Eulalia del Río | A beautiful coastal town known for its stunning beaches and vibrant marina. It offers a relaxing atmosphere with cultural attractions and is popular with families and retirees. | Santa Eulalia Beach, Paseo Marítimo, Es Canar Hippy Market, Puig de Missa, Church of Santa Eulalia |
| Ibiza Town | The capital of Ibiza, famous for its nightlife, historical sites, and beautiful beaches. A hotspot for party-goers and tourists looking for an exciting vacation. | Dalt Vila (Old Town), Famous nightclubs, La Marina, Ibiza Cathedral, Talamanca Beach |
| San Antonio | Known for its stunning sunsets and lively nightlife, San Antonio attracts a younger crowd and offers many entertainment options near the sea. | Sunset Strip, Cafe del Mar, San Antonio Beach, Water Park, Es Paradis nightclub |
| Formentera | The nearby island is famous for its pristine beaches and crystal-clear waters. It attracts visitors seeking a tranquil and idyllic beach experience. | Ses Illetes Beach, Cala Saona, La Savina Port, Formentera Lighthouse, Bicycle rental paths |
| Talamanca | A quieter area close to Ibiza Town, known for its peaceful beach and family-friendly environment. Great for those seeking a balance between relaxation and proximity to nightlife. | Talamanca Beach, Marina Botafoch, Café del Mar, Ibiza Harbor, Palacio de Congresos |
| Playa d'en Bossa | Renowned for its vibrant beach clubs and nightlife, it's a lively area offering fun experiences and is very popular among younger tourists. | Playa d'en Bossa Beach, Ushuaïa Ibiza Beach Hotel, Hï Ibiza, Bora Bora Beach Club, Water Sports |
| Cala Llonga | A picturesque cove known for its family-friendly atmosphere and beautiful landscapes. It's perfect for families and couples looking to unwind. | Cala Llonga Beach, Local markets, Hiking trails, Family activities, Restaurants and cafes |
| Es Cana | A charming beach resort town known for its relaxed vibe and family-friendly environment. It has a famous hippy market and attracts a diverse crowd. | Es Cana Beach, Hippy Market, Local restaurants, Watersports, Family-friendly activities |
Understanding Airbnb License Requirements & STR Laws in sa Carroca (2025)
Yes, sa Carroca, Balearic Islands, Spain enforces high STR regulations. Obtaining a license and ensuring compliance is almost certainly required according to current 2025 STR laws. Always verify the latest short term rental regulations and Airbnb license requirements directly with local government authorities for sa Carroca to ensure full compliance before hosting.
(Source: AirROI data, 2025, based on 51% licensed listings)
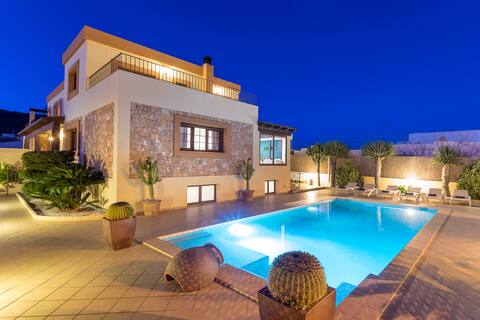
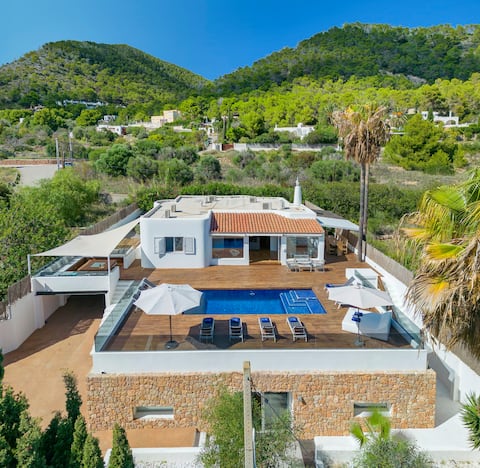
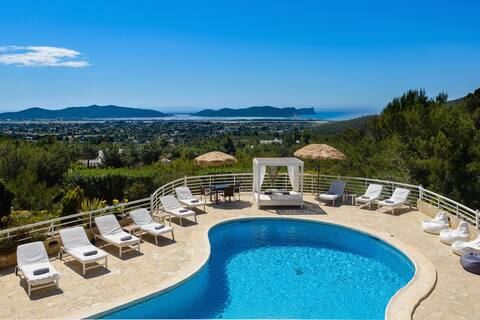
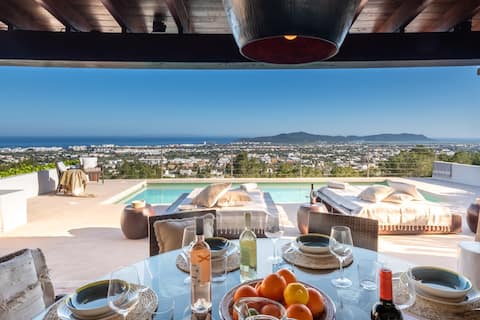
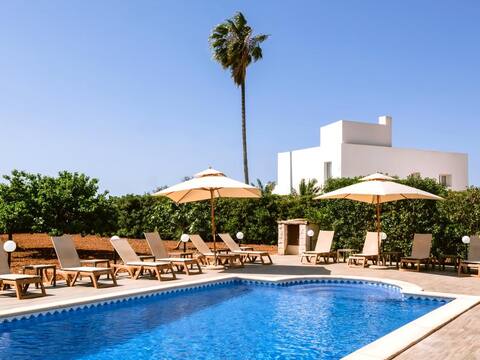
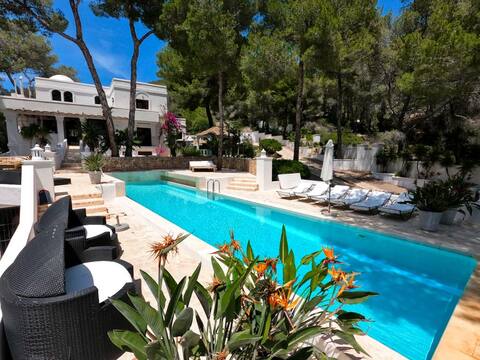
Top Performing Airbnb Properties in sa Carroca (2025)
Benchmark your potential! Explore examples of top-performing Airbnb properties in sa Carrocabased on Trailing Twelve Month (TTM) revenue. Analyze their characteristics, revenue, occupancy rate, and ADR to understand what drives success in this market.
Villa in Ibiza Town, sleeps 16 - Villa Campo Sol
Entire Place • 7 bedrooms
Villa in Ibiza Town, sleeps 12 - Villa Blanca
Entire Place • 6 bedrooms
Sea-view Villa, KM4
Entire Place • 6 bedrooms
Best Location-Breathtaking Views-Private & Calm
Entire Place • 4 bedrooms
Villa KM2 is a 5 min drive from Playa den Bossa
Entire Place • 5 bedrooms
Can de Luz-Home of Peace&Love
Entire Place • 5 bedrooms
Note: Performance varies based on location, size, amenities, seasonality, and management quality. Data reflects the past 12 months.
Top Performing Airbnb Hosts in sa Carroca (2025)
Learn from the best! This table showcases top-performing Airbnb hosts in sa Carroca based on the number of properties managed and estimated total revenue over the past year. Analyze their scale and performance metrics.
| Host Name | Properties | Grossing Revenue | Stay Reviews | Avg Rating |
|---|---|---|---|---|
| Emma | 2 | $1,235,794 | 39 | 2.40/5.0 |
| Ibiza Villas 2000 | 4 | $985,700 | 37 | 4.95/5.0 |
| Crís | 2 | $625,447 | 46 | 4.87/5.0 |
| Ibiza Home Managers | 3 | $430,916 | 142 | 4.99/5.0 |
| Peter | 2 | $351,217 | 130 | 4.76/5.0 |
| Go | 1 | $349,483 | 20 | 5.00/5.0 |
| Javier / Green And Blue | 2 | $348,062 | 88 | 4.83/5.0 |
| Margarita | 2 | $329,957 | 16 | 5.00/5.0 |
| Zaneta | 1 | $313,902 | 43 | 4.98/5.0 |
| Host #251898962 | 1 | $309,590 | 4 | 5.00/5.0 |
Analyzing the strategies of top hosts, such as their property selection, pricing, and guest communication, can offer valuable lessons for optimizing your own Airbnb operations in sa Carroca.
Dive Deeper: Advanced sa Carroca STR Market Data (2025)
Ready to unlock more insights? AirROI provides access to advanced metrics and comprehensive Airbnb data for sa Carroca. Explore detailed analytics beyond this report to refine your investment strategy, optimize pricing, and maximize your vacation rental profits.
Explore Advanced Metricssa Carroca Short-Term Rental Market Composition (2025): Property & Room Types
Room Type Distribution
Property Type Distribution
Market Composition Insights for sa Carroca
- The sa Carroca Airbnb market composition is heavily skewed towards Entire Home/Apt listings, which make up 94.9% of the 98 active rentals. This indicates strong guest preference for privacy and space.
- Looking at the property type distribution in sa Carroca, House properties are the most common (87.8%), reflecting the local real estate landscape.
- Houses represent a significant 87.8% portion, catering likely to families or larger groups.
sa Carroca Airbnb Room Capacity Analysis (2025): Bedroom Distribution
Distribution of Listings by Number of Bedrooms
Room Capacity Insights for sa Carroca
- The dominant room capacity in sa Carroca is 4 bedrooms listings, making up 33.7% of the market. This suggests a strong demand for properties suitable for families or small groups.
- Together, 4 bedrooms and 5+ bedrooms properties represent 65.3% of the active Airbnb listings in sa Carroca, indicating a high concentration in these sizes.
- A significant 82.6% of listings offer 3+ bedrooms, catering to larger groups and families seeking more space in sa Carroca.
sa Carroca Vacation Rental Guest Capacity Trends (2025)
Distribution of Listings by Guest Capacity
Guest Capacity Insights for sa Carroca
- The most common guest capacity trend in sa Carroca vacation rentals is listings accommodating 8+ guests (62.2%). This suggests the primary traveler segment is likely larger groups.
- Properties designed for 8+ guests and 6 guests dominate the sa Carroca STR market, accounting for 78.5% of listings.
- 81.6% of properties accommodate 6+ guests, serving the market segment for larger families or group travel in sa Carroca.
- On average, properties in sa Carroca are equipped to host 6.7 guests.
sa Carroca Airbnb Booking Patterns (2025): Available vs. Booked Days
Available Days Distribution
Booked Days Distribution
Booking Pattern Insights for sa Carroca
- The most common availability pattern in sa Carroca falls within the 181-270 days range, representing 55.1% of listings. This suggests many properties have significant open periods on their calendars.
- Approximately 81.6% of listings show high availability (181+ days open annually), indicating potential for increased bookings or specific owner usage patterns.
- For booked days, the 91-180 days range is most frequent in sa Carroca (52%), reflecting common guest stay durations or potential owner blocking patterns.
- A notable 21.4% of properties secure long booking periods (181+ days booked per year), highlighting successful long-term rental strategies or significant owner usage.
sa Carroca Airbnb Minimum Stay Requirements Analysis
Distribution of Listings by Minimum Night Requirement
1 Night
14 listings
16.5% of total
2 Nights
9 listings
10.6% of total
3 Nights
20 listings
23.5% of total
4-6 Nights
22 listings
25.9% of total
7-29 Nights
9 listings
10.6% of total
30+ Nights
11 listings
12.9% of total
Key Insights
- The most prevalent minimum stay requirement in sa Carroca is 4-6 Nights, adopted by 25.9% of listings. This highlights the market's preference for longer commitments.
- A significant segment (12.9%) caters to monthly stays (30+ nights) in sa Carroca, pointing to opportunities in the extended-stay market.
Recommendations
- Align with the market by considering a 4-6 Nights minimum stay, as 25.9% of sa Carroca hosts use this setting.
- If feasible, allowing 1-night stays, especially midweek or during low season, could capture last-minute bookings, as only 16.5% currently do.
- Explore offering discounts for stays of 30+ nights to attract the 12.9% of the market seeking extended stays.
- Adjust minimum nights based on seasonality – potentially shorter during low season and longer during peak demand periods in sa Carroca.
sa Carroca Airbnb Cancellation Policy Trends Analysis (2025)
Super Strict 30 Days
3 listings
3.8% of total
Super Strict 60 Days
7 listings
8.9% of total
Moderate
4 listings
5.1% of total
Firm
21 listings
26.6% of total
Strict
44 listings
55.7% of total
Cancellation Policy Insights for sa Carroca
- The prevailing Airbnb cancellation policy trend in sa Carroca is Strict, used by 55.7% of listings.
- A majority (82.3%) of hosts in sa Carroca utilize Firm or Strict policies, indicating a market where hosts prioritize booking security.
Recommendations for Hosts
- Consider adopting a Strict policy to align with the 55.7% market standard in sa Carroca.
- With 55.7% using Strict terms, this is a viable option in sa Carroca, particularly for high-value properties or during peak demand periods.
- Regularly review your cancellation policy against competitors and market demand shifts in sa Carroca.
sa Carroca STR Booking Lead Time Analysis (2025)
Average Booking Lead Time by Month
Booking Lead Time Insights for sa Carroca
- The overall average booking lead time for vacation rentals in sa Carroca is 82 days.
- Guests book furthest in advance for stays during June (average 126 days), likely coinciding with peak travel demand or local events.
- The shortest booking windows occur for stays in March (average 34 days), indicating more last-minute travel plans during this time.
- Seasonally, Summer (114 days avg.) sees the longest lead times, while Winter (52 days avg.) has the shortest, reflecting typical travel planning cycles.
Recommendations for Hosts
- Use the overall average lead time (82 days) as a baseline for your pricing and availability strategy in sa Carroca.
- For June stays, consider implementing length-of-stay discounts or slightly higher rates for bookings made less than 126 days out to capitalize on advance planning.
- Target marketing efforts for the Summer season well in advance (at least 114 days) to capture early planners.
- Monitor your own booking lead times against these sa Carroca averages to identify opportunities for dynamic pricing adjustments.
Popular & Essential Airbnb Amenities in sa Carroca (2025)
Amenity Prevalence
Amenity Insights for sa Carroca
- Essential amenities in sa Carroca that guests expect include: Kitchen, Wifi, Washer, TV, Air conditioning. Lacking these (any) could significantly impact bookings.
- Popular amenities like Pool, Hot water, Free parking on premises are common but not universal. Offering these can provide a competitive edge.
- A pool is a highly desired but not standard amenity, making it a key feature for attracting guests seeking leisure in sa Carroca.
Recommendations for Hosts
- Ensure your listing includes all essential amenities for sa Carroca: Kitchen, Wifi, Washer, TV, Air conditioning.
- Prioritize adding missing essentials: Washer, TV, Air conditioning.
- Consider adding popular differentiators like Pool or Hot water to increase appeal.
- Highlight unique or less common amenities you offer (e.g., hot tub, dedicated workspace, EV charger) in your listing description and photos.
- Regularly check competitor amenities in sa Carroca to stay competitive.
sa Carroca Airbnb Guest Demographics & Profile Analysis (2025)
Guest Profile Summary for sa Carroca
- The typical guest profile for Airbnb in sa Carroca consists of predominantly international visitors (95%), with top international origins including France, typically belonging to the Post-2000s (Gen Z/Alpha) group (50%), primarily speaking English or French.
- Domestic travelers account for 4.9% of guests.
- Key international markets include United Kingdom (29.6%) and France (13.8%).
- Top languages spoken are English (45.5%) followed by French (14%).
- A significant demographic segment is the Post-2000s (Gen Z/Alpha) group, representing 50% of guests.
Recommendations for Hosts
- Focus marketing internationally, particularly towards travelers from France.
- Tailor amenities and listing descriptions to appeal to the dominant Post-2000s (Gen Z/Alpha) demographic (e.g., highlight fast WiFi, smart home features, local guides).
- Highlight unique local experiences or amenities relevant to the primary guest profile.
- Consider seasonal promotions aligned with peak travel times for key origin markets.
Nearby Short-Term Rental Market Comparison
How does the sa Carroca Airbnb market stack up against its neighbors? Compare key performance metrics like average monthly revenue, ADR, and occupancy rates in surrounding areas to understand the broader regional STR landscape.
| Market | Active Properties | Monthly Revenue | Daily Rate | Avg. Occupancy |
|---|---|---|---|---|
| Can Germà | 25 | $9,819 | $927.22 | 47% |
| Can Tomàs | 26 | $9,321 | $878.17 | 47% |
| Es Cubells | 31 | $8,883 | $1002.54 | 54% |
| Sant Rafel de sa Creu | 46 | $7,518 | $730.00 | 45% |
| Vista Mar | 64 | $7,047 | $750.94 | 46% |
| Algaida | 79 | $6,918 | $709.08 | 48% |
| Vista Alegre | 18 | $6,413 | $1214.28 | 42% |
| Mancor de la Vall | 35 | $6,389 | $620.29 | 54% |
| Sant Josep de sa Talaia | 256 | $6,308 | $699.24 | 48% |
| Cala Carbó | 18 | $6,303 | $901.65 | 37% |