Peguera Airbnb Market Analysis 2025: Short Term Rental Data & Vacation Rental Statistics in Balearic Islands, Spain
Is Airbnb profitable in Peguera in 2025? Explore comprehensive Airbnb analytics for Peguera, Balearic Islands, Spain to uncover income potential. This 2025 STR market report for Peguera, based on AirROI data from April 2024 to March 2025, reveals key trends in the niche market of 22 active listings.
Whether you're considering an Airbnb investment in Peguera, optimizing your existing vacation rental, or exploring rental arbitrage opportunities, understanding the Peguera Airbnb data is crucial. Navigating the high regulation landscape is key to maximizing your short term rental income potential. Let's dive into the specifics.
Key Peguera Airbnb Performance Metrics Overview
Monthly Airbnb Revenue Variations & Income Potential in Peguera (2025)
Understanding the monthly revenue variations for Airbnb listings in Peguera is key to maximizing your short term rental income potential. Seasonality significantly impacts earnings. Our analysis, based on data from the past 12 months, shows that the peak revenue month for STRs in Peguera is typically July, while November often presents the lowest earnings, highlighting opportunities for strategic pricing adjustments during shoulder and low seasons. Explore the typical Airbnb income in Peguera across different performance tiers:
- Best-in-class properties (Top 10%) achieve $5,384+ monthly, often utilizing dynamic pricing and superior guest experiences.
- Strong performing properties (Top 25%) earn $3,197 or more, indicating effective management and desirable locations/amenities.
- Typical properties (Median) generate around $1,906 per month, representing the average market performance.
- Entry-level properties (Bottom 25%) see earnings around $1,205, often with potential for optimization.
Average Monthly Airbnb Earnings Trend in Peguera
Peguera Airbnb Occupancy Rate Trends (2025)
Maximize your bookings by understanding the Peguera STR occupancy trends. Seasonal demand shifts significantly influence how often properties are booked. Typically, Julysees the highest demand (peak season occupancy), while November experiences the lowest (low season). Effective strategies, like adjusting minimum stays or offering promotions, can boost occupancy during slower periods. Here's how different property tiers perform in Peguera:
- Best-in-class properties (Top 10%) achieve 82%+ occupancy, indicating high desirability and potentially optimized availability.
- Strong performing properties (Top 25%) maintain 67% or higher occupancy, suggesting good market fit and guest satisfaction.
- Typical properties (Median) have an occupancy rate around 40%.
- Entry-level properties (Bottom 25%) average 22% occupancy, potentially facing higher vacancy.
Average Monthly Occupancy Rate Trend in Peguera
Average Daily Rate (ADR) Airbnb Trends in Peguera (2025)
Effective short term rental pricing strategy in Peguera involves understanding monthly ADR fluctuations. The Average Daily Rate (ADR) for Airbnb in Peguera typically peaks in August and dips lowest during February. Leveraging Airbnb dynamic pricing tools or strategies based on this seasonality can significantly boost revenue. Here's a look at the typical nightly rates achieved:
- Best-in-class properties (Top 10%) command rates of $780+ per night, often due to premium features or locations.
- Strong performing properties (Top 25%) achieve nightly rates of $220 or more.
- Typical properties (Median) charge around $134 per night.
- Entry-level properties (Bottom 25%) earn around $83 per night.
Average Daily Rate (ADR) Trend by Month in Peguera
Get Live Peguera Market Intelligence 👇

Explore Real-time Analytics
Airbnb Seasonality Analysis & Trends in Peguera (2025)
Peak Season (July, August, June)
- Revenue averages $5,183 per month
- Occupancy rates average 62.1%
- Daily rates average $351
Shoulder Season
- Revenue averages $2,319 per month
- Occupancy maintains around 43.3%
- Daily rates hold near $280
Low Season (January, March, November)
- Revenue drops to average $1,133 per month
- Occupancy decreases to average 28.8%
- Daily rates adjust to average $215
Seasonality Insights for Peguera
- The Airbnb seasonality in Peguera shows highly seasonal trends requiring careful strategy. While the sections above show seasonal averages, it's also insightful to look at the extremes:
- During the high season, the absolute peak month showcases Peguera's highest earning potential, with monthly revenues capable of climbing to $6,370, occupancy reaching a high of 66.6%, and ADRs peaking at $361.
- Conversely, the slowest single month of the year, typically falling within the low season, marks the market's lowest point. In this month, revenue might dip to $820, occupancy could drop to 19.2%, and ADRs may adjust down to $209.
- Understanding both the seasonal averages and these monthly peaks and troughs in revenue, occupancy, and ADR is crucial for maximizing your Airbnb profit potential in Peguera.
Seasonal Strategies for Maximizing Profit
- Peak Season: Maximize revenue through premium pricing and potentially longer minimum stays. Ensure high availability.
- Low Season: Offer competitive pricing, special promotions (e.g., extended stay discounts), and flexible cancellation policies. Target off-season travelers like remote workers or budget-conscious guests.
- Shoulder Seasons: Implement dynamic pricing that balances peak and low rates. Target weekend travelers or specific events. Offer slightly more flexible terms than peak season.
- Regularly analyze your own performance against these Peguera seasonality benchmarks and adjust your pricing and availability strategy accordingly.
Best Areas for Airbnb Investment in Peguera (2025)
Exploring the top neighborhoods for short-term rentals in Peguera? This section highlights key areas, outlining why they are attractive for hosts and guests, along with notable local attractions. Consider these locations based on your target guest profile and investment strategy.
| Neighborhood / Area | Why Host Here? (Target Guests & Appeal) | Key Attractions & Landmarks |
|---|---|---|
| Central Peguera | The heart of Peguera, known for its proximity to beaches, shops, and restaurants. Ideal for tourists looking for convenience and access to local attractions. | Peguera Beach, La Romana Beach, Boulevard de Peguera, restaurants and cafes, local shops |
| Peguera Palmira Beach | A favored spot for sunbathers and water sports enthusiasts, Palmira Beach offers a lively atmosphere combined with stunning views. | Palmira Beach, water sports, beach clubs, restaurants, sunbathing spots |
| Peguera Boulevard | Centrally located with a variety of shops, bars, and cafes, great for evening strolls and dining experiences. | Boulevard with shops, local restaurants, live music bars, ice cream shops, family-friendly attractions |
| Cap Andritxol | A picturesque area offering beautiful coastal views and hiking opportunities, perfect for nature lovers and those seeking tranquility. | scenic hiking trails, coastal views, natural parks, peaceful beaches |
| La Romana | Known for its relaxed atmosphere and family-friendly environment, La Romana is popular with families and offers various amenities. | La Romana Beach, playgrounds, family parks, shops and eateries |
| Tennis Club Peguera | Attracts tennis enthusiasts and families, offering a range of activities and amenities. | Tennis courts, fitness facilities, social events, family-friendly activities |
| Son Tapes | A quieter, residential area that provides a more local and authentic experience while still being close to the main attractions. | local residences, peaceful environment, close to beaches, family-owned restaurants |
| Nearby Santa Ponsa | A short drive away, offers vibrant nightlife and additional beach options, appealing to a broader range of tourists. | Santa Ponsa Beach, nightlife venues, water parks, shopping centers |
Understanding Airbnb License Requirements & STR Laws in Peguera (2025)
Yes, Peguera, Balearic Islands, Spain enforces high STR regulations. Obtaining a license and ensuring compliance is almost certainly required according to current 2025 STR laws. Always verify the latest short term rental regulations and Airbnb license requirements directly with local government authorities for Peguera to ensure full compliance before hosting.
(Source: AirROI data, 2025, based on 36% licensed listings)
Top Performing Airbnb Properties in Peguera (2025)
Benchmark your potential! Explore examples of top-performing Airbnb properties in Peguerabased on Trailing Twelve Month (TTM) revenue. Analyze their characteristics, revenue, occupancy rate, and ADR to understand what drives success in this market.
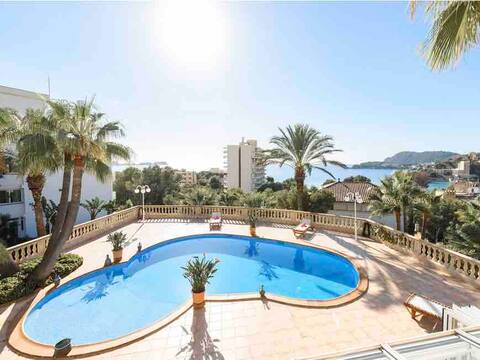
ESPECTACULAR VILLA CON PISCINA PRIVADA
Entire Place • 6 bedrooms
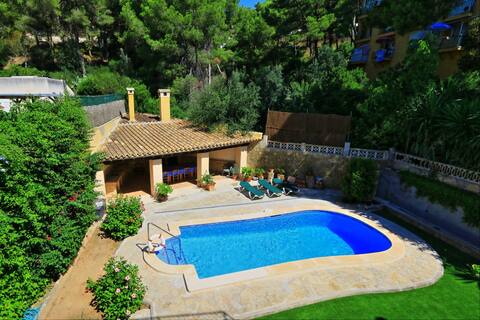
El Ranchito
Entire Place • 4 bedrooms

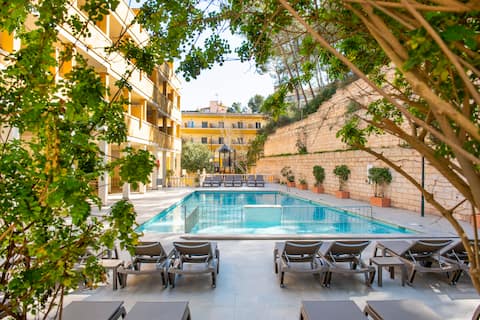
Apartamento vista piscina 3 people
Entire Place • 1 bedroom

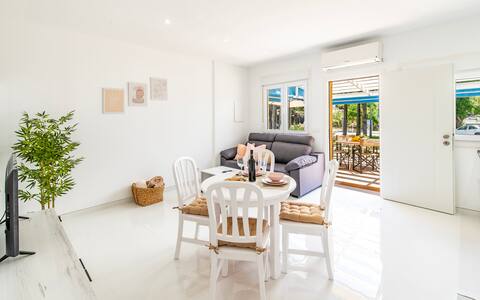
Bright and modern house
Entire Place • 2 bedrooms
Apartamento vista piscina 2 people
Entire Place • 1 bedroom
Sweet little Paguera
Entire Place • 1 bedroom
Note: Performance varies based on location, size, amenities, seasonality, and management quality. Data reflects the past 12 months.
Top Performing Airbnb Hosts in Peguera (2025)
Learn from the best! This table showcases top-performing Airbnb hosts in Peguera based on the number of properties managed and estimated total revenue over the past year. Analyze their scale and performance metrics.
| Host Name | Properties | Grossing Revenue | Stay Reviews | Avg Rating |
|---|---|---|---|---|
| Noemi | 4 | $127,089 | 775 | 4.51/5.0 |
| Host #59124767 | 1 | $119,958 | 12 | 4.92/5.0 |
| Timea Irisz | 2 | $90,588 | 35 | 4.87/5.0 |
| Brigitte | 2 | $43,706 | 33 | 4.97/5.0 |
| Juana | 1 | $35,325 | 47 | 4.70/5.0 |
| Birgitt Sherina | 1 | $23,221 | 24 | 4.67/5.0 |
| Holidu | 1 | $22,702 | 5 | 5.00/5.0 |
| Jaume | 1 | $21,283 | 145 | 4.91/5.0 |
| Ana | 1 | $19,690 | 29 | 4.79/5.0 |
| Alexandre | 1 | $15,966 | 14 | 4.57/5.0 |
Analyzing the strategies of top hosts, such as their property selection, pricing, and guest communication, can offer valuable lessons for optimizing your own Airbnb operations in Peguera.
Dive Deeper: Advanced Peguera STR Market Data (2025)
Ready to unlock more insights? AirROI provides access to advanced metrics and comprehensive Airbnb data for Peguera. Explore detailed analytics beyond this report to refine your investment strategy, optimize pricing, and maximize your vacation rental profits.
Explore Advanced MetricsPeguera Short-Term Rental Market Composition (2025): Property & Room Types
Room Type Distribution
Property Type Distribution
Market Composition Insights for Peguera
- The Peguera Airbnb market composition is heavily skewed towards Entire Home/Apt listings, which make up 95.5% of the 22 active rentals. This indicates strong guest preference for privacy and space.
- Looking at the property type distribution in Peguera, Apartment/Condo properties are the most common (63.6%), reflecting the local real estate landscape.
- Houses represent a significant 27.3% portion, catering likely to families or larger groups.
- Smaller segments like hotel/boutique, outdoor/unique (combined 9.0%) offer potential for unique stay experiences.
Peguera Airbnb Room Capacity Analysis (2025): Bedroom Distribution
Distribution of Listings by Number of Bedrooms
Room Capacity Insights for Peguera
- The dominant room capacity in Peguera is 1 bedroom listings, making up 59.1% of the market. This suggests a strong demand for properties suitable for couples or solo travelers.
- Together, 1 bedroom and 2 bedrooms properties represent 77.3% of the active Airbnb listings in Peguera, indicating a high concentration in these sizes.
- With over half the market (59.1%) consisting of studios or 1-bedroom units, Peguera is particularly well-suited for individuals or couples.
Peguera Vacation Rental Guest Capacity Trends (2025)
Distribution of Listings by Guest Capacity
Guest Capacity Insights for Peguera
- The most common guest capacity trend in Peguera vacation rentals is listings accommodating 2 guests (31.8%). This suggests the primary traveler segment is likely couples or solo travelers.
- Properties designed for 2 guests and 4 guests dominate the Peguera STR market, accounting for 59.1% of listings.
- 18.2% of properties accommodate 6+ guests, serving the market segment for larger families or group travel in Peguera.
- On average, properties in Peguera are equipped to host 3.9 guests.
Peguera Airbnb Booking Patterns (2025): Available vs. Booked Days
Available Days Distribution
Booked Days Distribution
Booking Pattern Insights for Peguera
- The most common availability pattern in Peguera falls within the 181-270 days range, representing 36.4% of listings. This suggests many properties have significant open periods on their calendars.
- Approximately 68.2% of listings show high availability (181+ days open annually), indicating potential for increased bookings or specific owner usage patterns.
- For booked days, the 91-180 days range is most frequent in Peguera (36.4%), reflecting common guest stay durations or potential owner blocking patterns.
- A notable 31.8% of properties secure long booking periods (181+ days booked per year), highlighting successful long-term rental strategies or significant owner usage.
Peguera Airbnb Minimum Stay Requirements Analysis
Distribution of Listings by Minimum Night Requirement
1 Night
1 listings
5% of total
2 Nights
1 listings
5% of total
3 Nights
1 listings
5% of total
4-6 Nights
9 listings
45% of total
7-29 Nights
3 listings
15% of total
30+ Nights
5 listings
25% of total
Key Insights
- The most prevalent minimum stay requirement in Peguera is 4-6 Nights, adopted by 45% of listings. This highlights the market's preference for longer commitments.
- Very short stays (1-2 nights) are less common (10.0%), suggesting hosts prefer slightly longer bookings to optimize turnover.
- A significant segment (25%) caters to monthly stays (30+ nights) in Peguera, pointing to opportunities in the extended-stay market.
Recommendations
- Align with the market by considering a 4-6 Nights minimum stay, as 45% of Peguera hosts use this setting.
- If feasible, allowing 1-night stays, especially midweek or during low season, could capture last-minute bookings, as only 5% currently do.
- Explore offering discounts for stays of 30+ nights to attract the 25% of the market seeking extended stays.
- Adjust minimum nights based on seasonality – potentially shorter during low season and longer during peak demand periods in Peguera.
Peguera Airbnb Cancellation Policy Trends Analysis (2025)
Flexible
2 listings
10.5% of total
Moderate
4 listings
21.1% of total
Firm
7 listings
36.8% of total
Strict
6 listings
31.6% of total
Cancellation Policy Insights for Peguera
- The prevailing Airbnb cancellation policy trend in Peguera is Firm, used by 36.8% of listings.
- A majority (68.4%) of hosts in Peguera utilize Firm or Strict policies, indicating a market where hosts prioritize booking security.
Recommendations for Hosts
- Consider adopting a Firm policy to align with the 36.8% market standard in Peguera.
- With 31.6% using Strict terms, this is a viable option in Peguera, particularly for high-value properties or during peak demand periods.
- Regularly review your cancellation policy against competitors and market demand shifts in Peguera.
Peguera STR Booking Lead Time Analysis (2025)
Average Booking Lead Time by Month
Booking Lead Time Insights for Peguera
- The overall average booking lead time for vacation rentals in Peguera is 96 days.
- Guests book furthest in advance for stays during July (average 149 days), likely coinciding with peak travel demand or local events.
- The shortest booking windows occur for stays in April (average 65 days), indicating more last-minute travel plans during this time.
- Seasonally, Summer (129 days avg.) sees the longest lead times, while Spring (80 days avg.) has the shortest, reflecting typical travel planning cycles.
Recommendations for Hosts
- Use the overall average lead time (96 days) as a baseline for your pricing and availability strategy in Peguera.
- For July stays, consider implementing length-of-stay discounts or slightly higher rates for bookings made less than 149 days out to capitalize on advance planning.
- Target marketing efforts for the Summer season well in advance (at least 129 days) to capture early planners.
- Monitor your own booking lead times against these Peguera averages to identify opportunities for dynamic pricing adjustments.
Popular & Essential Airbnb Amenities in Peguera (2025)
Amenity Prevalence
Amenity Insights for Peguera
- Essential amenities in Peguera that guests expect include: Wifi, TV. Lacking these (any) could significantly impact bookings.
- Popular amenities like Hair dryer, Dishes and silverware, Kitchen are common but not universal. Offering these can provide a competitive edge.
Recommendations for Hosts
- Ensure your listing includes all essential amenities for Peguera: Wifi, TV.
- Prioritize adding missing essentials: Wifi, TV.
- Consider adding popular differentiators like Hair dryer or Dishes and silverware to increase appeal.
- Highlight unique or less common amenities you offer (e.g., hot tub, dedicated workspace, EV charger) in your listing description and photos.
- Regularly check competitor amenities in Peguera to stay competitive.
Peguera Airbnb Guest Demographics & Profile Analysis (2025)
Guest Profile Summary for Peguera
- The typical guest profile for Airbnb in Peguera consists of predominantly international visitors (95%), with top international origins including France, typically belonging to the Post-2000s (Gen Z/Alpha) group (50%), primarily speaking English or French.
- Domestic travelers account for 5.4% of guests.
- Key international markets include Germany (23%) and France (19.9%).
- Top languages spoken are English (40.6%) followed by French (15.2%).
- A significant demographic segment is the Post-2000s (Gen Z/Alpha) group, representing 50% of guests.
Recommendations for Hosts
- Focus marketing internationally, particularly towards travelers from France.
- Tailor amenities and listing descriptions to appeal to the dominant Post-2000s (Gen Z/Alpha) demographic (e.g., highlight fast WiFi, smart home features, local guides).
- Highlight unique local experiences or amenities relevant to the primary guest profile.
- Consider seasonal promotions aligned with peak travel times for key origin markets.
Nearby Short-Term Rental Market Comparison
How does the Peguera Airbnb market stack up against its neighbors? Compare key performance metrics like average monthly revenue, ADR, and occupancy rates in surrounding areas to understand the broader regional STR landscape.
| Market | Active Properties | Monthly Revenue | Daily Rate | Avg. Occupancy |
|---|---|---|---|---|
| sa Carroca | 98 | $10,551 | $862.81 | 52% |
| Can Germà | 25 | $9,819 | $927.22 | 47% |
| Can Tomàs | 26 | $9,321 | $878.17 | 47% |
| Es Cubells | 31 | $8,883 | $1002.54 | 54% |
| Sant Rafel de sa Creu | 46 | $7,518 | $730.00 | 45% |
| Vista Mar | 64 | $7,047 | $750.94 | 46% |
| Algaida | 79 | $6,918 | $709.08 | 48% |
| Vista Alegre | 18 | $6,413 | $1214.28 | 42% |
| Mancor de la Vall | 35 | $6,389 | $620.29 | 54% |
| Sant Josep de sa Talaia | 256 | $6,308 | $699.24 | 48% |