Palmanova Airbnb Market Analysis 2025: Short Term Rental Data & Vacation Rental Statistics in Balearic Islands, Spain
Is Airbnb profitable in Palmanova in 2025? Explore comprehensive Airbnb analytics for Palmanova, Balearic Islands, Spain to uncover income potential. This 2025 STR market report for Palmanova, based on AirROI data from April 2024 to March 2025, reveals key trends in the niche market of 47 active listings.
Whether you're considering an Airbnb investment in Palmanova, optimizing your existing vacation rental, or exploring rental arbitrage opportunities, understanding the Palmanova Airbnb data is crucial. Navigating the high regulation landscape is key to maximizing your short term rental income potential. Let's dive into the specifics.
Key Palmanova Airbnb Performance Metrics Overview
Monthly Airbnb Revenue Variations & Income Potential in Palmanova (2025)
Understanding the monthly revenue variations for Airbnb listings in Palmanova is key to maximizing your short term rental income potential. Seasonality significantly impacts earnings. Our analysis, based on data from the past 12 months, shows that the peak revenue month for STRs in Palmanova is typically June, while January often presents the lowest earnings, highlighting opportunities for strategic pricing adjustments during shoulder and low seasons. Explore the typical Airbnb income in Palmanova across different performance tiers:
- Best-in-class properties (Top 10%) achieve $6,500+ monthly, often utilizing dynamic pricing and superior guest experiences.
- Strong performing properties (Top 25%) earn $3,842 or more, indicating effective management and desirable locations/amenities.
- Typical properties (Median) generate around $2,207 per month, representing the average market performance.
- Entry-level properties (Bottom 25%) see earnings around $1,240, often with potential for optimization.
Average Monthly Airbnb Earnings Trend in Palmanova
Palmanova Airbnb Occupancy Rate Trends (2025)
Maximize your bookings by understanding the Palmanova STR occupancy trends. Seasonal demand shifts significantly influence how often properties are booked. Typically, Julysees the highest demand (peak season occupancy), while March experiences the lowest (low season). Effective strategies, like adjusting minimum stays or offering promotions, can boost occupancy during slower periods. Here's how different property tiers perform in Palmanova:
- Best-in-class properties (Top 10%) achieve 80%+ occupancy, indicating high desirability and potentially optimized availability.
- Strong performing properties (Top 25%) maintain 64% or higher occupancy, suggesting good market fit and guest satisfaction.
- Typical properties (Median) have an occupancy rate around 42%.
- Entry-level properties (Bottom 25%) average 21% occupancy, potentially facing higher vacancy.
Average Monthly Occupancy Rate Trend in Palmanova
Average Daily Rate (ADR) Airbnb Trends in Palmanova (2025)
Effective short term rental pricing strategy in Palmanova involves understanding monthly ADR fluctuations. The Average Daily Rate (ADR) for Airbnb in Palmanova typically peaks in August and dips lowest during November. Leveraging Airbnb dynamic pricing tools or strategies based on this seasonality can significantly boost revenue. Here's a look at the typical nightly rates achieved:
- Best-in-class properties (Top 10%) command rates of $376+ per night, often due to premium features or locations.
- Strong performing properties (Top 25%) achieve nightly rates of $234 or more.
- Typical properties (Median) charge around $152 per night.
- Entry-level properties (Bottom 25%) earn around $107 per night.
Average Daily Rate (ADR) Trend by Month in Palmanova
Get Live Palmanova Market Intelligence 👇

Explore Real-time Analytics
Airbnb Seasonality Analysis & Trends in Palmanova (2025)
Peak Season (June, July, April)
- Revenue averages $5,794 per month
- Occupancy rates average 56.7%
- Daily rates average $261
Shoulder Season
- Revenue averages $3,408 per month
- Occupancy maintains around 45.5%
- Daily rates hold near $246
Low Season (January, February, March)
- Revenue drops to average $1,078 per month
- Occupancy decreases to average 28.0%
- Daily rates adjust to average $230
Seasonality Insights for Palmanova
- The Airbnb seasonality in Palmanova shows highly seasonal trends requiring careful strategy. While the sections above show seasonal averages, it's also insightful to look at the extremes:
- During the high season, the absolute peak month showcases Palmanova's highest earning potential, with monthly revenues capable of climbing to $6,144, occupancy reaching a high of 59.3%, and ADRs peaking at $296.
- Conversely, the slowest single month of the year, typically falling within the low season, marks the market's lowest point. In this month, revenue might dip to $894, occupancy could drop to 23.6%, and ADRs may adjust down to $224.
- Understanding both the seasonal averages and these monthly peaks and troughs in revenue, occupancy, and ADR is crucial for maximizing your Airbnb profit potential in Palmanova.
Seasonal Strategies for Maximizing Profit
- Peak Season: Maximize revenue through premium pricing and potentially longer minimum stays. Ensure high availability.
- Low Season: Offer competitive pricing, special promotions (e.g., extended stay discounts), and flexible cancellation policies. Target off-season travelers like remote workers or budget-conscious guests.
- Shoulder Seasons: Implement dynamic pricing that balances peak and low rates. Target weekend travelers or specific events. Offer slightly more flexible terms than peak season.
- Regularly analyze your own performance against these Palmanova seasonality benchmarks and adjust your pricing and availability strategy accordingly.
Best Areas for Airbnb Investment in Palmanova (2025)
Exploring the top neighborhoods for short-term rentals in Palmanova? This section highlights key areas, outlining why they are attractive for hosts and guests, along with notable local attractions. Consider these locations based on your target guest profile and investment strategy.
| Neighborhood / Area | Why Host Here? (Target Guests & Appeal) | Key Attractions & Landmarks |
|---|---|---|
| Palmanova Beach | A popular tourist destination with a beautiful sandy beach, family-friendly atmosphere, and proximity to water sports and activities. | Palmanova Beach, Marineland Mallorca, Western Water Park, Katmandu Park, Son Amar |
| Golf Fantasia | An attractive area for holidaymakers due to its mini-golf attractions and lush gardens, perfect for families and groups. | Golf Fantasia, Palma Nova Marina, The Square, Restaurants and Bars nearby |
| Puerto Portals | An upscale marina area known for luxury yachts and high-end boutiques, attracting affluent visitors and glamorous nightlife. | Puerto Portals Marina, High-end dining options, Boutiques and shops, Beaches nearby |
| Magaluf | A lively tourist area known for its nightlife and entertainment options, popular with younger travelers looking for fun and parties. | Magaluf Beach, Katmandu Park, Nightclubs and bars, Western Water Park |
| Son Caliu | A residential area that offers a quiet retreat with easy access to beaches and local amenities, appealing to families and longer-term visitors. | Son Caliu Beach, Restaurants, Hotels and spas, Local markets |
| Costa de la Calma | A more tranquil coastal area perfect for relaxation, with beautiful beach access and a variety of accommodations. | Costa de la Calma Beach, Local restaurants, Scenic coastlines |
| Santa Ponsa | A popular family destination with a mix of lively atmosphere and more relaxed areas, catering to diverse tourist interests. | Santa Ponsa Beach, Golf courses, Local shops and markets, Water sports activities |
| Paguera | A charming resort town with picturesque beaches and a relaxed vibe, ideal for families and those seeking a peaceful retreat. | Paguera Beach, Beautiful promenade, Dining options, Water activities |
Understanding Airbnb License Requirements & STR Laws in Palmanova (2025)
Yes, Palmanova, Balearic Islands, Spain enforces high STR regulations. Obtaining a license and ensuring compliance is almost certainly required according to current 2025 STR laws. Always verify the latest short term rental regulations and Airbnb license requirements directly with local government authorities for Palmanova to ensure full compliance before hosting.
(Source: AirROI data, 2025, based on 43% licensed listings)
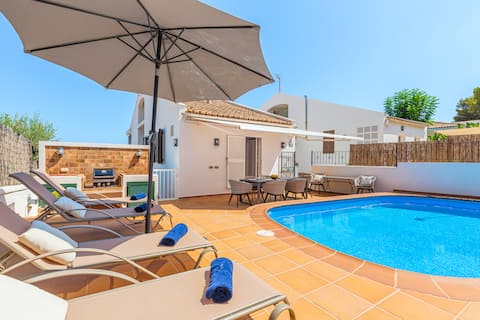
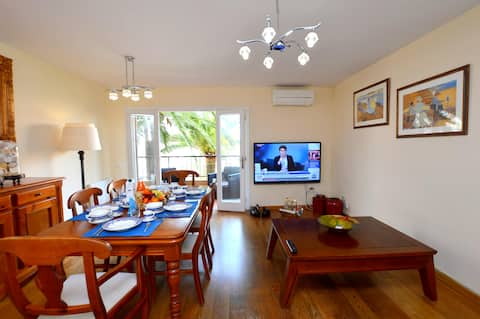
Top Performing Airbnb Properties in Palmanova (2025)
Benchmark your potential! Explore examples of top-performing Airbnb properties in Palmanovabased on Trailing Twelve Month (TTM) revenue. Analyze their characteristics, revenue, occupancy rate, and ADR to understand what drives success in this market.
Ca Na Luisa-Residential Area
Entire Place • 6 bedrooms

Villa Palmanova, your best place for group travel
Entire Place • 7 bedrooms

IDEAL CHALET, CYCLE-TOURISM, PALMANOVA
Entire Place • 4 bedrooms

Villa Francisca1000m2. Swimming pool. Beach 200m ETV7846
Entire Place • 7 bedrooms
Cozy apartment 100 meters from the beach
Entire Place • 3 bedrooms

Palmanova Beachfront Apartment
Entire Place • 1 bedroom
Note: Performance varies based on location, size, amenities, seasonality, and management quality. Data reflects the past 12 months.
Top Performing Airbnb Hosts in Palmanova (2025)
Learn from the best! This table showcases top-performing Airbnb hosts in Palmanova based on the number of properties managed and estimated total revenue over the past year. Analyze their scale and performance metrics.
| Host Name | Properties | Grossing Revenue | Stay Reviews | Avg Rating |
|---|---|---|---|---|
| Holidu | 1 | $266,442 | 9 | 5.00/5.0 |
| Villapalmanova | 1 | $134,903 | 128 | 4.90/5.0 |
| Apartamentos Vistasol | 5 | $134,884 | 168 | 2.49/5.0 |
| Nicolás | 1 | $89,787 | 302 | 4.86/5.0 |
| Francisca | 1 | $83,767 | 219 | 4.67/5.0 |
| Ziane | 3 | $80,054 | 76 | 4.83/5.0 |
| Marina | 6 | $71,874 | 117 | 4.57/5.0 |
| Juan | 1 | $66,486 | 66 | 4.74/5.0 |
| Adel | 1 | $58,441 | 19 | 4.84/5.0 |
| Inn Mallorca | 2 | $47,302 | 56 | 4.56/5.0 |
Analyzing the strategies of top hosts, such as their property selection, pricing, and guest communication, can offer valuable lessons for optimizing your own Airbnb operations in Palmanova.
Dive Deeper: Advanced Palmanova STR Market Data (2025)
Ready to unlock more insights? AirROI provides access to advanced metrics and comprehensive Airbnb data for Palmanova. Explore detailed analytics beyond this report to refine your investment strategy, optimize pricing, and maximize your vacation rental profits.
Explore Advanced MetricsPalmanova Short-Term Rental Market Composition (2025): Property & Room Types
Room Type Distribution
Property Type Distribution
Market Composition Insights for Palmanova
- The Palmanova Airbnb market composition is heavily skewed towards Entire Home/Apt listings, which make up 85.1% of the 47 active rentals. This indicates strong guest preference for privacy and space.
- Looking at the property type distribution in Palmanova, Apartment/Condo properties are the most common (76.6%), reflecting the local real estate landscape.
- Smaller segments like others, outdoor/unique, hotel/boutique (combined 8.5%) offer potential for unique stay experiences.
Palmanova Airbnb Room Capacity Analysis (2025): Bedroom Distribution
Distribution of Listings by Number of Bedrooms
Room Capacity Insights for Palmanova
- The dominant room capacity in Palmanova is 1 bedroom listings, making up 42.6% of the market. This suggests a strong demand for properties suitable for couples or solo travelers.
- Together, 1 bedroom and 2 bedrooms properties represent 76.6% of the active Airbnb listings in Palmanova, indicating a high concentration in these sizes.
Palmanova Vacation Rental Guest Capacity Trends (2025)
Distribution of Listings by Guest Capacity
Guest Capacity Insights for Palmanova
- The most common guest capacity trend in Palmanova vacation rentals is listings accommodating 4 guests (27.7%). This suggests the primary traveler segment is likely small families or groups.
- Properties designed for 4 guests and 5 guests dominate the Palmanova STR market, accounting for 42.6% of listings.
- 23.4% of properties accommodate 6+ guests, serving the market segment for larger families or group travel in Palmanova.
- On average, properties in Palmanova are equipped to host 4.2 guests.
Palmanova Airbnb Booking Patterns (2025): Available vs. Booked Days
Available Days Distribution
Booked Days Distribution
Booking Pattern Insights for Palmanova
- The most common availability pattern in Palmanova falls within the 181-270 days range, representing 48.9% of listings. This suggests many properties have significant open periods on their calendars.
- Approximately 80.8% of listings show high availability (181+ days open annually), indicating potential for increased bookings or specific owner usage patterns.
- For booked days, the 91-180 days range is most frequent in Palmanova (42.6%), reflecting common guest stay durations or potential owner blocking patterns.
- A notable 27.7% of properties secure long booking periods (181+ days booked per year), highlighting successful long-term rental strategies or significant owner usage.
Palmanova Airbnb Minimum Stay Requirements Analysis
Distribution of Listings by Minimum Night Requirement
1 Night
6 listings
15% of total
2 Nights
6 listings
15% of total
3 Nights
4 listings
10% of total
4-6 Nights
15 listings
37.5% of total
7-29 Nights
3 listings
7.5% of total
30+ Nights
6 listings
15% of total
Key Insights
- The most prevalent minimum stay requirement in Palmanova is 4-6 Nights, adopted by 37.5% of listings. This highlights the market's preference for longer commitments.
- A significant segment (15%) caters to monthly stays (30+ nights) in Palmanova, pointing to opportunities in the extended-stay market.
Recommendations
- Align with the market by considering a 4-6 Nights minimum stay, as 37.5% of Palmanova hosts use this setting.
- If feasible, allowing 1-night stays, especially midweek or during low season, could capture last-minute bookings, as only 15% currently do.
- Explore offering discounts for stays of 30+ nights to attract the 15% of the market seeking extended stays.
- Adjust minimum nights based on seasonality – potentially shorter during low season and longer during peak demand periods in Palmanova.
Palmanova Airbnb Cancellation Policy Trends Analysis (2025)
Flexible
3 listings
8.1% of total
Moderate
9 listings
24.3% of total
Firm
12 listings
32.4% of total
Strict
13 listings
35.1% of total
Cancellation Policy Insights for Palmanova
- The prevailing Airbnb cancellation policy trend in Palmanova is Strict, used by 35.1% of listings.
- A majority (67.5%) of hosts in Palmanova utilize Firm or Strict policies, indicating a market where hosts prioritize booking security.
Recommendations for Hosts
- Consider adopting a Strict policy to align with the 35.1% market standard in Palmanova.
- With 35.1% using Strict terms, this is a viable option in Palmanova, particularly for high-value properties or during peak demand periods.
- Regularly review your cancellation policy against competitors and market demand shifts in Palmanova.
Palmanova STR Booking Lead Time Analysis (2025)
Average Booking Lead Time by Month
Booking Lead Time Insights for Palmanova
- The overall average booking lead time for vacation rentals in Palmanova is 48 days.
- Guests book furthest in advance for stays during July (average 97 days), likely coinciding with peak travel demand or local events.
- The shortest booking windows occur for stays in January (average 29 days), indicating more last-minute travel plans during this time.
- Seasonally, Summer (85 days avg.) sees the longest lead times, while Winter (37 days avg.) has the shortest, reflecting typical travel planning cycles.
Recommendations for Hosts
- Use the overall average lead time (48 days) as a baseline for your pricing and availability strategy in Palmanova.
- For July stays, consider implementing length-of-stay discounts or slightly higher rates for bookings made less than 97 days out to capitalize on advance planning.
- Target marketing efforts for the Summer season well in advance (at least 85 days) to capture early planners.
- Monitor your own booking lead times against these Palmanova averages to identify opportunities for dynamic pricing adjustments.
Popular & Essential Airbnb Amenities in Palmanova (2025)
Amenity Prevalence
Amenity Insights for Palmanova
- Essential amenities in Palmanova that guests expect include: TV, Wifi, Heating, Essentials. Lacking these (any) could significantly impact bookings.
- Popular amenities like Air conditioning, Hot water, Kitchen are common but not universal. Offering these can provide a competitive edge.
Recommendations for Hosts
- Ensure your listing includes all essential amenities for Palmanova: TV, Wifi, Heating, Essentials.
- Prioritize adding missing essentials: TV, Wifi, Heating, Essentials.
- Consider adding popular differentiators like Air conditioning or Hot water to increase appeal.
- Highlight unique or less common amenities you offer (e.g., hot tub, dedicated workspace, EV charger) in your listing description and photos.
- Regularly check competitor amenities in Palmanova to stay competitive.
Palmanova Airbnb Guest Demographics & Profile Analysis (2025)
Guest Profile Summary for Palmanova
- The typical guest profile for Airbnb in Palmanova consists of predominantly international visitors (96%), with top international origins including United States, typically belonging to the Post-2000s (Gen Z/Alpha) group (50%), primarily speaking English or Spanish.
- Domestic travelers account for 4.4% of guests.
- Key international markets include United Kingdom (19.3%) and United States (13.7%).
- Top languages spoken are English (43.3%) followed by Spanish (12.8%).
- A significant demographic segment is the Post-2000s (Gen Z/Alpha) group, representing 50% of guests.
Recommendations for Hosts
- Focus marketing internationally, particularly towards travelers from United States.
- Tailor amenities and listing descriptions to appeal to the dominant Post-2000s (Gen Z/Alpha) demographic (e.g., highlight fast WiFi, smart home features, local guides).
- Highlight unique local experiences or amenities relevant to the primary guest profile.
- Consider seasonal promotions aligned with peak travel times for key origin markets.
Nearby Short-Term Rental Market Comparison
How does the Palmanova Airbnb market stack up against its neighbors? Compare key performance metrics like average monthly revenue, ADR, and occupancy rates in surrounding areas to understand the broader regional STR landscape.
| Market | Active Properties | Monthly Revenue | Daily Rate | Avg. Occupancy |
|---|---|---|---|---|
| sa Carroca | 98 | $10,551 | $862.81 | 52% |
| Can Germà | 25 | $9,819 | $927.22 | 47% |
| Can Tomàs | 26 | $9,321 | $878.17 | 47% |
| Es Cubells | 31 | $8,883 | $1002.54 | 54% |
| Sant Rafel de sa Creu | 46 | $7,518 | $730.00 | 45% |
| Vista Mar | 64 | $7,047 | $750.94 | 46% |
| Algaida | 79 | $6,918 | $709.08 | 48% |
| Vista Alegre | 18 | $6,413 | $1214.28 | 42% |
| Mancor de la Vall | 35 | $6,389 | $620.29 | 54% |
| Sant Josep de sa Talaia | 256 | $6,308 | $699.24 | 48% |