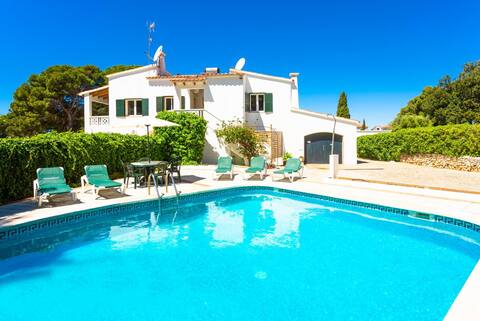
Ferreries Airbnb Market Analysis 2025: Short Term Rental Data & Vacation Rental Statistics in Balearic Islands, Spain
Is Airbnb profitable in Ferreries in 2025? Explore comprehensive Airbnb analytics for Ferreries, Balearic Islands, Spain to uncover income potential. This 2025 STR market report for Ferreries, based on AirROI data from April 2024 to March 2025, reveals key trends in the niche market of 59 active listings.
Whether you're considering an Airbnb investment in Ferreries, optimizing your existing vacation rental, or exploring rental arbitrage opportunities, understanding the Ferreries Airbnb data is crucial. Navigating the high regulation landscape is key to maximizing your short term rental income potential. Let's dive into the specifics.
Key Ferreries Airbnb Performance Metrics Overview
Monthly Airbnb Revenue Variations & Income Potential in Ferreries (2025)
Understanding the monthly revenue variations for Airbnb listings in Ferreries is key to maximizing your short term rental income potential. Seasonality significantly impacts earnings. Our analysis, based on data from the past 12 months, shows that the peak revenue month for STRs in Ferreries is typically August, while December often presents the lowest earnings, highlighting opportunities for strategic pricing adjustments during shoulder and low seasons. Explore the typical Airbnb income in Ferreries across different performance tiers:
- Best-in-class properties (Top 10%) achieve $8,425+ monthly, often utilizing dynamic pricing and superior guest experiences.
- Strong performing properties (Top 25%) earn $4,535 or more, indicating effective management and desirable locations/amenities.
- Typical properties (Median) generate around $2,531 per month, representing the average market performance.
- Entry-level properties (Bottom 25%) see earnings around $1,258, often with potential for optimization.
Average Monthly Airbnb Earnings Trend in Ferreries
Ferreries Airbnb Occupancy Rate Trends (2025)
Maximize your bookings by understanding the Ferreries STR occupancy trends. Seasonal demand shifts significantly influence how often properties are booked. Typically, Augustsees the highest demand (peak season occupancy), while March experiences the lowest (low season). Effective strategies, like adjusting minimum stays or offering promotions, can boost occupancy during slower periods. Here's how different property tiers perform in Ferreries:
- Best-in-class properties (Top 10%) achieve 70%+ occupancy, indicating high desirability and potentially optimized availability.
- Strong performing properties (Top 25%) maintain 53% or higher occupancy, suggesting good market fit and guest satisfaction.
- Typical properties (Median) have an occupancy rate around 35%.
- Entry-level properties (Bottom 25%) average 19% occupancy, potentially facing higher vacancy.
Average Monthly Occupancy Rate Trend in Ferreries
Average Daily Rate (ADR) Airbnb Trends in Ferreries (2025)
Effective short term rental pricing strategy in Ferreries involves understanding monthly ADR fluctuations. The Average Daily Rate (ADR) for Airbnb in Ferreries typically peaks in July and dips lowest during March. Leveraging Airbnb dynamic pricing tools or strategies based on this seasonality can significantly boost revenue. Here's a look at the typical nightly rates achieved:
- Best-in-class properties (Top 10%) command rates of $602+ per night, often due to premium features or locations.
- Strong performing properties (Top 25%) achieve nightly rates of $358 or more.
- Typical properties (Median) charge around $205 per night.
- Entry-level properties (Bottom 25%) earn around $142 per night.
Average Daily Rate (ADR) Trend by Month in Ferreries
Get Live Ferreries Market Intelligence 👇

Explore Real-time Analytics
Airbnb Seasonality Analysis & Trends in Ferreries (2025)
Peak Season (August, July, September)
- Revenue averages $6,909 per month
- Occupancy rates average 60.3%
- Daily rates average $385
Shoulder Season
- Revenue averages $3,118 per month
- Occupancy maintains around 37.3%
- Daily rates hold near $297
Low Season (January, March, December)
- Revenue drops to average $1,756 per month
- Occupancy decreases to average 16.2%
- Daily rates adjust to average $239
Seasonality Insights for Ferreries
- The Airbnb seasonality in Ferreries shows highly seasonal trends requiring careful strategy. While the sections above show seasonal averages, it's also insightful to look at the extremes:
- During the high season, the absolute peak month showcases Ferreries's highest earning potential, with monthly revenues capable of climbing to $8,320, occupancy reaching a high of 66.5%, and ADRs peaking at $410.
- Conversely, the slowest single month of the year, typically falling within the low season, marks the market's lowest point. In this month, revenue might dip to $1,630, occupancy could drop to 13.6%, and ADRs may adjust down to $235.
- Understanding both the seasonal averages and these monthly peaks and troughs in revenue, occupancy, and ADR is crucial for maximizing your Airbnb profit potential in Ferreries.
Seasonal Strategies for Maximizing Profit
- Peak Season: Maximize revenue through premium pricing and potentially longer minimum stays. Ensure high availability.
- Low Season: Offer competitive pricing, special promotions (e.g., extended stay discounts), and flexible cancellation policies. Target off-season travelers like remote workers or budget-conscious guests.
- Shoulder Seasons: Implement dynamic pricing that balances peak and low rates. Target weekend travelers or specific events. Offer slightly more flexible terms than peak season.
- Regularly analyze your own performance against these Ferreries seasonality benchmarks and adjust your pricing and availability strategy accordingly.
Best Areas for Airbnb Investment in Ferreries (2025)
Exploring the top neighborhoods for short-term rentals in Ferreries? This section highlights key areas, outlining why they are attractive for hosts and guests, along with notable local attractions. Consider these locations based on your target guest profile and investment strategy.
| Neighborhood / Area | Why Host Here? (Target Guests & Appeal) | Key Attractions & Landmarks |
|---|---|---|
| Es Castell | Charming coastal town with picturesque views and a rich history. Attracts visitors looking for a peaceful yet scenic getaway, with beaches and cultural experiences. | Castell de Sant Felip, Port de Maó, Cala Mesquida, Es Grau Natural Park, Mahón's historic center |
| Cala Galdana | Known for its stunning beach and beautiful surrounding cliffs, this area is ideal for families and tourists seeking outdoor activities and relaxation. | Cala Galdana Beach, Cami de Cavalls hiking trails, Water sports, Restaurants with local cuisine, Nearby natural parks |
| Ciutadella | Historic city with beautiful architecture, vibrant markets, and a lively atmosphere. Popular among tourists for its cultural sites and nightlife. | Ciutadella Cathedral, Mercat de Ciutadella, Cala Blanca, Punta nati Lighthouse, Nightlife spots |
| Mahon | The capital of Menorca, known for its natural harbor and historical importance. Attracts both history enthusiasts and tourists looking for shopping and dining experiences. | Mahon Harbour, Fortress of La Mola, Iglesia del Carmen, Restaurants along the waterfront, Museum of Menorca |
| Son Bou | Home to the longest beach in Menorca, this area is perfect for tourists looking for sun, sand, and relaxation. | Son Bou Beach, Wildlife preserves, Water sports, Family-friendly amenities, Nearby dining options |
| Binibeca | Picturesque whitewashed village known for its charming streets and beautiful beaches. A favorite for those seeking a romantic getaway or family vacation. | Binibeca Vell, Playa de Binibeca, Scenic coastal walks, Local art galleries, Restaurants with sea views |
| S'Algar | Quieter area that offers a more laid-back atmosphere with beautiful sea views. Popular among those looking for a peaceful retreat. | Diving spots, Coastal walks, Local seafood restaurants, Calas and small beaches, Natural beauty |
| Fornells | Small fishing village known for its traditional Menorcan architecture and nearby natural beauty. Great for those interested in authentic local culture. | Fornells Beach, Water sports, Local seafood cuisine, Scenic viewpoints, Traditional Menorcan village tours |
Understanding Airbnb License Requirements & STR Laws in Ferreries (2025)
Yes, Ferreries, Balearic Islands, Spain enforces high STR regulations. Obtaining a license and ensuring compliance is almost certainly required according to current 2025 STR laws. Always verify the latest short term rental regulations and Airbnb license requirements directly with local government authorities for Ferreries to ensure full compliance before hosting.
(Source: AirROI data, 2025, based on 56% licensed listings)
Top Performing Airbnb Properties in Ferreries (2025)
Benchmark your potential! Explore examples of top-performing Airbnb properties in Ferreriesbased on Trailing Twelve Month (TTM) revenue. Analyze their characteristics, revenue, occupancy rate, and ADR to understand what drives success in this market.
La Beltrana Menorca
Entire Place • 5 bedrooms
Villa Can Pere Cala Galdana Menorca
Entire Place • 4 bedrooms

Villa Vista Alegre - Cala Galdana
Entire Place • 4 bedrooms
Villa Ponent - Cala Galdana
Entire Place • 5 bedrooms
Villa Acantilado - Cala Galdana
Entire Place • 4 bedrooms
Villa Luisa
Entire Place • 3 bedrooms
Note: Performance varies based on location, size, amenities, seasonality, and management quality. Data reflects the past 12 months.
Top Performing Airbnb Hosts in Ferreries (2025)
Learn from the best! This table showcases top-performing Airbnb hosts in Ferreries based on the number of properties managed and estimated total revenue over the past year. Analyze their scale and performance metrics.
| Host Name | Properties | Grossing Revenue | Stay Reviews | Avg Rating |
|---|---|---|---|---|
| Sonne Villas | 14 | $437,411 | 276 | 4.65/5.0 |
| Menorca Habitat | 5 | $331,498 | 109 | 4.64/5.0 |
| Host #1657508 | 1 | $137,043 | 0 | 0.00/5.0 |
| Roza | 1 | $105,664 | 10 | 5.00/5.0 |
| Jose Luis | 2 | $85,170 | 114 | 4.92/5.0 |
| Host #49599016 | 5 | $84,712 | 64 | 1.98/5.0 |
| Richard | 1 | $66,034 | 10 | 4.30/5.0 |
| Solmar Villas | 2 | $61,832 | 6 | 4.67/5.0 |
| Angela | 2 | $56,042 | 34 | 4.91/5.0 |
| Mandi | 3 | $51,182 | 163 | 4.60/5.0 |
Analyzing the strategies of top hosts, such as their property selection, pricing, and guest communication, can offer valuable lessons for optimizing your own Airbnb operations in Ferreries.
Dive Deeper: Advanced Ferreries STR Market Data (2025)
Ready to unlock more insights? AirROI provides access to advanced metrics and comprehensive Airbnb data for Ferreries. Explore detailed analytics beyond this report to refine your investment strategy, optimize pricing, and maximize your vacation rental profits.
Explore Advanced MetricsFerreries Short-Term Rental Market Composition (2025): Property & Room Types
Room Type Distribution
Property Type Distribution
Market Composition Insights for Ferreries
- The Ferreries Airbnb market composition is heavily skewed towards Entire Home/Apt listings, which make up 83.1% of the 59 active rentals. This indicates strong guest preference for privacy and space.
- Looking at the property type distribution in Ferreries, House properties are the most common (67.8%), reflecting the local real estate landscape.
- Houses represent a significant 67.8% portion, catering likely to families or larger groups.
- The presence of 6.8% Hotel/Boutique listings indicates integration with traditional hospitality.
- Smaller segments like outdoor/unique, others (combined 3.4%) offer potential for unique stay experiences.
Ferreries Airbnb Room Capacity Analysis (2025): Bedroom Distribution
Distribution of Listings by Number of Bedrooms
Room Capacity Insights for Ferreries
- The dominant room capacity in Ferreries is 4 bedrooms listings, making up 27.1% of the market. This suggests a strong demand for properties suitable for families or small groups.
- Together, 4 bedrooms and 3 bedrooms properties represent 54.2% of the active Airbnb listings in Ferreries, indicating a high concentration in these sizes.
- A significant 72.8% of listings offer 3+ bedrooms, catering to larger groups and families seeking more space in Ferreries.
Ferreries Vacation Rental Guest Capacity Trends (2025)
Distribution of Listings by Guest Capacity
Guest Capacity Insights for Ferreries
- The most common guest capacity trend in Ferreries vacation rentals is listings accommodating 8+ guests (37.3%). This suggests the primary traveler segment is likely larger groups.
- Properties designed for 8+ guests and 6 guests dominate the Ferreries STR market, accounting for 66.1% of listings.
- 69.5% of properties accommodate 6+ guests, serving the market segment for larger families or group travel in Ferreries.
- On average, properties in Ferreries are equipped to host 5.8 guests.
Ferreries Airbnb Booking Patterns (2025): Available vs. Booked Days
Available Days Distribution
Booked Days Distribution
Booking Pattern Insights for Ferreries
- The most common availability pattern in Ferreries falls within the 181-270 days range, representing 49.2% of listings. This suggests many properties have significant open periods on their calendars.
- Approximately 89.9% of listings show high availability (181+ days open annually), indicating potential for increased bookings or specific owner usage patterns.
- For booked days, the 91-180 days range is most frequent in Ferreries (52.5%), reflecting common guest stay durations or potential owner blocking patterns.
- A notable 10.2% of properties secure long booking periods (181+ days booked per year), highlighting successful long-term rental strategies or significant owner usage.
Ferreries Airbnb Minimum Stay Requirements Analysis
Distribution of Listings by Minimum Night Requirement
1 Night
23 listings
44.2% of total
2 Nights
6 listings
11.5% of total
3 Nights
6 listings
11.5% of total
4-6 Nights
11 listings
21.2% of total
7-29 Nights
5 listings
9.6% of total
30+ Nights
1 listings
1.9% of total
Key Insights
- The most prevalent minimum stay requirement in Ferreries is 1 Night, adopted by 44.2% of listings. This highlights the market's preference for shorter, flexible bookings.
- Dedicated monthly rentals (30+ nights) represent a small niche (1.9%), possibly an untapped area for hosts.
Recommendations
- Align with the market by considering a 1 Night minimum stay, as 44.2% of Ferreries hosts use this setting.
- Adjust minimum nights based on seasonality – potentially shorter during low season and longer during peak demand periods in Ferreries.
Ferreries Airbnb Cancellation Policy Trends Analysis (2025)
Super Strict 30 Days
15 listings
27.8% of total
Super Strict 60 Days
2 listings
3.7% of total
Flexible
3 listings
5.6% of total
Moderate
5 listings
9.3% of total
Firm
8 listings
14.8% of total
Strict
21 listings
38.9% of total
Cancellation Policy Insights for Ferreries
- The prevailing Airbnb cancellation policy trend in Ferreries is Strict, used by 38.9% of listings.
- A majority (53.7%) of hosts in Ferreries utilize Firm or Strict policies, indicating a market where hosts prioritize booking security.
Recommendations for Hosts
- Consider adopting a Strict policy to align with the 38.9% market standard in Ferreries.
- With 38.9% using Strict terms, this is a viable option in Ferreries, particularly for high-value properties or during peak demand periods.
- Regularly review your cancellation policy against competitors and market demand shifts in Ferreries.
Ferreries STR Booking Lead Time Analysis (2025)
Average Booking Lead Time by Month
Booking Lead Time Insights for Ferreries
- The overall average booking lead time for vacation rentals in Ferreries is 101 days.
- Guests book furthest in advance for stays during August (average 145 days), likely coinciding with peak travel demand or local events.
- The shortest booking windows occur for stays in February (average 19 days), indicating more last-minute travel plans during this time.
- Seasonally, Summer (127 days avg.) sees the longest lead times, while Winter (59 days avg.) has the shortest, reflecting typical travel planning cycles.
Recommendations for Hosts
- Use the overall average lead time (101 days) as a baseline for your pricing and availability strategy in Ferreries.
- For August stays, consider implementing length-of-stay discounts or slightly higher rates for bookings made less than 145 days out to capitalize on advance planning.
- Target marketing efforts for the Summer season well in advance (at least 127 days) to capture early planners.
- Monitor your own booking lead times against these Ferreries averages to identify opportunities for dynamic pricing adjustments.
Popular & Essential Airbnb Amenities in Ferreries (2025)
Amenity Prevalence
Amenity Insights for Ferreries
- Popular amenities like Wifi, Kitchen, Washer are common but not universal. Offering these can provide a competitive edge.
- A pool is a highly desired but not standard amenity, making it a key feature for attracting guests seeking leisure in Ferreries.
- Warning: Wifi is not universally provided but is considered essential globally. Ensure reliable Wifi is offered.
Recommendations for Hosts
- Consider adding popular differentiators like Wifi or Kitchen to increase appeal.
- Highlight unique or less common amenities you offer (e.g., hot tub, dedicated workspace, EV charger) in your listing description and photos.
- Regularly check competitor amenities in Ferreries to stay competitive.
Ferreries Airbnb Guest Demographics & Profile Analysis (2025)
Guest Profile Summary for Ferreries
- The typical guest profile for Airbnb in Ferreries consists of predominantly international visitors (86%), with top international origins including United Kingdom, typically belonging to the Post-2000s (Gen Z/Alpha) group (50%), primarily speaking English or French.
- Domestic travelers account for 13.7% of guests.
- Key international markets include France (43.5%) and United Kingdom (20.6%).
- Top languages spoken are English (39.8%) followed by French (23.9%).
- A significant demographic segment is the Post-2000s (Gen Z/Alpha) group, representing 50% of guests.
Recommendations for Hosts
- Focus marketing internationally, particularly towards travelers from United Kingdom.
- Tailor amenities and listing descriptions to appeal to the dominant Post-2000s (Gen Z/Alpha) demographic (e.g., highlight fast WiFi, smart home features, local guides).
- Highlight unique local experiences or amenities relevant to the primary guest profile.
- Consider seasonal promotions aligned with peak travel times for key origin markets.
Nearby Short-Term Rental Market Comparison
How does the Ferreries Airbnb market stack up against its neighbors? Compare key performance metrics like average monthly revenue, ADR, and occupancy rates in surrounding areas to understand the broader regional STR landscape.
| Market | Active Properties | Monthly Revenue | Daily Rate | Avg. Occupancy |
|---|---|---|---|---|
| Algaida | 79 | $6,918 | $709.08 | 48% |
| Mancor de la Vall | 35 | $6,389 | $620.29 | 54% |
| Deià | 60 | $5,880 | $663.85 | 53% |
| ses Illetes | 23 | $5,772 | $630.49 | 52% |
| Andratx | 167 | $5,668 | $610.37 | 50% |
| Marratxí | 76 | $5,454 | $623.67 | 47% |
| Fornalutx | 87 | $5,202 | $439.26 | 55% |
| Montuïri | 41 | $5,186 | $572.75 | 52% |
| Bunyola | 60 | $5,129 | $486.16 | 50% |
| Badia Blava | 35 | $4,973 | $801.83 | 46% |