Estellencs Airbnb Market Analysis 2025: Short Term Rental Data & Vacation Rental Statistics in Balearic Islands, Spain
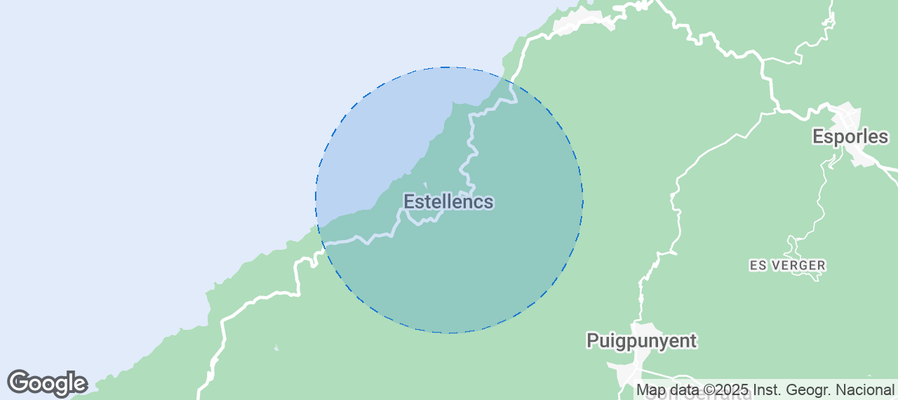
Is Airbnb profitable in Estellencs in 2025? Explore comprehensive Airbnb analytics for Estellencs, Balearic Islands, Spain to uncover income potential. This 2025 STR market report for Estellencs, based on AirROI data from April 2024 to March 2025, reveals key trends in the niche market of 26 active listings.
Whether you're considering an Airbnb investment in Estellencs, optimizing your existing vacation rental, or exploring rental arbitrage opportunities, understanding the Estellencs Airbnb data is crucial. Navigating the high regulation landscape is key to maximizing your short term rental income potential. Let's dive into the specifics.
Key Estellencs Airbnb Performance Metrics Overview
Monthly Airbnb Revenue Variations & Income Potential in Estellencs (2025)
Understanding the monthly revenue variations for Airbnb listings in Estellencs is key to maximizing your short term rental income potential. Seasonality significantly impacts earnings. Our analysis, based on data from the past 12 months, shows that the peak revenue month for STRs in Estellencs is typically May, while March often presents the lowest earnings, highlighting opportunities for strategic pricing adjustments during shoulder and low seasons. Explore the typical Airbnb income in Estellencs across different performance tiers:
- Best-in-class properties (Top 10%) achieve $9,794+ monthly, often utilizing dynamic pricing and superior guest experiences.
- Strong performing properties (Top 25%) earn $5,671 or more, indicating effective management and desirable locations/amenities.
- Typical properties (Median) generate around $2,977 per month, representing the average market performance.
- Entry-level properties (Bottom 25%) see earnings around $1,922, often with potential for optimization.
Average Monthly Airbnb Earnings Trend in Estellencs
Estellencs Airbnb Occupancy Rate Trends (2025)
Maximize your bookings by understanding the Estellencs STR occupancy trends. Seasonal demand shifts significantly influence how often properties are booked. Typically, Augustsees the highest demand (peak season occupancy), while January experiences the lowest (low season). Effective strategies, like adjusting minimum stays or offering promotions, can boost occupancy during slower periods. Here's how different property tiers perform in Estellencs:
- Best-in-class properties (Top 10%) achieve 75%+ occupancy, indicating high desirability and potentially optimized availability.
- Strong performing properties (Top 25%) maintain 58% or higher occupancy, suggesting good market fit and guest satisfaction.
- Typical properties (Median) have an occupancy rate around 45%.
- Entry-level properties (Bottom 25%) average 28% occupancy, potentially facing higher vacancy.
Average Monthly Occupancy Rate Trend in Estellencs
Average Daily Rate (ADR) Airbnb Trends in Estellencs (2025)
Effective short term rental pricing strategy in Estellencs involves understanding monthly ADR fluctuations. The Average Daily Rate (ADR) for Airbnb in Estellencs typically peaks in August and dips lowest during March. Leveraging Airbnb dynamic pricing tools or strategies based on this seasonality can significantly boost revenue. Here's a look at the typical nightly rates achieved:
- Best-in-class properties (Top 10%) command rates of $575+ per night, often due to premium features or locations.
- Strong performing properties (Top 25%) achieve nightly rates of $382 or more.
- Typical properties (Median) charge around $249 per night.
- Entry-level properties (Bottom 25%) earn around $158 per night.
Average Daily Rate (ADR) Trend by Month in Estellencs
Get Live Estellencs Market Intelligence 👇
Explore Real-time Analytics
Airbnb Seasonality Analysis & Trends in Estellencs (2025)
Peak Season (May, June, April)
- Revenue averages $12,885 per month
- Occupancy rates average 60.8%
- Daily rates average $445
Shoulder Season
- Revenue averages $3,999 per month
- Occupancy maintains around 45.2%
- Daily rates hold near $380
Low Season (February, March, November)
- Revenue drops to average $1,497 per month
- Occupancy decreases to average 33.6%
- Daily rates adjust to average $222
Seasonality Insights for Estellencs
- The Airbnb seasonality in Estellencs shows highly seasonal trends requiring careful strategy. While the sections above show seasonal averages, it's also insightful to look at the extremes:
- During the high season, the absolute peak month showcases Estellencs's highest earning potential, with monthly revenues capable of climbing to $15,148, occupancy reaching a high of 72.8%, and ADRs peaking at $478.
- Conversely, the slowest single month of the year, typically falling within the low season, marks the market's lowest point. In this month, revenue might dip to $1,178, occupancy could drop to 15.4%, and ADRs may adjust down to $214.
- Understanding both the seasonal averages and these monthly peaks and troughs in revenue, occupancy, and ADR is crucial for maximizing your Airbnb profit potential in Estellencs.
Seasonal Strategies for Maximizing Profit
- Peak Season: Maximize revenue through premium pricing and potentially longer minimum stays. Ensure high availability.
- Low Season: Offer competitive pricing, special promotions (e.g., extended stay discounts), and flexible cancellation policies. Target off-season travelers like remote workers or budget-conscious guests.
- Shoulder Seasons: Implement dynamic pricing that balances peak and low rates. Target weekend travelers or specific events. Offer slightly more flexible terms than peak season.
- Regularly analyze your own performance against these Estellencs seasonality benchmarks and adjust your pricing and availability strategy accordingly.
Best Areas for Airbnb Investment in Estellencs (2025)
Exploring the top neighborhoods for short-term rentals in Estellencs? This section highlights key areas, outlining why they are attractive for hosts and guests, along with notable local attractions. Consider these locations based on your target guest profile and investment strategy.
| Neighborhood / Area | Why Host Here? (Target Guests & Appeal) | Key Attractions & Landmarks |
|---|---|---|
| Estellencs Village | Charming traditional village offering stunning views of the Tramuntana mountains and proximity to the coastline. Ideal for visitors looking for a peaceful getaway amidst nature. | Sant Bartomeu Church, Local Hiking Trails, Mirador de Estellencs, Beaches of Mallorca, Traditional Mallorcan Cuisine |
| Cala Estellencs | A beautiful cove area known for its crystal-clear waters and tranquility. Perfect for beach lovers and those seeking a more secluded vacation. | Cala Estellencs Beach, Scenic Coastal Walks, Local Seafood Restaurants, Sunbathing Spots, Water Activities |
| Son Marroig | Historical estate with panoramic views of the sea and mountains, famous for its beautiful gardens and folkloric architecture. Great for couples or those seeking a romantic retreat. | Son Marroig Museum, Views of the Coast, Photography Opportunities, Walking Trails, Cultural History |
| Puig de Galatzó | A natural park featuring various hiking trails and rich biodiversity, appealing to nature lovers and outdoor enthusiasts. | Hiking Trails, Nature Observation, Breathtaking Views, Picnic Areas, Adventure Activities |
| Sa Foradada | An iconic viewpoint known for its breathtaking sunsets and scenic beauty, popular with photographers and nature lovers. | Sa Foradada Viewpoint, Sunset Spots, Restaurant with a View, Walking Trails, Local Flora and Fauna |
| Mallorca’s Tramuntana | A UNESCO World Heritage Site with breathtaking landscapes, this area is ideal for visitors looking to explore nature and traditional Mallorcan culture. | Hiking and Cycling Routes, Traditionally Built Villages, Scenic Drives, Cultural Heritage Sites, Flora and Fauna |
| La Granja de Esporles | A historic estate showcasing Mallorca's agricultural history, this area is great for families and those interested in cultural activities. | Agricultural Museum, Gardens and Walks, Local Artisanal Products, Cultural Events, Family Friendly Activities |
| Deià | Renowned for its artistic history and stunning landscapes, Deià attracts visitors looking for culture, art, and beautiful surroundings. | Cultural Festivals, Art Galleries, Local Shops and Cafes, Hiking Trails, Famous Residents' History |
Understanding Airbnb License Requirements & STR Laws in Estellencs (2025)
Yes, Estellencs, Balearic Islands, Spain enforces high STR regulations. Obtaining a license and ensuring compliance is almost certainly required according to current 2025 STR laws. Always verify the latest short term rental regulations and Airbnb license requirements directly with local government authorities for Estellencs to ensure full compliance before hosting.
(Source: AirROI data, 2025, based on 38% licensed listings)
Top Performing Airbnb Properties in Estellencs (2025)
Benchmark your potential! Explore examples of top-performing Airbnb properties in Estellencsbased on Trailing Twelve Month (TTM) revenue. Analyze their characteristics, revenue, occupancy rate, and ADR to understand what drives success in this market.
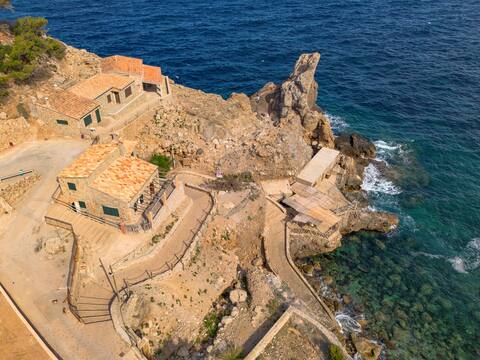
Cala Estellencs House by Slow Villas
Entire Place • 2 bedrooms

Coll d'es Pi - Slow Family Holidays
Entire Place • 5 bedrooms
M4r Villa Es Port Views
Entire Place • 4 bedrooms

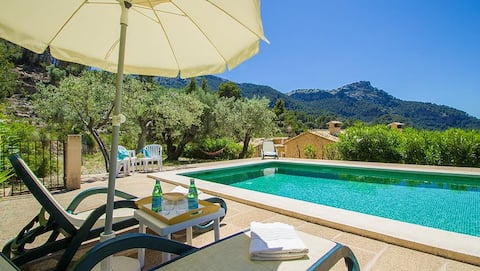
FINCA SON TORRAT
Entire Place • 3 bedrooms
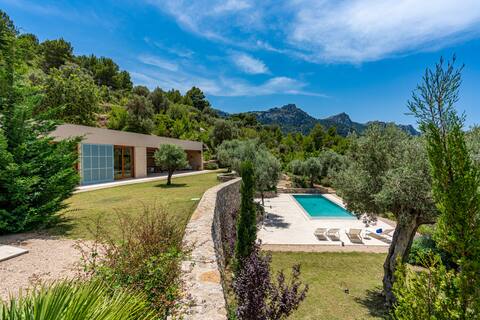
Son Llarg - Rustic and Beautiful Villa in Estallen
Entire Place • 5 bedrooms
6 bedroom amazing home in Estellencs
Entire Place • 6 bedrooms
Note: Performance varies based on location, size, amenities, seasonality, and management quality. Data reflects the past 12 months.
Top Performing Airbnb Hosts in Estellencs (2025)
Learn from the best! This table showcases top-performing Airbnb hosts in Estellencs based on the number of properties managed and estimated total revenue over the past year. Analyze their scale and performance metrics.
| Host Name | Properties | Grossing Revenue | Stay Reviews | Avg Rating |
|---|---|---|---|---|
| Sabina | 9 | $168,031 | 45 | 2.10/5.0 |
| Slow | 1 | $119,265 | 6 | 4.83/5.0 |
| Marga | 1 | $83,275 | 120 | 4.85/5.0 |
| Sergio | 1 | $54,863 | 8 | 4.38/5.0 |
| Catalina | 1 | $46,546 | 152 | 4.80/5.0 |
| Host #173474947 | 2 | $44,691 | 0 | 0.00/5.0 |
| Carlos | 1 | $42,321 | 16 | 4.75/5.0 |
| Novasol | 1 | $41,770 | 3 | 4.33/5.0 |
| Jaime | 1 | $28,729 | 85 | 4.67/5.0 |
| 3 Amigas De Estellencs | 1 | $25,504 | 105 | 4.70/5.0 |
Analyzing the strategies of top hosts, such as their property selection, pricing, and guest communication, can offer valuable lessons for optimizing your own Airbnb operations in Estellencs.
Dive Deeper: Advanced Estellencs STR Market Data (2025)
Ready to unlock more insights? AirROI provides access to advanced metrics and comprehensive Airbnb data for Estellencs. Explore detailed analytics beyond this report to refine your investment strategy, optimize pricing, and maximize your vacation rental profits.
Explore Advanced MetricsEstellencs Short-Term Rental Market Composition (2025): Property & Room Types
Room Type Distribution
Property Type Distribution
Market Composition Insights for Estellencs
- The Estellencs Airbnb market composition is heavily skewed towards Entire Home/Apt listings, which make up 65.4% of the 26 active rentals. This indicates strong guest preference for privacy and space.
- However, a notable 34.6% share for Private Rooms suggests opportunities for budget-conscious travelers or hosts renting out spare rooms.
- Looking at the property type distribution in Estellencs, House properties are the most common (61.5%), reflecting the local real estate landscape.
- Houses represent a significant 61.5% portion, catering likely to families or larger groups.
- The presence of 34.6% Hotel/Boutique listings indicates integration with traditional hospitality.
- Smaller segments like apartment/condo (combined 3.8%) offer potential for unique stay experiences.
Estellencs Airbnb Room Capacity Analysis (2025): Bedroom Distribution
Distribution of Listings by Number of Bedrooms
Room Capacity Insights for Estellencs
- The dominant room capacity in Estellencs is 1 bedroom listings, making up 38.5% of the market. This suggests a strong demand for properties suitable for couples or solo travelers.
- Together, 1 bedroom and 2 bedrooms properties represent 61.6% of the active Airbnb listings in Estellencs, indicating a high concentration in these sizes.
- A significant 38.4% of listings offer 3+ bedrooms, catering to larger groups and families seeking more space in Estellencs.
Estellencs Vacation Rental Guest Capacity Trends (2025)
Distribution of Listings by Guest Capacity
Guest Capacity Insights for Estellencs
- The most common guest capacity trend in Estellencs vacation rentals is listings accommodating 2 guests (38.5%). This suggests the primary traveler segment is likely couples or solo travelers.
- Properties designed for 2 guests and 6 guests dominate the Estellencs STR market, accounting for 61.6% of listings.
- 34.6% of properties accommodate 6+ guests, serving the market segment for larger families or group travel in Estellencs.
- On average, properties in Estellencs are equipped to host 4.2 guests.
Estellencs Airbnb Booking Patterns (2025): Available vs. Booked Days
Available Days Distribution
Booked Days Distribution
Booking Pattern Insights for Estellencs
- The most common availability pattern in Estellencs falls within the 271-366 days range, representing 50% of listings. This suggests many properties have significant open periods on their calendars.
- Approximately 73.1% of listings show high availability (181+ days open annually), indicating potential for increased bookings or specific owner usage patterns.
- For booked days, the 31-90 days range is most frequent in Estellencs (34.6%), reflecting common guest stay durations or potential owner blocking patterns.
- A notable 26.9% of properties secure long booking periods (181+ days booked per year), highlighting successful long-term rental strategies or significant owner usage.
Estellencs Airbnb Minimum Stay Requirements Analysis
Distribution of Listings by Minimum Night Requirement
2 Nights
1 listings
3.8% of total
3 Nights
1 listings
3.8% of total
4-6 Nights
6 listings
23.1% of total
7-29 Nights
1 listings
3.8% of total
30+ Nights
17 listings
65.4% of total
Key Insights
- The most prevalent minimum stay requirement in Estellencs is 30+ Nights, adopted by 65.4% of listings. This highlights the market's preference for longer commitments.
- Very short stays (1-2 nights) are less common (3.8%), suggesting hosts prefer slightly longer bookings to optimize turnover.
- A significant segment (65.4%) caters to monthly stays (30+ nights) in Estellencs, pointing to opportunities in the extended-stay market.
Recommendations
- Align with the market by considering a 30+ Nights minimum stay, as 65.4% of Estellencs hosts use this setting.
- Explore offering discounts for stays of 30+ nights to attract the 65.4% of the market seeking extended stays.
- Adjust minimum nights based on seasonality – potentially shorter during low season and longer during peak demand periods in Estellencs.
Estellencs Airbnb Cancellation Policy Trends Analysis (2025)
Super Strict 60 Days
3 listings
18.8% of total
Flexible
1 listings
6.3% of total
Moderate
5 listings
31.3% of total
Firm
2 listings
12.5% of total
Strict
5 listings
31.3% of total
Cancellation Policy Insights for Estellencs
- The prevailing Airbnb cancellation policy trend in Estellencs is Moderate, used by 31.3% of listings.
- There's a relatively balanced mix between guest-friendly (37.6%) and stricter (43.8%) policies, offering choices for different guest needs.
Recommendations for Hosts
- Consider adopting a Moderate policy to align with the 31.3% market standard in Estellencs.
- With 31.3% using Strict terms, this is a viable option in Estellencs, particularly for high-value properties or during peak demand periods.
- Regularly review your cancellation policy against competitors and market demand shifts in Estellencs.
Estellencs STR Booking Lead Time Analysis (2025)
Average Booking Lead Time by Month
Booking Lead Time Insights for Estellencs
- The overall average booking lead time for vacation rentals in Estellencs is 53 days.
- Guests book furthest in advance for stays during November (average 126 days), likely coinciding with peak travel demand or local events.
- The shortest booking windows occur for stays in March (average 42 days), indicating more last-minute travel plans during this time.
- Seasonally, Summer (97 days avg.) sees the longest lead times, while Spring (69 days avg.) has the shortest, reflecting typical travel planning cycles.
Recommendations for Hosts
- Use the overall average lead time (53 days) as a baseline for your pricing and availability strategy in Estellencs.
- For November stays, consider implementing length-of-stay discounts or slightly higher rates for bookings made less than 126 days out to capitalize on advance planning.
- Target marketing efforts for the Summer season well in advance (at least 97 days) to capture early planners.
- Monitor your own booking lead times against these Estellencs averages to identify opportunities for dynamic pricing adjustments.
Popular & Essential Airbnb Amenities in Estellencs (2025)
Amenity Prevalence
Amenity Insights for Estellencs
- Essential amenities in Estellencs that guests expect include: Wifi, TV. Lacking these (any) could significantly impact bookings.
- Popular amenities like Heating, Hot water, Air conditioning are common but not universal. Offering these can provide a competitive edge.
Recommendations for Hosts
- Ensure your listing includes all essential amenities for Estellencs: Wifi, TV.
- Consider adding popular differentiators like Heating or Hot water to increase appeal.
- Highlight unique or less common amenities you offer (e.g., hot tub, dedicated workspace, EV charger) in your listing description and photos.
- Regularly check competitor amenities in Estellencs to stay competitive.
Estellencs Airbnb Guest Demographics & Profile Analysis (2025)
Guest Profile Summary for Estellencs
- The typical guest profile for Airbnb in Estellencs consists of predominantly international visitors (98%), with top international origins including Germany, typically belonging to the Post-2000s (Gen Z/Alpha) group (50%), primarily speaking English or French.
- Domestic travelers account for 2.4% of guests.
- Key international markets include United Kingdom (22.4%) and Germany (22.4%).
- Top languages spoken are English (44.6%) followed by French (13%).
- A significant demographic segment is the Post-2000s (Gen Z/Alpha) group, representing 50% of guests.
Recommendations for Hosts
- Focus marketing internationally, particularly towards travelers from Germany.
- Tailor amenities and listing descriptions to appeal to the dominant Post-2000s (Gen Z/Alpha) demographic (e.g., highlight fast WiFi, smart home features, local guides).
- Highlight unique local experiences or amenities relevant to the primary guest profile.
- Consider seasonal promotions aligned with peak travel times for key origin markets.
Nearby Short-Term Rental Market Comparison
How does the Estellencs Airbnb market stack up against its neighbors? Compare key performance metrics like average monthly revenue, ADR, and occupancy rates in surrounding areas to understand the broader regional STR landscape.
| Market | Active Properties | Monthly Revenue | Daily Rate | Avg. Occupancy |
|---|---|---|---|---|
| sa Carroca | 98 | $10,551 | $862.81 | 52% |
| Can Germà | 25 | $9,819 | $927.22 | 47% |
| Can Tomàs | 26 | $9,321 | $878.17 | 47% |
| Es Cubells | 31 | $8,883 | $1002.54 | 54% |
| Sant Rafel de sa Creu | 46 | $7,518 | $730.00 | 45% |
| Vista Mar | 64 | $7,047 | $750.94 | 46% |
| Algaida | 79 | $6,918 | $709.08 | 48% |
| Vista Alegre | 18 | $6,413 | $1214.28 | 42% |
| Mancor de la Vall | 35 | $6,389 | $620.29 | 54% |
| Sant Josep de sa Talaia | 256 | $6,308 | $699.24 | 48% |