es Castell Airbnb Market Analysis 2025: Short Term Rental Data & Vacation Rental Statistics in Balearic Islands, Spain
Is Airbnb profitable in es Castell in 2025? Explore comprehensive Airbnb analytics for es Castell, Balearic Islands, Spain to uncover income potential. This 2025 STR market report for es Castell, based on AirROI data from April 2024 to March 2025, reveals key trends in the niche market of 29 active listings.
Whether you're considering an Airbnb investment in es Castell, optimizing your existing vacation rental, or exploring rental arbitrage opportunities, understanding the es Castell Airbnb data is crucial. Navigating the high regulation landscape is key to maximizing your short term rental income potential. Let's dive into the specifics.
Key es Castell Airbnb Performance Metrics Overview
Monthly Airbnb Revenue Variations & Income Potential in es Castell (2025)
Understanding the monthly revenue variations for Airbnb listings in es Castell is key to maximizing your short term rental income potential. Seasonality significantly impacts earnings. Our analysis, based on data from the past 12 months, shows that the peak revenue month for STRs in es Castell is typically August, while December often presents the lowest earnings, highlighting opportunities for strategic pricing adjustments during shoulder and low seasons. Explore the typical Airbnb income in es Castell across different performance tiers:
- Best-in-class properties (Top 10%) achieve $7,934+ monthly, often utilizing dynamic pricing and superior guest experiences.
- Strong performing properties (Top 25%) earn $4,260 or more, indicating effective management and desirable locations/amenities.
- Typical properties (Median) generate around $2,421 per month, representing the average market performance.
- Entry-level properties (Bottom 25%) see earnings around $1,351, often with potential for optimization.
Average Monthly Airbnb Earnings Trend in es Castell
es Castell Airbnb Occupancy Rate Trends (2025)
Maximize your bookings by understanding the es Castell STR occupancy trends. Seasonal demand shifts significantly influence how often properties are booked. Typically, Augustsees the highest demand (peak season occupancy), while December experiences the lowest (low season). Effective strategies, like adjusting minimum stays or offering promotions, can boost occupancy during slower periods. Here's how different property tiers perform in es Castell:
- Best-in-class properties (Top 10%) achieve 75%+ occupancy, indicating high desirability and potentially optimized availability.
- Strong performing properties (Top 25%) maintain 52% or higher occupancy, suggesting good market fit and guest satisfaction.
- Typical properties (Median) have an occupancy rate around 30%.
- Entry-level properties (Bottom 25%) average 15% occupancy, potentially facing higher vacancy.
Average Monthly Occupancy Rate Trend in es Castell
Average Daily Rate (ADR) Airbnb Trends in es Castell (2025)
Effective short term rental pricing strategy in es Castell involves understanding monthly ADR fluctuations. The Average Daily Rate (ADR) for Airbnb in es Castell typically peaks in November and dips lowest during October. Leveraging Airbnb dynamic pricing tools or strategies based on this seasonality can significantly boost revenue. Here's a look at the typical nightly rates achieved:
- Best-in-class properties (Top 10%) command rates of $680+ per night, often due to premium features or locations.
- Strong performing properties (Top 25%) achieve nightly rates of $365 or more.
- Typical properties (Median) charge around $182 per night.
- Entry-level properties (Bottom 25%) earn around $119 per night.
Average Daily Rate (ADR) Trend by Month in es Castell
Get Live es Castell Market Intelligence 👇

Explore Real-time Analytics
Airbnb Seasonality Analysis & Trends in es Castell (2025)
Peak Season (August, July, September)
- Revenue averages $6,294 per month
- Occupancy rates average 55.3%
- Daily rates average $295
Shoulder Season
- Revenue averages $3,111 per month
- Occupancy maintains around 34.8%
- Daily rates hold near $288
Low Season (January, February, December)
- Revenue drops to average $1,251 per month
- Occupancy decreases to average 23.5%
- Daily rates adjust to average $308
Seasonality Insights for es Castell
- The Airbnb seasonality in es Castell shows highly seasonal trends requiring careful strategy. While the sections above show seasonal averages, it's also insightful to look at the extremes:
- During the high season, the absolute peak month showcases es Castell's highest earning potential, with monthly revenues capable of climbing to $7,549, occupancy reaching a high of 60.8%, and ADRs peaking at $316.
- Conversely, the slowest single month of the year, typically falling within the low season, marks the market's lowest point. In this month, revenue might dip to $1,133, occupancy could drop to 19.4%, and ADRs may adjust down to $263.
- Understanding both the seasonal averages and these monthly peaks and troughs in revenue, occupancy, and ADR is crucial for maximizing your Airbnb profit potential in es Castell.
Seasonal Strategies for Maximizing Profit
- Peak Season: Maximize revenue through premium pricing and potentially longer minimum stays. Ensure high availability.
- Low Season: Offer competitive pricing, special promotions (e.g., extended stay discounts), and flexible cancellation policies. Target off-season travelers like remote workers or budget-conscious guests.
- Shoulder Seasons: Implement dynamic pricing that balances peak and low rates. Target weekend travelers or specific events. Offer slightly more flexible terms than peak season.
- Regularly analyze your own performance against these es Castell seasonality benchmarks and adjust your pricing and availability strategy accordingly.
Best Areas for Airbnb Investment in es Castell (2025)
Exploring the top neighborhoods for short-term rentals in es Castell? This section highlights key areas, outlining why they are attractive for hosts and guests, along with notable local attractions. Consider these locations based on your target guest profile and investment strategy.
| Neighborhood / Area | Why Host Here? (Target Guests & Appeal) | Key Attractions & Landmarks |
|---|---|---|
| Cala Blanca | A beautiful beach area with clear waters and stunning scenery, ideal for families and beach lovers seeking relaxation and sun. | Cala Blanca Beach, Parque de la Paz, Water sports like snorkeling, Scenic coastal walks, Nearby restaurants and cafes |
| Cala de Font | A popular cove that offers stunning views, calm waters, and is suitable for swimming. It's perfect for vacationers who enjoy a quieter, more secluded beach experience. | Cala de Font Beach, Cliffside walks, Sunset views, Local seafood restaurants, Explore nearby coves |
| Es Castell town center | A charming town with traditional architecture and a rich history. It's a great location for guests interested in culture, dining, and local experiences. | Castillo de San Felipe, Local markets, Seafront promenade, Restaurants with local cuisine, Cultural events and festivals |
| Punta Prima | A family-friendly area with beautiful beaches and a variety of amenities. Suitable for travelers looking for a relaxing beach holiday. | Punta Prima Beach, Water sports activities, Local amenities including shops and restaurants, Family-friendly entertainment, Scenic walks along the coast |
| Cala Mesquida | Known for its natural beauty and pristine beaches, this area attracts nature lovers and those seeking tranquility away from the hustle and bustle. | Cala Mesquida Beach, Nature reserves and hiking trails, Bird watching, Quiet picnic spots, Crystal clear waters for swimming |
| Poblado de Es Castell | A picturesque village with a local vibe, offering easy access to both the coast and inland attractions. Perfect for guests wanting an authentic experience. | Local handicraft shops, Traditional eateries, Nearby scenic viewpoints, Community festivals, Historic sites |
| Es Cale de Sant Esteve | A beautiful, tranquil area known for its crystal-clear waters and stunning landscapes, perfect for relaxation and exploring marine life. | Sant Esteve Beach, Snorkeling opportunities, Scenic coastal paths, Local seafood restaurants, Sunset views |
| Cala de Sant Antonio | A great spot for vacationers looking for a beach with vibrant nightlife and water activities. Perfect for younger visitors and party-goers. | Sant Antonio Beach, Beach bars and clubs, Water sports rentals, Nightlife opportunities, Local entertainment events |
Understanding Airbnb License Requirements & STR Laws in es Castell (2025)
Yes, es Castell, Balearic Islands, Spain enforces high STR regulations. Obtaining a license and ensuring compliance is almost certainly required according to current 2025 STR laws. Always verify the latest short term rental regulations and Airbnb license requirements directly with local government authorities for es Castell to ensure full compliance before hosting.
(Source: AirROI data, 2025, based on 45% licensed listings)
Top Performing Airbnb Properties in es Castell (2025)
Benchmark your potential! Explore examples of top-performing Airbnb properties in es Castellbased on Trailing Twelve Month (TTM) revenue. Analyze their characteristics, revenue, occupancy rate, and ADR to understand what drives success in this market.
Villa "Xaloc" bord de mer - Mao
Entire Place • 4 bedrooms
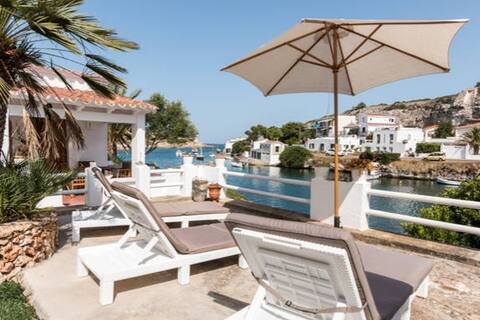
Fantastic house in front of the sea
Entire Place • 2 bedrooms

Casa Bárbara
Entire Place • 6 bedrooms
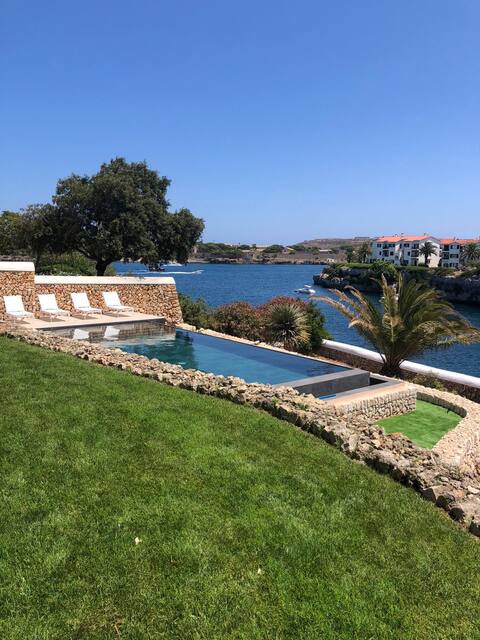
Preciosa casa con piscina
Entire Place • 5 bedrooms
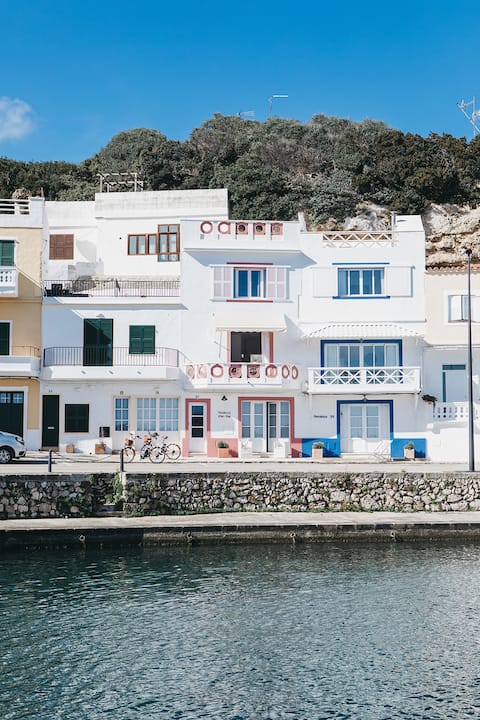
Fonduco
Entire Place • 2 bedrooms
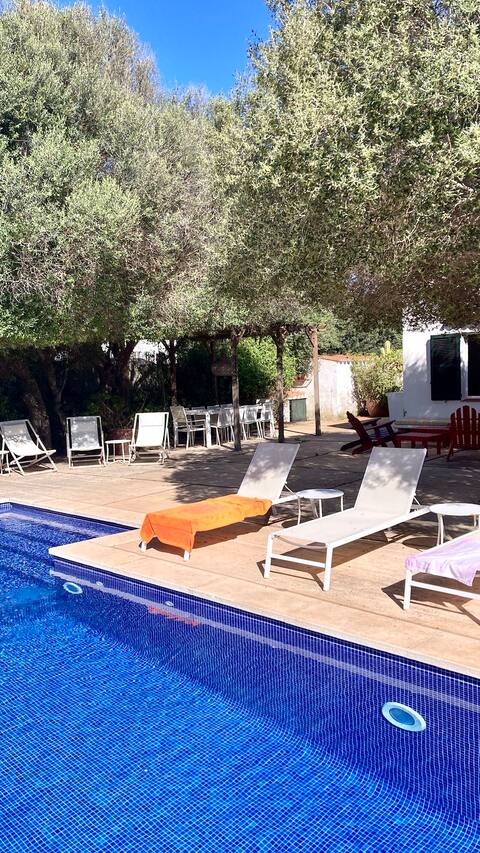
Hort des Milord - Villa en Es Castell
Entire Place • 5 bedrooms
Note: Performance varies based on location, size, amenities, seasonality, and management quality. Data reflects the past 12 months.
Top Performing Airbnb Hosts in es Castell (2025)
Learn from the best! This table showcases top-performing Airbnb hosts in es Castell based on the number of properties managed and estimated total revenue over the past year. Analyze their scale and performance metrics.
| Host Name | Properties | Grossing Revenue | Stay Reviews | Avg Rating |
|---|---|---|---|---|
| Anja | 2 | $102,929 | 58 | 4.88/5.0 |
| Lovely Mediterrannean | 1 | $93,499 | 7 | 5.00/5.0 |
| Pardela | 5 | $90,431 | 153 | 3.81/5.0 |
| Júlia | 1 | $82,788 | 30 | 5.00/5.0 |
| Menorca Habitat | 2 | $62,413 | 26 | 4.70/5.0 |
| Host #578780715 | 1 | $43,603 | 0 | 0.00/5.0 |
| Anne | 1 | $34,073 | 7 | 4.86/5.0 |
| Sylvie,Annick | 1 | $33,804 | 6 | 5.00/5.0 |
| Holidays | 1 | $33,255 | 22 | 4.32/5.0 |
| Holidu | 1 | $31,482 | 7 | 4.29/5.0 |
Analyzing the strategies of top hosts, such as their property selection, pricing, and guest communication, can offer valuable lessons for optimizing your own Airbnb operations in es Castell.
Dive Deeper: Advanced es Castell STR Market Data (2025)
Ready to unlock more insights? AirROI provides access to advanced metrics and comprehensive Airbnb data for es Castell. Explore detailed analytics beyond this report to refine your investment strategy, optimize pricing, and maximize your vacation rental profits.
Explore Advanced Metricses Castell Short-Term Rental Market Composition (2025): Property & Room Types
Room Type Distribution
Property Type Distribution
Market Composition Insights for es Castell
- The es Castell Airbnb market composition is heavily skewed towards Entire Home/Apt listings, which make up 79.3% of the 29 active rentals. This indicates strong guest preference for privacy and space.
- Looking at the property type distribution in es Castell, House properties are the most common (58.6%), reflecting the local real estate landscape.
- Houses represent a significant 58.6% portion, catering likely to families or larger groups.
- The presence of 17.2% Hotel/Boutique listings indicates integration with traditional hospitality.
es Castell Airbnb Room Capacity Analysis (2025): Bedroom Distribution
Distribution of Listings by Number of Bedrooms
Room Capacity Insights for es Castell
- The dominant room capacity in es Castell is 3 bedrooms listings, making up 24.1% of the market. This suggests a strong demand for properties suitable for families or small groups.
- Together, 3 bedrooms and 5+ bedrooms properties represent 48.2% of the active Airbnb listings in es Castell, indicating a high concentration in these sizes.
- A significant 62.0% of listings offer 3+ bedrooms, catering to larger groups and families seeking more space in es Castell.
es Castell Vacation Rental Guest Capacity Trends (2025)
Distribution of Listings by Guest Capacity
Guest Capacity Insights for es Castell
- The most common guest capacity trend in es Castell vacation rentals is listings accommodating 8+ guests (31%). This suggests the primary traveler segment is likely larger groups.
- Properties designed for 8+ guests and 6 guests dominate the es Castell STR market, accounting for 55.1% of listings.
- 55.1% of properties accommodate 6+ guests, serving the market segment for larger families or group travel in es Castell.
- On average, properties in es Castell are equipped to host 5.2 guests.
es Castell Airbnb Booking Patterns (2025): Available vs. Booked Days
Available Days Distribution
Booked Days Distribution
Booking Pattern Insights for es Castell
- The most common availability pattern in es Castell falls within the 271-366 days range, representing 58.6% of listings. This suggests many properties have significant open periods on their calendars.
- Approximately 89.6% of listings show high availability (181+ days open annually), indicating potential for increased bookings or specific owner usage patterns.
- For booked days, the 31-90 days range is most frequent in es Castell (44.8%), reflecting common guest stay durations or potential owner blocking patterns.
- A notable 10.3% of properties secure long booking periods (181+ days booked per year), highlighting successful long-term rental strategies or significant owner usage.
es Castell Airbnb Minimum Stay Requirements Analysis
Distribution of Listings by Minimum Night Requirement
1 Night
9 listings
36% of total
2 Nights
1 listings
4% of total
3 Nights
3 listings
12% of total
4-6 Nights
8 listings
32% of total
7-29 Nights
4 listings
16% of total
Key Insights
- The most prevalent minimum stay requirement in es Castell is 1 Night, adopted by 36% of listings. This highlights the market's preference for shorter, flexible bookings.
Recommendations
- Align with the market by considering a 1 Night minimum stay, as 36% of es Castell hosts use this setting.
- Adjust minimum nights based on seasonality – potentially shorter during low season and longer during peak demand periods in es Castell.
es Castell Airbnb Cancellation Policy Trends Analysis (2025)
Flexible
1 listings
4.2% of total
Moderate
1 listings
4.2% of total
Firm
5 listings
20.8% of total
Strict
17 listings
70.8% of total
Cancellation Policy Insights for es Castell
- The prevailing Airbnb cancellation policy trend in es Castell is Strict, used by 70.8% of listings.
- A majority (91.6%) of hosts in es Castell utilize Firm or Strict policies, indicating a market where hosts prioritize booking security.
Recommendations for Hosts
- Consider adopting a Strict policy to align with the 70.8% market standard in es Castell.
- With 70.8% using Strict terms, this is a viable option in es Castell, particularly for high-value properties or during peak demand periods.
- Regularly review your cancellation policy against competitors and market demand shifts in es Castell.
es Castell STR Booking Lead Time Analysis (2025)
Average Booking Lead Time by Month
Booking Lead Time Insights for es Castell
- The overall average booking lead time for vacation rentals in es Castell is 87 days.
- Guests book furthest in advance for stays during July (average 155 days), likely coinciding with peak travel demand or local events.
- The shortest booking windows occur for stays in December (average 0 days), indicating more last-minute travel plans during this time.
- Seasonally, Summer (129 days avg.) sees the longest lead times, while Winter (0 days avg.) has the shortest, reflecting typical travel planning cycles.
Recommendations for Hosts
- Use the overall average lead time (87 days) as a baseline for your pricing and availability strategy in es Castell.
- For July stays, consider implementing length-of-stay discounts or slightly higher rates for bookings made less than 155 days out to capitalize on advance planning.
- During December, focus on last-minute booking availability and promotions, as guests book with very short notice (0 days avg.).
- Target marketing efforts for the Summer season well in advance (at least 129 days) to capture early planners.
- Monitor your own booking lead times against these es Castell averages to identify opportunities for dynamic pricing adjustments.
Popular & Essential Airbnb Amenities in es Castell (2025)
Amenity Prevalence
Amenity Insights for es Castell
- Popular amenities like Heating, Wifi, Hot water are common but not universal. Offering these can provide a competitive edge.
- Warning: Wifi is not universally provided but is considered essential globally. Ensure reliable Wifi is offered.
Recommendations for Hosts
- Consider adding popular differentiators like Heating or Wifi to increase appeal.
- Highlight unique or less common amenities you offer (e.g., hot tub, dedicated workspace, EV charger) in your listing description and photos.
- Regularly check competitor amenities in es Castell to stay competitive.
es Castell Airbnb Guest Demographics & Profile Analysis (2025)
Guest Profile Summary for es Castell
- The typical guest profile for Airbnb in es Castell consists of predominantly international visitors (83%), with top international origins including Spain, typically belonging to the Post-2000s (Gen Z/Alpha) group (50%), primarily speaking English or French.
- Domestic travelers account for 17.3% of guests.
- Key international markets include France (42.7%) and Spain (17.3%).
- Top languages spoken are English (35.2%) followed by French (28.6%).
- A significant demographic segment is the Post-2000s (Gen Z/Alpha) group, representing 50% of guests.
Recommendations for Hosts
- Focus marketing internationally, particularly towards travelers from Spain.
- Tailor amenities and listing descriptions to appeal to the dominant Post-2000s (Gen Z/Alpha) demographic (e.g., highlight fast WiFi, smart home features, local guides).
- Highlight unique local experiences or amenities relevant to the primary guest profile.
- Consider seasonal promotions aligned with peak travel times for key origin markets.
Nearby Short-Term Rental Market Comparison
How does the es Castell Airbnb market stack up against its neighbors? Compare key performance metrics like average monthly revenue, ADR, and occupancy rates in surrounding areas to understand the broader regional STR landscape.
| Market | Active Properties | Monthly Revenue | Daily Rate | Avg. Occupancy |
|---|---|---|---|---|
| Sant Joan | 27 | $4,768 | $612.88 | 54% |
| Vilafranca de Bonany | 31 | $4,516 | $577.34 | 47% |
| Ariany | 65 | $4,418 | $555.49 | 43% |
| Felanitx | 474 | $4,158 | $511.27 | 48% |
| Santanyí | 775 | $4,051 | $460.87 | 52% |
| Son Servera | 196 | $4,033 | $533.19 | 47% |
| Porreres | 60 | $3,859 | $413.77 | 50% |
| Llubí | 76 | $3,763 | $405.22 | 48% |
| Muro | 273 | $3,759 | $412.01 | 49% |
| Alcúdia | 1,220 | $3,720 | $369.74 | 51% |