Cala Murada Airbnb Market Analysis 2025: Short Term Rental Data & Vacation Rental Statistics in Balearic Islands, Spain
Is Airbnb profitable in Cala Murada in 2025? Explore comprehensive Airbnb analytics for Cala Murada, Balearic Islands, Spain to uncover income potential. This 2025 STR market report for Cala Murada, based on AirROI data from April 2024 to March 2025, reveals key trends in the niche market of 32 active listings.
Whether you're considering an Airbnb investment in Cala Murada, optimizing your existing vacation rental, or exploring rental arbitrage opportunities, understanding the Cala Murada Airbnb data is crucial. Navigating the high regulation landscape is key to maximizing your short term rental income potential. Let's dive into the specifics.
Key Cala Murada Airbnb Performance Metrics Overview
Monthly Airbnb Revenue Variations & Income Potential in Cala Murada (2025)
Understanding the monthly revenue variations for Airbnb listings in Cala Murada is key to maximizing your short term rental income potential. Seasonality significantly impacts earnings. Our analysis, based on data from the past 12 months, shows that the peak revenue month for STRs in Cala Murada is typically August, while February often presents the lowest earnings, highlighting opportunities for strategic pricing adjustments during shoulder and low seasons. Explore the typical Airbnb income in Cala Murada across different performance tiers:
- Best-in-class properties (Top 10%) achieve $7,332+ monthly, often utilizing dynamic pricing and superior guest experiences.
- Strong performing properties (Top 25%) earn $5,539 or more, indicating effective management and desirable locations/amenities.
- Typical properties (Median) generate around $3,399 per month, representing the average market performance.
- Entry-level properties (Bottom 25%) see earnings around $1,972, often with potential for optimization.
Average Monthly Airbnb Earnings Trend in Cala Murada
Cala Murada Airbnb Occupancy Rate Trends (2025)
Maximize your bookings by understanding the Cala Murada STR occupancy trends. Seasonal demand shifts significantly influence how often properties are booked. Typically, Augustsees the highest demand (peak season occupancy), while February experiences the lowest (low season). Effective strategies, like adjusting minimum stays or offering promotions, can boost occupancy during slower periods. Here's how different property tiers perform in Cala Murada:
- Best-in-class properties (Top 10%) achieve 72%+ occupancy, indicating high desirability and potentially optimized availability.
- Strong performing properties (Top 25%) maintain 60% or higher occupancy, suggesting good market fit and guest satisfaction.
- Typical properties (Median) have an occupancy rate around 45%.
- Entry-level properties (Bottom 25%) average 22% occupancy, potentially facing higher vacancy.
Average Monthly Occupancy Rate Trend in Cala Murada
Average Daily Rate (ADR) Airbnb Trends in Cala Murada (2025)
Effective short term rental pricing strategy in Cala Murada involves understanding monthly ADR fluctuations. The Average Daily Rate (ADR) for Airbnb in Cala Murada typically peaks in August and dips lowest during May. Leveraging Airbnb dynamic pricing tools or strategies based on this seasonality can significantly boost revenue. Here's a look at the typical nightly rates achieved:
- Best-in-class properties (Top 10%) command rates of $491+ per night, often due to premium features or locations.
- Strong performing properties (Top 25%) achieve nightly rates of $344 or more.
- Typical properties (Median) charge around $248 per night.
- Entry-level properties (Bottom 25%) earn around $186 per night.
Average Daily Rate (ADR) Trend by Month in Cala Murada
Get Live Cala Murada Market Intelligence 👇

Explore Real-time Analytics
Airbnb Seasonality Analysis & Trends in Cala Murada (2025)
Peak Season (August, July, September)
- Revenue averages $7,855 per month
- Occupancy rates average 67.5%
- Daily rates average $420
Shoulder Season
- Revenue averages $4,325 per month
- Occupancy maintains around 44.5%
- Daily rates hold near $372
Low Season (January, February, March)
- Revenue drops to average $1,056 per month
- Occupancy decreases to average 15.2%
- Daily rates adjust to average $365
Seasonality Insights for Cala Murada
- The Airbnb seasonality in Cala Murada shows highly seasonal trends requiring careful strategy. While the sections above show seasonal averages, it's also insightful to look at the extremes:
- During the high season, the absolute peak month showcases Cala Murada's highest earning potential, with monthly revenues capable of climbing to $8,885, occupancy reaching a high of 75.6%, and ADRs peaking at $430.
- Conversely, the slowest single month of the year, typically falling within the low season, marks the market's lowest point. In this month, revenue might dip to $694, occupancy could drop to 13.8%, and ADRs may adjust down to $352.
- Understanding both the seasonal averages and these monthly peaks and troughs in revenue, occupancy, and ADR is crucial for maximizing your Airbnb profit potential in Cala Murada.
Seasonal Strategies for Maximizing Profit
- Peak Season: Maximize revenue through premium pricing and potentially longer minimum stays. Ensure high availability.
- Low Season: Offer competitive pricing, special promotions (e.g., extended stay discounts), and flexible cancellation policies. Target off-season travelers like remote workers or budget-conscious guests.
- Shoulder Seasons: Implement dynamic pricing that balances peak and low rates. Target weekend travelers or specific events. Offer slightly more flexible terms than peak season.
- Regularly analyze your own performance against these Cala Murada seasonality benchmarks and adjust your pricing and availability strategy accordingly.
Best Areas for Airbnb Investment in Cala Murada (2025)
Exploring the top neighborhoods for short-term rentals in Cala Murada? This section highlights key areas, outlining why they are attractive for hosts and guests, along with notable local attractions. Consider these locations based on your target guest profile and investment strategy.
| Neighborhood / Area | Why Host Here? (Target Guests & Appeal) | Key Attractions & Landmarks |
|---|---|---|
| Cala Murada Beach | A picturesque and tranquil beach area perfect for families and couples looking to enjoy the sun and sea. The beach is popular for its clear waters and soft sand, making it an attractive destination for tourists. | Cala Murada Beach, Cala Domingos Beach, Cala Antena Beach |
| Nearby Nature Reserves | Cala Murada is close to nature reserves, providing opportunities for hiking, birdwatching, and enjoying natural landscapes. Tourists who appreciate nature are drawn to this area. | Mondragó Natural Park, Natural Park of Levante, S'Albufera des Grau National Park |
| Local Restaurants and Cafés | There is a variety of local dining options that offer authentic Balearic cuisine. Tourists enjoy exploring local flavors and dining experiences. | Cafeteria Cala Murada, Beach Club Cala Murada, Bar-Cafeteria Es Moli |
| Cultural Heritage Sites | Cala Murada is in proximity to historical sites and cultural experiences, attracting tourists interested in history and culture. | Castell de Santueri, Church of Sant Joan Baptista, Castell de Capdepera |
| Water Sports and Activities | The region offers a range of water sports, making it attractive to adventure seekers and families looking for fun activities to do during their vacation. | Kayaking, Snorkeling excursions, Diving centers |
| Local Markets | The local markets offer a taste of authentic island life, with regional products and crafts, appealing to tourists looking for unique souvenirs and culinary delights. | Cala Murada Market, Manacor Market, Mercat de l'Olivar |
| Nearby Golf Courses | Cala Murada is close to several golf courses, appealing to golf enthusiasts looking for a combined beach and golf vacation experience. | Vall d'Or Golf, Son Gual Golf, Capdepera Golf |
| Scenic Views and Hiking Trails | The area has breathtaking views and hiking trails suitable for nature lovers and those looking for outdoor experiences, enhancing its appeal as a destination. | Sant Salvador Mountain, Cabo de Formentor, Hiking trails in Llevant |
Understanding Airbnb License Requirements & STR Laws in Cala Murada (2025)
Yes, Cala Murada, Balearic Islands, Spain enforces high STR regulations. Obtaining a license and ensuring compliance is almost certainly required according to current 2025 STR laws. Always verify the latest short term rental regulations and Airbnb license requirements directly with local government authorities for Cala Murada to ensure full compliance before hosting.
(Source: AirROI data, 2025, based on 66% licensed listings)
Top Performing Airbnb Properties in Cala Murada (2025)
Benchmark your potential! Explore examples of top-performing Airbnb properties in Cala Muradabased on Trailing Twelve Month (TTM) revenue. Analyze their characteristics, revenue, occupancy rate, and ADR to understand what drives success in this market.
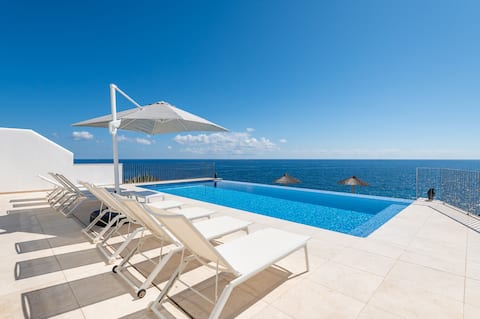
Villa Mediterraneo (Vaalmar)
Entire Place • 6 bedrooms
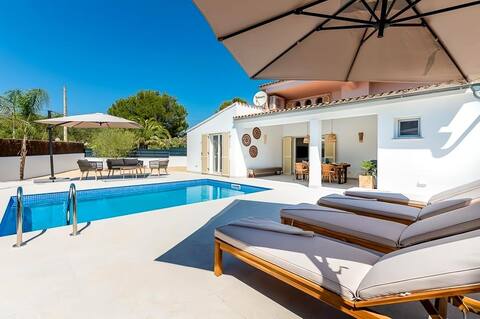
Villa Calma
Entire Place • 3 bedrooms
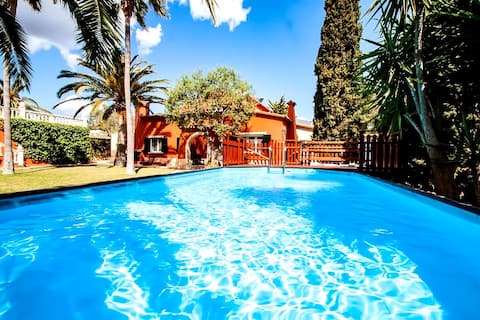
Son Ganxo I
Entire Place • 3 bedrooms
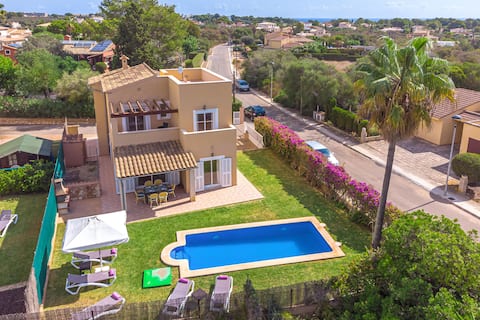
Large 4-Bed Villa near beach with Pool&Playground
Entire Place • 4 bedrooms
Vista Mar Azul, Villa 5StarsHome Mallorca
Entire Place • 3 bedrooms
Casa Ines - Mediterranean Beach House
Entire Place • 3 bedrooms
Note: Performance varies based on location, size, amenities, seasonality, and management quality. Data reflects the past 12 months.
Top Performing Airbnb Hosts in Cala Murada (2025)
Learn from the best! This table showcases top-performing Airbnb hosts in Cala Murada based on the number of properties managed and estimated total revenue over the past year. Analyze their scale and performance metrics.
| Host Name | Properties | Grossing Revenue | Stay Reviews | Avg Rating |
|---|---|---|---|---|
| Rebekka - Interhome Group | 9 | $250,922 | 129 | 4.62/5.0 |
| Mallorca House Rent | 1 | $204,092 | 9 | 4.67/5.0 |
| Villa Calma | 3 | $192,003 | 61 | 4.97/5.0 |
| Kiron | 2 | $91,404 | 8 | 4.88/5.0 |
| Holidu | 1 | $80,831 | 6 | 4.67/5.0 |
| Emma | 1 | $69,227 | 20 | 4.80/5.0 |
| Team FiveStarsHome | 1 | $61,222 | 6 | 4.67/5.0 |
| SM Holiday Properties | 3 | $55,984 | 3 | 1.67/5.0 |
| Maribel | 1 | $55,949 | 47 | 4.83/5.0 |
| Santi | 1 | $45,428 | 52 | 4.98/5.0 |
Analyzing the strategies of top hosts, such as their property selection, pricing, and guest communication, can offer valuable lessons for optimizing your own Airbnb operations in Cala Murada.
Dive Deeper: Advanced Cala Murada STR Market Data (2025)
Ready to unlock more insights? AirROI provides access to advanced metrics and comprehensive Airbnb data for Cala Murada. Explore detailed analytics beyond this report to refine your investment strategy, optimize pricing, and maximize your vacation rental profits.
Explore Advanced MetricsCala Murada Short-Term Rental Market Composition (2025): Property & Room Types
Room Type Distribution
Property Type Distribution
Market Composition Insights for Cala Murada
- The Cala Murada Airbnb market composition is heavily skewed towards Entire Home/Apt listings, which make up 100% of the 32 active rentals. This indicates strong guest preference for privacy and space.
- Looking at the property type distribution in Cala Murada, House properties are the most common (84.4%), reflecting the local real estate landscape.
- Houses represent a significant 84.4% portion, catering likely to families or larger groups.
Cala Murada Airbnb Room Capacity Analysis (2025): Bedroom Distribution
Distribution of Listings by Number of Bedrooms
Room Capacity Insights for Cala Murada
- The dominant room capacity in Cala Murada is 3 bedrooms listings, making up 50% of the market. This suggests a strong demand for properties suitable for families or small groups.
- Together, 3 bedrooms and 4 bedrooms properties represent 71.9% of the active Airbnb listings in Cala Murada, indicating a high concentration in these sizes.
- A significant 75.0% of listings offer 3+ bedrooms, catering to larger groups and families seeking more space in Cala Murada.
Cala Murada Vacation Rental Guest Capacity Trends (2025)
Distribution of Listings by Guest Capacity
Guest Capacity Insights for Cala Murada
- The most common guest capacity trend in Cala Murada vacation rentals is listings accommodating 6 guests (40.6%). This suggests the primary traveler segment is likely larger groups.
- Properties designed for 6 guests and 8+ guests dominate the Cala Murada STR market, accounting for 65.6% of listings.
- 65.6% of properties accommodate 6+ guests, serving the market segment for larger families or group travel in Cala Murada.
- On average, properties in Cala Murada are equipped to host 5.8 guests.
Cala Murada Airbnb Booking Patterns (2025): Available vs. Booked Days
Available Days Distribution
Booked Days Distribution
Booking Pattern Insights for Cala Murada
- The most common availability pattern in Cala Murada falls within the 181-270 days range, representing 46.9% of listings. This suggests many properties have significant open periods on their calendars.
- Approximately 75.0% of listings show high availability (181+ days open annually), indicating potential for increased bookings or specific owner usage patterns.
- For booked days, the 91-180 days range is most frequent in Cala Murada (46.9%), reflecting common guest stay durations or potential owner blocking patterns.
- A notable 25.0% of properties secure long booking periods (181+ days booked per year), highlighting successful long-term rental strategies or significant owner usage.
Cala Murada Airbnb Minimum Stay Requirements Analysis
Distribution of Listings by Minimum Night Requirement
1 Night
5 listings
16.7% of total
3 Nights
2 listings
6.7% of total
4-6 Nights
18 listings
60% of total
7-29 Nights
2 listings
6.7% of total
30+ Nights
3 listings
10% of total
Key Insights
- The most prevalent minimum stay requirement in Cala Murada is 4-6 Nights, adopted by 60% of listings. This highlights the market's preference for longer commitments.
- Very short stays (1-2 nights) are less common (16.7%), suggesting hosts prefer slightly longer bookings to optimize turnover.
Recommendations
- Align with the market by considering a 4-6 Nights minimum stay, as 60% of Cala Murada hosts use this setting.
- If feasible, allowing 1-night stays, especially midweek or during low season, could capture last-minute bookings, as only 16.7% currently do.
- Explore offering discounts for stays of 30+ nights to attract the 10% of the market seeking extended stays.
- Adjust minimum nights based on seasonality – potentially shorter during low season and longer during peak demand periods in Cala Murada.
Cala Murada Airbnb Cancellation Policy Trends Analysis (2025)
Flexible
1 listings
3.7% of total
Moderate
2 listings
7.4% of total
Firm
20 listings
74.1% of total
Strict
4 listings
14.8% of total
Cancellation Policy Insights for Cala Murada
- The prevailing Airbnb cancellation policy trend in Cala Murada is Firm, used by 74.1% of listings.
- A majority (88.9%) of hosts in Cala Murada utilize Firm or Strict policies, indicating a market where hosts prioritize booking security.
Recommendations for Hosts
- Consider adopting a Firm policy to align with the 74.1% market standard in Cala Murada.
- Using a Strict policy might deter some guests, as only 14.8% of listings use it. Evaluate if potential revenue protection outweighs possible lower booking rates.
- Regularly review your cancellation policy against competitors and market demand shifts in Cala Murada.
Cala Murada STR Booking Lead Time Analysis (2025)
Average Booking Lead Time by Month
Booking Lead Time Insights for Cala Murada
- The overall average booking lead time for vacation rentals in Cala Murada is 83 days.
- Guests book furthest in advance for stays during July (average 149 days), likely coinciding with peak travel demand or local events.
- The shortest booking windows occur for stays in December (average 45 days), indicating more last-minute travel plans during this time.
- Seasonally, Summer (129 days avg.) sees the longest lead times, while Winter (56 days avg.) has the shortest, reflecting typical travel planning cycles.
Recommendations for Hosts
- Use the overall average lead time (83 days) as a baseline for your pricing and availability strategy in Cala Murada.
- For July stays, consider implementing length-of-stay discounts or slightly higher rates for bookings made less than 149 days out to capitalize on advance planning.
- Target marketing efforts for the Summer season well in advance (at least 129 days) to capture early planners.
- Monitor your own booking lead times against these Cala Murada averages to identify opportunities for dynamic pricing adjustments.
Popular & Essential Airbnb Amenities in Cala Murada (2025)
Amenity Prevalence
Amenity Insights for Cala Murada
- Essential amenities in Cala Murada that guests expect include: TV, Kitchen, Washer, Refrigerator. Lacking these (any) could significantly impact bookings.
- Popular amenities like Hot water, Coffee maker, Air conditioning are common but not universal. Offering these can provide a competitive edge.
Recommendations for Hosts
- Ensure your listing includes all essential amenities for Cala Murada: TV, Kitchen, Washer, Refrigerator.
- Prioritize adding missing essentials: Kitchen, Washer, Refrigerator.
- Consider adding popular differentiators like Hot water or Coffee maker to increase appeal.
- Highlight unique or less common amenities you offer (e.g., hot tub, dedicated workspace, EV charger) in your listing description and photos.
- Regularly check competitor amenities in Cala Murada to stay competitive.
Cala Murada Airbnb Guest Demographics & Profile Analysis (2025)
Guest Profile Summary for Cala Murada
- The typical guest profile for Airbnb in Cala Murada consists of predominantly international visitors (94%), with top international origins including France, typically belonging to the Post-2000s (Gen Z/Alpha) group (50%), primarily speaking English or German.
- Domestic travelers account for 6.4% of guests.
- Key international markets include Germany (39.3%) and France (10%).
- Top languages spoken are English (36.1%) followed by German (23.9%).
- A significant demographic segment is the Post-2000s (Gen Z/Alpha) group, representing 50% of guests.
Recommendations for Hosts
- Focus marketing internationally, particularly towards travelers from France.
- Tailor amenities and listing descriptions to appeal to the dominant Post-2000s (Gen Z/Alpha) demographic (e.g., highlight fast WiFi, smart home features, local guides).
- Highlight unique local experiences or amenities relevant to the primary guest profile.
- Consider seasonal promotions aligned with peak travel times for key origin markets.
Nearby Short-Term Rental Market Comparison
How does the Cala Murada Airbnb market stack up against its neighbors? Compare key performance metrics like average monthly revenue, ADR, and occupancy rates in surrounding areas to understand the broader regional STR landscape.
| Market | Active Properties | Monthly Revenue | Daily Rate | Avg. Occupancy |
|---|---|---|---|---|
| Algaida | 79 | $6,918 | $709.08 | 48% |
| Mancor de la Vall | 35 | $6,389 | $620.29 | 54% |
| Deià | 60 | $5,880 | $663.85 | 53% |
| ses Illetes | 23 | $5,772 | $630.49 | 52% |
| Andratx | 167 | $5,668 | $610.37 | 50% |
| Marratxí | 76 | $5,454 | $623.67 | 47% |
| Fornalutx | 87 | $5,202 | $439.26 | 55% |
| Montuïri | 41 | $5,186 | $572.75 | 52% |
| Bunyola | 60 | $5,129 | $486.16 | 50% |
| Badia Blava | 35 | $4,973 | $801.83 | 46% |