Cala Carbó Airbnb Market Analysis 2025: Short Term Rental Data & Vacation Rental Statistics in Balearic Islands, Spain
Is Airbnb profitable in Cala Carbó in 2025? Explore comprehensive Airbnb analytics for Cala Carbó, Balearic Islands, Spain to uncover income potential. This 2025 STR market report for Cala Carbó, based on AirROI data from April 2024 to March 2025, reveals key trends in the niche market of 18 active listings.
Whether you're considering an Airbnb investment in Cala Carbó, optimizing your existing vacation rental, or exploring rental arbitrage opportunities, understanding the Cala Carbó Airbnb data is crucial. Understanding the local regulations is key to maximizing your short term rental income potential. Let's dive into the specifics.
Key Cala Carbó Airbnb Performance Metrics Overview
Monthly Airbnb Revenue Variations & Income Potential in Cala Carbó (2025)
Understanding the monthly revenue variations for Airbnb listings in Cala Carbó is key to maximizing your short term rental income potential. Seasonality significantly impacts earnings. Our analysis, based on data from the past 12 months, shows that the peak revenue month for STRs in Cala Carbó is typically August, while March often presents the lowest earnings, highlighting opportunities for strategic pricing adjustments during shoulder and low seasons. Explore the typical Airbnb income in Cala Carbó across different performance tiers:
- Best-in-class properties (Top 10%) achieve $19,817+ monthly, often utilizing dynamic pricing and superior guest experiences.
- Strong performing properties (Top 25%) earn $14,083 or more, indicating effective management and desirable locations/amenities.
- Typical properties (Median) generate around $8,577 per month, representing the average market performance.
- Entry-level properties (Bottom 25%) see earnings around $4,190, often with potential for optimization.
Average Monthly Airbnb Earnings Trend in Cala Carbó
Cala Carbó Airbnb Occupancy Rate Trends (2025)
Maximize your bookings by understanding the Cala Carbó STR occupancy trends. Seasonal demand shifts significantly influence how often properties are booked. Typically, Augustsees the highest demand (peak season occupancy), while December experiences the lowest (low season). Effective strategies, like adjusting minimum stays or offering promotions, can boost occupancy during slower periods. Here's how different property tiers perform in Cala Carbó:
- Best-in-class properties (Top 10%) achieve 66%+ occupancy, indicating high desirability and potentially optimized availability.
- Strong performing properties (Top 25%) maintain 53% or higher occupancy, suggesting good market fit and guest satisfaction.
- Typical properties (Median) have an occupancy rate around 34%.
- Entry-level properties (Bottom 25%) average 19% occupancy, potentially facing higher vacancy.
Average Monthly Occupancy Rate Trend in Cala Carbó
Average Daily Rate (ADR) Airbnb Trends in Cala Carbó (2025)
Effective short term rental pricing strategy in Cala Carbó involves understanding monthly ADR fluctuations. The Average Daily Rate (ADR) for Airbnb in Cala Carbó typically peaks in November and dips lowest during March. Leveraging Airbnb dynamic pricing tools or strategies based on this seasonality can significantly boost revenue. Here's a look at the typical nightly rates achieved:
- Best-in-class properties (Top 10%) command rates of $1,267+ per night, often due to premium features or locations.
- Strong performing properties (Top 25%) achieve nightly rates of $1,088 or more.
- Typical properties (Median) charge around $653 per night.
- Entry-level properties (Bottom 25%) earn around $378 per night.
Average Daily Rate (ADR) Trend by Month in Cala Carbó
Get Live Cala Carbó Market Intelligence 👇

Explore Real-time Analytics
Airbnb Seasonality Analysis & Trends in Cala Carbó (2025)
Peak Season (August, July, September)
- Revenue averages $22,304 per month
- Occupancy rates average 57.7%
- Daily rates average $852
Shoulder Season
- Revenue averages $9,871 per month
- Occupancy maintains around 35.6%
- Daily rates hold near $826
Low Season (February, March, December)
- Revenue drops to average $3,535 per month
- Occupancy decreases to average 18.5%
- Daily rates adjust to average $734
Seasonality Insights for Cala Carbó
- The Airbnb seasonality in Cala Carbó shows highly seasonal trends requiring careful strategy. While the sections above show seasonal averages, it's also insightful to look at the extremes:
- During the high season, the absolute peak month showcases Cala Carbó's highest earning potential, with monthly revenues capable of climbing to $26,910, occupancy reaching a high of 69.5%, and ADRs peaking at $901.
- Conversely, the slowest single month of the year, typically falling within the low season, marks the market's lowest point. In this month, revenue might dip to $2,401, occupancy could drop to 17.1%, and ADRs may adjust down to $642.
- Understanding both the seasonal averages and these monthly peaks and troughs in revenue, occupancy, and ADR is crucial for maximizing your Airbnb profit potential in Cala Carbó.
Seasonal Strategies for Maximizing Profit
- Peak Season: Maximize revenue through premium pricing and potentially longer minimum stays. Ensure high availability.
- Low Season: Offer competitive pricing, special promotions (e.g., extended stay discounts), and flexible cancellation policies. Target off-season travelers like remote workers or budget-conscious guests.
- Shoulder Seasons: Implement dynamic pricing that balances peak and low rates. Target weekend travelers or specific events. Offer slightly more flexible terms than peak season.
- Regularly analyze your own performance against these Cala Carbó seasonality benchmarks and adjust your pricing and availability strategy accordingly.
Best Areas for Airbnb Investment in Cala Carbó (2025)
Exploring the top neighborhoods for short-term rentals in Cala Carbó? This section highlights key areas, outlining why they are attractive for hosts and guests, along with notable local attractions. Consider these locations based on your target guest profile and investment strategy.
| Neighborhood / Area | Why Host Here? (Target Guests & Appeal) | Key Attractions & Landmarks |
|---|---|---|
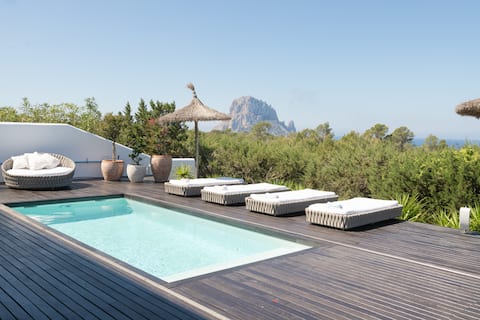
| Cala Carbó Beach | A picturesque beach known for its clear waters and stunning views. Ideal for hosting tourists who appreciate serene coastal settings and outdoor activities such as snorkeling and sunbathing. | Cala Carbó Beach, Scenic viewpoints, Water sports activities, Hiking trails in surrounding areas, Relaxing beach bars |
| Nearby Villages | Charming traditional villages near Cala Carbó, offering a glimpse into local culture and gastronomy. Great for tourists seeking authentic experiences and local cuisine. | Sant Carles de Peralta, Es Cubells, Local markets, Authentic Spanish restaurants, Cultural festivals |
| Ibiza Town | The vibrant capital of Ibiza, known for its nightlife, dining, and shopping. A popular destination for tourists looking to experience the lively side of the island. | Dalt Vila, Pacha Nightclub, Shopping boutiques, Ibiza Cathedral, Marine Port with restaurants |
| Cala Llenya | A family-friendly beach spot known for its calm waters and beautiful surroundings. Attracts families and those looking for a more relaxed atmosphere. | Cala Llenya Beach, Beachfront restaurants, Water sports opportunities, Lush natural landscapes, Family-friendly parks |
| Santa Eulària des Riu | A picturesque town offering a blend of beach, culture, and relaxing atmosphere. Popular among those who appreciate tranquility and good dining options. | Sant Carles Hippie Market, Cultural heritage sites, Beautiful seafront promenade, Local art galleries, Dining on the beach |
| Cala Nova | Famous for its surf conditions and lively beach vibes. Ideal for younger crowds seeking adventure and beach parties. | Cala Nova Beach, Surfing schools, Beach clubs and bars, Yoga retreats, Beach volleyball courts |
| Cala Bassa | Known for its stunning beach and vibrant atmosphere. Offers a mix of relaxation and entertainment for young travelers. | Cala Bassa Beach, Beach clubs, Water activities, Dine by the sea, Sunset views |
| Formentera Excursions | The nearby island of Formentera is accessible by ferry and known for its breathtaking beaches and natural beauty. Perfect for day trips and longer stays. | Illetas Beach, Cala Saona, Natural parks, Bicycle rentals, Secluded coves |
Understanding Airbnb License Requirements & STR Laws in Cala Carbó (2025)
With 11% of listings showing registration in 2025, understanding potential Airbnb license requirements is crucial in Cala Carbó. Always verify the latest short term rental regulations and Airbnb license requirements directly with local government authorities for Cala Carbó to ensure full compliance before hosting.
(Source: AirROI data, 2025, based on 11% licensed listings)
Top Performing Airbnb Properties in Cala Carbó (2025)
Benchmark your potential! Explore examples of top-performing Airbnb properties in Cala Carbóbased on Trailing Twelve Month (TTM) revenue. Analyze their characteristics, revenue, occupancy rate, and ADR to understand what drives success in this market.

Kasbah Yuca, Two bedroom pool villa, your Home.
Entire Place • 2 bedrooms
Home Runel
Entire Place • 4 bedrooms
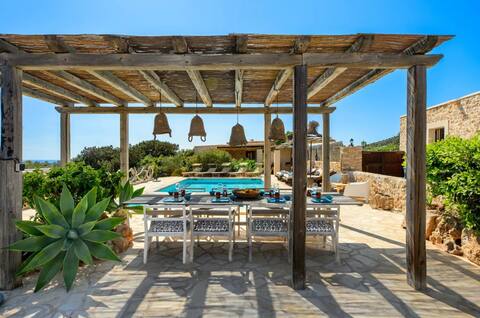
Mágica villa vista Vedrà
Entire Place • 5 bedrooms
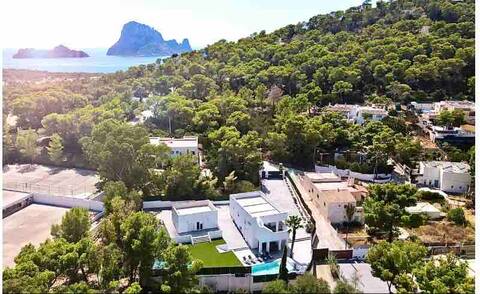
Modern villa with guest house and two pools
Entire Place • 6 bedrooms
Casa Julia, Cala Carbo, Es Vedra
Entire Place • 3 bedrooms
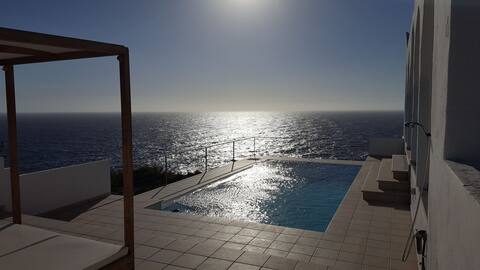
Large Ocean view es Vedra villa
Entire Place • 3 bedrooms
Note: Performance varies based on location, size, amenities, seasonality, and management quality. Data reflects the past 12 months.
Top Performing Airbnb Hosts in Cala Carbó (2025)
Learn from the best! This table showcases top-performing Airbnb hosts in Cala Carbó based on the number of properties managed and estimated total revenue over the past year. Analyze their scale and performance metrics.
| Host Name | Properties | Grossing Revenue | Stay Reviews | Avg Rating |
|---|---|---|---|---|
| Es Vedra Bay Villas | 5 | $571,742 | 26 | 3.00/5.0 |
| Roza | 1 | $157,884 | 5 | 4.80/5.0 |
| Neus | 1 | $114,581 | 5 | 5.00/5.0 |
| Ana | 1 | $111,310 | 12 | 5.00/5.0 |
| Julia & Florian | 1 | $90,580 | 18 | 4.89/5.0 |
| Maartje | 1 | $86,880 | 12 | 4.92/5.0 |
| Carmen | 1 | $74,710 | 49 | 4.73/5.0 |
| Host #21688838 | 1 | $51,907 | 35 | 4.94/5.0 |
| Host #2542196 | 1 | $45,639 | 12 | 4.83/5.0 |
| Host #160969591 | 1 | $19,897 | 0 | 0.00/5.0 |
Analyzing the strategies of top hosts, such as their property selection, pricing, and guest communication, can offer valuable lessons for optimizing your own Airbnb operations in Cala Carbó.
Dive Deeper: Advanced Cala Carbó STR Market Data (2025)
Ready to unlock more insights? AirROI provides access to advanced metrics and comprehensive Airbnb data for Cala Carbó. Explore detailed analytics beyond this report to refine your investment strategy, optimize pricing, and maximize your vacation rental profits.
Explore Advanced MetricsCala Carbó Short-Term Rental Market Composition (2025): Property & Room Types
Room Type Distribution
Property Type Distribution
Market Composition Insights for Cala Carbó
- The Cala Carbó Airbnb market composition is heavily skewed towards Entire Home/Apt listings, which make up 100% of the 18 active rentals. This indicates strong guest preference for privacy and space.
- Looking at the property type distribution in Cala Carbó, House properties are the most common (88.9%), reflecting the local real estate landscape.
- Houses represent a significant 88.9% portion, catering likely to families or larger groups.
Cala Carbó Airbnb Room Capacity Analysis (2025): Bedroom Distribution
Distribution of Listings by Number of Bedrooms
Room Capacity Insights for Cala Carbó
- The dominant room capacity in Cala Carbó is 3 bedrooms listings, making up 38.9% of the market. This suggests a strong demand for properties suitable for families or small groups.
- Together, 3 bedrooms and 4 bedrooms properties represent 61.1% of the active Airbnb listings in Cala Carbó, indicating a high concentration in these sizes.
- A significant 77.8% of listings offer 3+ bedrooms, catering to larger groups and families seeking more space in Cala Carbó.
Cala Carbó Vacation Rental Guest Capacity Trends (2025)
Distribution of Listings by Guest Capacity
Guest Capacity Insights for Cala Carbó
- The most common guest capacity trend in Cala Carbó vacation rentals is listings accommodating 8+ guests (33.3%). This suggests the primary traveler segment is likely larger groups.
- Properties designed for 8+ guests and 6 guests dominate the Cala Carbó STR market, accounting for 55.5% of listings.
- 72.2% of properties accommodate 6+ guests, serving the market segment for larger families or group travel in Cala Carbó.
- On average, properties in Cala Carbó are equipped to host 6.2 guests.
Cala Carbó Airbnb Booking Patterns (2025): Available vs. Booked Days
Available Days Distribution
Booked Days Distribution
Booking Pattern Insights for Cala Carbó
- The most common availability pattern in Cala Carbó falls within the 271-366 days range, representing 66.7% of listings. This suggests many properties have significant open periods on their calendars.
- Approximately 88.9% of listings show high availability (181+ days open annually), indicating potential for increased bookings or specific owner usage patterns.
- For booked days, the 1-30 days range is most frequent in Cala Carbó (38.9%), reflecting common guest stay durations or potential owner blocking patterns.
- A notable 11.1% of properties secure long booking periods (181+ days booked per year), highlighting successful long-term rental strategies or significant owner usage.
Cala Carbó Airbnb Minimum Stay Requirements Analysis
Distribution of Listings by Minimum Night Requirement
3 Nights
2 listings
16.7% of total
4-6 Nights
7 listings
58.3% of total
7-29 Nights
3 listings
25% of total
Key Insights
- The most prevalent minimum stay requirement in Cala Carbó is 4-6 Nights, adopted by 58.3% of listings. This highlights the market's preference for longer commitments.
Recommendations
- Align with the market by considering a 4-6 Nights minimum stay, as 58.3% of Cala Carbó hosts use this setting.
- Adjust minimum nights based on seasonality – potentially shorter during low season and longer during peak demand periods in Cala Carbó.
Cala Carbó Airbnb Cancellation Policy Trends Analysis (2025)
Super Strict 60 Days
1 listings
8.3% of total
Super Strict 30 Days
3 listings
25% of total
Firm
2 listings
16.7% of total
Strict
6 listings
50% of total
Cancellation Policy Insights for Cala Carbó
- The prevailing Airbnb cancellation policy trend in Cala Carbó is Strict, used by 50% of listings.
- A majority (66.7%) of hosts in Cala Carbó utilize Firm or Strict policies, indicating a market where hosts prioritize booking security.
Recommendations for Hosts
- Consider adopting a Strict policy to align with the 50% market standard in Cala Carbó.
- With 50% using Strict terms, this is a viable option in Cala Carbó, particularly for high-value properties or during peak demand periods.
- Regularly review your cancellation policy against competitors and market demand shifts in Cala Carbó.
Cala Carbó STR Booking Lead Time Analysis (2025)
Average Booking Lead Time by Month
Booking Lead Time Insights for Cala Carbó
- The overall average booking lead time for vacation rentals in Cala Carbó is 84 days.
- Guests book furthest in advance for stays during July (average 144 days), likely coinciding with peak travel demand or local events.
- The shortest booking windows occur for stays in March (average 22 days), indicating more last-minute travel plans during this time.
- Seasonally, Summer (137 days avg.) sees the longest lead times, while Winter (64 days avg.) has the shortest, reflecting typical travel planning cycles.
Recommendations for Hosts
- Use the overall average lead time (84 days) as a baseline for your pricing and availability strategy in Cala Carbó.
- For July stays, consider implementing length-of-stay discounts or slightly higher rates for bookings made less than 144 days out to capitalize on advance planning.
- Target marketing efforts for the Summer season well in advance (at least 137 days) to capture early planners.
- Monitor your own booking lead times against these Cala Carbó averages to identify opportunities for dynamic pricing adjustments.
Popular & Essential Airbnb Amenities in Cala Carbó (2025)
Amenity Prevalence
Amenity Insights for Cala Carbó
- Essential amenities in Cala Carbó that guests expect include: Essentials, Kitchen, Wifi, Heating, Washer. Lacking these (any) could significantly impact bookings.
- Popular amenities like Air conditioning, TV, Hair dryer are common but not universal. Offering these can provide a competitive edge.
Recommendations for Hosts
- Ensure your listing includes all essential amenities for Cala Carbó: Essentials, Kitchen, Wifi, Heating, Washer.
- Consider adding popular differentiators like Air conditioning or TV to increase appeal.
- Highlight unique or less common amenities you offer (e.g., hot tub, dedicated workspace, EV charger) in your listing description and photos.
- Regularly check competitor amenities in Cala Carbó to stay competitive.
Cala Carbó Airbnb Guest Demographics & Profile Analysis (2025)
Guest Profile Summary for Cala Carbó
- The typical guest profile for Airbnb in Cala Carbó consists of predominantly international visitors (95%), with top international origins including Germany, typically belonging to the Post-2000s (Gen Z/Alpha) group (50%), primarily speaking English or German.
- Domestic travelers account for 5.0% of guests.
- Key international markets include United Kingdom (25%) and Germany (13.3%).
- Top languages spoken are English (39%) followed by German (17.1%).
- A significant demographic segment is the Post-2000s (Gen Z/Alpha) group, representing 50% of guests.
Recommendations for Hosts
- Focus marketing internationally, particularly towards travelers from Germany.
- Tailor amenities and listing descriptions to appeal to the dominant Post-2000s (Gen Z/Alpha) demographic (e.g., highlight fast WiFi, smart home features, local guides).
- Highlight unique local experiences or amenities relevant to the primary guest profile.
- Consider seasonal promotions aligned with peak travel times for key origin markets.
Nearby Short-Term Rental Market Comparison
How does the Cala Carbó Airbnb market stack up against its neighbors? Compare key performance metrics like average monthly revenue, ADR, and occupancy rates in surrounding areas to understand the broader regional STR landscape.
| Market | Active Properties | Monthly Revenue | Daily Rate | Avg. Occupancy |
|---|---|---|---|---|
| sa Carroca | 98 | $10,551 | $862.81 | 52% |
| Can Germà | 25 | $9,819 | $927.22 | 47% |
| Can Tomàs | 26 | $9,321 | $878.17 | 47% |
| Es Cubells | 31 | $8,883 | $1002.54 | 54% |
| Sant Rafel de sa Creu | 46 | $7,518 | $730.00 | 45% |
| Vista Mar | 64 | $7,047 | $750.94 | 46% |
| Algaida | 79 | $6,918 | $709.08 | 48% |
| Vista Alegre | 18 | $6,413 | $1214.28 | 42% |
| Mancor de la Vall | 35 | $6,389 | $620.29 | 54% |
| Sant Josep de sa Talaia | 256 | $6,308 | $699.24 | 48% |