Binissalem Airbnb Market Analysis 2025: Short Term Rental Data & Vacation Rental Statistics in Balearic Islands, Spain
Is Airbnb profitable in Binissalem in 2025? Explore comprehensive Airbnb analytics for Binissalem, Balearic Islands, Spain to uncover income potential. This 2025 STR market report for Binissalem, based on AirROI data from April 2024 to March 2025, reveals key trends in the niche market of 71 active listings.
Whether you're considering an Airbnb investment in Binissalem, optimizing your existing vacation rental, or exploring rental arbitrage opportunities, understanding the Binissalem Airbnb data is crucial. Navigating the high regulation landscape is key to maximizing your short term rental income potential. Let's dive into the specifics.
Key Binissalem Airbnb Performance Metrics Overview
Monthly Airbnb Revenue Variations & Income Potential in Binissalem (2025)
Understanding the monthly revenue variations for Airbnb listings in Binissalem is key to maximizing your short term rental income potential. Seasonality significantly impacts earnings. Our analysis, based on data from the past 12 months, shows that the peak revenue month for STRs in Binissalem is typically August, while March often presents the lowest earnings, highlighting opportunities for strategic pricing adjustments during shoulder and low seasons. Explore the typical Airbnb income in Binissalem across different performance tiers:
- Best-in-class properties (Top 10%) achieve $13,328+ monthly, often utilizing dynamic pricing and superior guest experiences.
- Strong performing properties (Top 25%) earn $6,749 or more, indicating effective management and desirable locations/amenities.
- Typical properties (Median) generate around $4,071 per month, representing the average market performance.
- Entry-level properties (Bottom 25%) see earnings around $2,298, often with potential for optimization.
Average Monthly Airbnb Earnings Trend in Binissalem
Binissalem Airbnb Occupancy Rate Trends (2025)
Maximize your bookings by understanding the Binissalem STR occupancy trends. Seasonal demand shifts significantly influence how often properties are booked. Typically, Augustsees the highest demand (peak season occupancy), while March experiences the lowest (low season). Effective strategies, like adjusting minimum stays or offering promotions, can boost occupancy during slower periods. Here's how different property tiers perform in Binissalem:
- Best-in-class properties (Top 10%) achieve 84%+ occupancy, indicating high desirability and potentially optimized availability.
- Strong performing properties (Top 25%) maintain 67% or higher occupancy, suggesting good market fit and guest satisfaction.
- Typical properties (Median) have an occupancy rate around 45%.
- Entry-level properties (Bottom 25%) average 23% occupancy, potentially facing higher vacancy.
Average Monthly Occupancy Rate Trend in Binissalem
Average Daily Rate (ADR) Airbnb Trends in Binissalem (2025)
Effective short term rental pricing strategy in Binissalem involves understanding monthly ADR fluctuations. The Average Daily Rate (ADR) for Airbnb in Binissalem typically peaks in August and dips lowest during April. Leveraging Airbnb dynamic pricing tools or strategies based on this seasonality can significantly boost revenue. Here's a look at the typical nightly rates achieved:
- Best-in-class properties (Top 10%) command rates of $978+ per night, often due to premium features or locations.
- Strong performing properties (Top 25%) achieve nightly rates of $435 or more.
- Typical properties (Median) charge around $263 per night.
- Entry-level properties (Bottom 25%) earn around $176 per night.
Average Daily Rate (ADR) Trend by Month in Binissalem
Get Live Binissalem Market Intelligence 👇

Explore Real-time Analytics
Airbnb Seasonality Analysis & Trends in Binissalem (2025)
Peak Season (August, July, June)
- Revenue averages $10,108 per month
- Occupancy rates average 64.1%
- Daily rates average $446
Shoulder Season
- Revenue averages $5,889 per month
- Occupancy maintains around 46.3%
- Daily rates hold near $403
Low Season (January, March, December)
- Revenue drops to average $2,901 per month
- Occupancy decreases to average 29.5%
- Daily rates adjust to average $404
Seasonality Insights for Binissalem
- The Airbnb seasonality in Binissalem shows highly seasonal trends requiring careful strategy. While the sections above show seasonal averages, it's also insightful to look at the extremes:
- During the high season, the absolute peak month showcases Binissalem's highest earning potential, with monthly revenues capable of climbing to $11,304, occupancy reaching a high of 71.6%, and ADRs peaking at $455.
- Conversely, the slowest single month of the year, typically falling within the low season, marks the market's lowest point. In this month, revenue might dip to $2,646, occupancy could drop to 27.5%, and ADRs may adjust down to $391.
- Understanding both the seasonal averages and these monthly peaks and troughs in revenue, occupancy, and ADR is crucial for maximizing your Airbnb profit potential in Binissalem.
Seasonal Strategies for Maximizing Profit
- Peak Season: Maximize revenue through premium pricing and potentially longer minimum stays. Ensure high availability.
- Low Season: Offer competitive pricing, special promotions (e.g., extended stay discounts), and flexible cancellation policies. Target off-season travelers like remote workers or budget-conscious guests.
- Shoulder Seasons: Implement dynamic pricing that balances peak and low rates. Target weekend travelers or specific events. Offer slightly more flexible terms than peak season.
- Regularly analyze your own performance against these Binissalem seasonality benchmarks and adjust your pricing and availability strategy accordingly.
Best Areas for Airbnb Investment in Binissalem (2025)
Exploring the top neighborhoods for short-term rentals in Binissalem? This section highlights key areas, outlining why they are attractive for hosts and guests, along with notable local attractions. Consider these locations based on your target guest profile and investment strategy.
| Neighborhood / Area | Why Host Here? (Target Guests & Appeal) | Key Attractions & Landmarks |
|---|---|---|
| Binissalem Town Center | The heart of Binissalem, known for its charming streets, local shops, and restaurants. Ideal for tourists wanting to experience the local culture and cuisine. | Iglesia de Santa Maria, Bodegas de Binissalem, Museu de la Raixa, Local Markets, Traditional Mallorcan Cuisine Restaurants |
| Wine Country | Binissalem is known for its vineyards and wineries. Investing in properties here attracts wine enthusiasts and tourists interested in wine tours and tastings. | Vineyards Tour, Binissalem Wine Museum, Bodega José L. Ferrer, Wine Tasting Events, Rural Tourism Activities |
| Sant martí | A historical area with beautiful countryside views, perfect for those seeking tranquility and traditional Mallorcan living. | Finca de Son Roig, Hiking Trails, Mallorcan Countryside Views |
| Cultural Pathways | A cultural hub with art galleries and workshops, attracting those interested in local crafts and art. | Art Workshops, Gallery Exhibitions, Cultural Festivals, Local Artisan Shops |
| Rural Retreats | Surrounding rural areas provide a peaceful retreat for tourists escaping the city, perfect for agritourism. | Countryside Retreats, Organic Farms, Cycling Routes, Nature Walks |
| Outdoor Activities | Proximity to the Tramuntana mountain range offers access to hiking and outdoor sports, appealing to adventure seekers. | Hiking Trails in Tramuntana, Cycling Routes, Outdoor Sports Facilities, Nature Parks |
| Historic Sites | Binissalem has a rich history, making it attractive for tourists interested in heritage and historical landmarks. | Ancient Windmills, Historic Buildings and Churches, Cultural Heritage Sites |
| Local Market Area | Vibrant local markets that showcase fresh produce and local cuisine, appealing to food lovers and culinary tourists. | Weekly Local Market, Traditional Food Stalls, Culinary Tours |
Understanding Airbnb License Requirements & STR Laws in Binissalem (2025)
Yes, Binissalem, Balearic Islands, Spain enforces high STR regulations. Obtaining a license and ensuring compliance is almost certainly required according to current 2025 STR laws. Always verify the latest short term rental regulations and Airbnb license requirements directly with local government authorities for Binissalem to ensure full compliance before hosting.
(Source: AirROI data, 2025, based on 61% licensed listings)
Top Performing Airbnb Properties in Binissalem (2025)
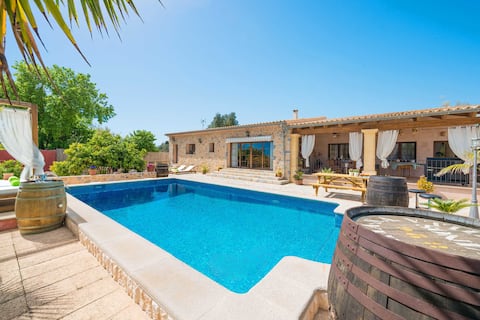
Benchmark your potential! Explore examples of top-performing Airbnb properties in Binissalembased on Trailing Twelve Month (TTM) revenue. Analyze their characteristics, revenue, occupancy rate, and ADR to understand what drives success in this market.
Le Petit Paradis
Entire Place • 2 bedrooms
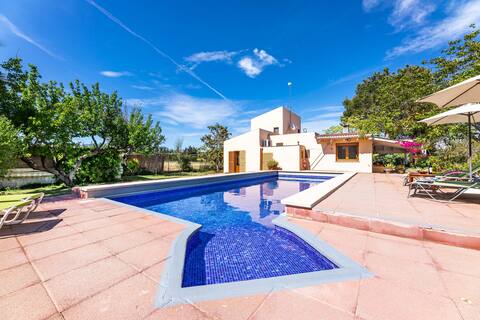
NEW! Villa Mireia by BeBreeze Mallorca
Entire Place • 4 bedrooms
Can Bielet
Entire Place • 4 bedrooms
Els Garroverets
Entire Place • 6 bedrooms
Es Blanquer De Na Fani
Entire Place • 2 bedrooms
Can Putxeta
Entire Place • 3 bedrooms
Note: Performance varies based on location, size, amenities, seasonality, and management quality. Data reflects the past 12 months.
Top Performing Airbnb Hosts in Binissalem (2025)
Learn from the best! This table showcases top-performing Airbnb hosts in Binissalem based on the number of properties managed and estimated total revenue over the past year. Analyze their scale and performance metrics.
| Host Name | Properties | Grossing Revenue | Stay Reviews | Avg Rating |
|---|---|---|---|---|
| Homerti | 4 | $757,398 | 57 | 4.49/5.0 |
| BeBreeze | 2 | $314,510 | 42 | 4.46/5.0 |
| Host #482664742 | 1 | $226,268 | 0 | 0.00/5.0 |
| Villafy Mallorca | 2 | $182,742 | 35 | 4.68/5.0 |
| Miguel - Interhome Group | 5 | $176,016 | 88 | 3.42/5.0 |
| Holidu | 1 | $129,832 | 13 | 4.85/5.0 |
| Mallorca Charme Home Rentals | 3 | $103,862 | 64 | 3.14/5.0 |
| Anna&Marga | 1 | $101,275 | 24 | 4.92/5.0 |
| Ana | 1 | $88,579 | 12 | 5.00/5.0 |
| Solber Rustic SL | 1 | $81,604 | 3 | 5.00/5.0 |
Analyzing the strategies of top hosts, such as their property selection, pricing, and guest communication, can offer valuable lessons for optimizing your own Airbnb operations in Binissalem.
Dive Deeper: Advanced Binissalem STR Market Data (2025)
Ready to unlock more insights? AirROI provides access to advanced metrics and comprehensive Airbnb data for Binissalem. Explore detailed analytics beyond this report to refine your investment strategy, optimize pricing, and maximize your vacation rental profits.
Explore Advanced MetricsBinissalem Short-Term Rental Market Composition (2025): Property & Room Types
Room Type Distribution
Property Type Distribution
Market Composition Insights for Binissalem
- The Binissalem Airbnb market composition is heavily skewed towards Entire Home/Apt listings, which make up 97.2% of the 71 active rentals. This indicates strong guest preference for privacy and space.
- Looking at the property type distribution in Binissalem, House properties are the most common (87.3%), reflecting the local real estate landscape.
- Houses represent a significant 87.3% portion, catering likely to families or larger groups.
- Smaller segments like others, hotel/boutique (combined 2.8%) offer potential for unique stay experiences.
Binissalem Airbnb Room Capacity Analysis (2025): Bedroom Distribution
Distribution of Listings by Number of Bedrooms
Room Capacity Insights for Binissalem
- The dominant room capacity in Binissalem is 3 bedrooms listings, making up 33.8% of the market. This suggests a strong demand for properties suitable for families or small groups.
- Together, 3 bedrooms and 4 bedrooms properties represent 57.7% of the active Airbnb listings in Binissalem, indicating a high concentration in these sizes.
- A significant 70.4% of listings offer 3+ bedrooms, catering to larger groups and families seeking more space in Binissalem.
Binissalem Vacation Rental Guest Capacity Trends (2025)
Distribution of Listings by Guest Capacity
Guest Capacity Insights for Binissalem
- The most common guest capacity trend in Binissalem vacation rentals is listings accommodating 8+ guests (32.4%). This suggests the primary traveler segment is likely larger groups.
- Properties designed for 8+ guests and 6 guests dominate the Binissalem STR market, accounting for 63.4% of listings.
- 63.4% of properties accommodate 6+ guests, serving the market segment for larger families or group travel in Binissalem.
- On average, properties in Binissalem are equipped to host 5.9 guests.
Binissalem Airbnb Booking Patterns (2025): Available vs. Booked Days
Available Days Distribution
Booked Days Distribution
Booking Pattern Insights for Binissalem
- The most common availability pattern in Binissalem falls within the 271-366 days range, representing 40.8% of listings. This suggests many properties have significant open periods on their calendars.
- Approximately 78.8% of listings show high availability (181+ days open annually), indicating potential for increased bookings or specific owner usage patterns.
- For booked days, the 91-180 days range is most frequent in Binissalem (35.2%), reflecting common guest stay durations or potential owner blocking patterns.
- A notable 23.9% of properties secure long booking periods (181+ days booked per year), highlighting successful long-term rental strategies or significant owner usage.
Binissalem Airbnb Minimum Stay Requirements Analysis
Distribution of Listings by Minimum Night Requirement
1 Night
20 listings
30.8% of total
2 Nights
1 listings
1.5% of total
3 Nights
5 listings
7.7% of total
4-6 Nights
23 listings
35.4% of total
7-29 Nights
2 listings
3.1% of total
30+ Nights
14 listings
21.5% of total
Key Insights
- The most prevalent minimum stay requirement in Binissalem is 4-6 Nights, adopted by 35.4% of listings. This highlights the market's preference for longer commitments.
- A significant segment (21.5%) caters to monthly stays (30+ nights) in Binissalem, pointing to opportunities in the extended-stay market.
Recommendations
- Align with the market by considering a 4-6 Nights minimum stay, as 35.4% of Binissalem hosts use this setting.
- Explore offering discounts for stays of 30+ nights to attract the 21.5% of the market seeking extended stays.
- Adjust minimum nights based on seasonality – potentially shorter during low season and longer during peak demand periods in Binissalem.
Binissalem Airbnb Cancellation Policy Trends Analysis (2025)
Super Strict 60 Days
2 listings
3.4% of total
Flexible
2 listings
3.4% of total
Moderate
8 listings
13.8% of total
Firm
22 listings
37.9% of total
Strict
24 listings
41.4% of total
Cancellation Policy Insights for Binissalem
- The prevailing Airbnb cancellation policy trend in Binissalem is Strict, used by 41.4% of listings.
- A majority (79.3%) of hosts in Binissalem utilize Firm or Strict policies, indicating a market where hosts prioritize booking security.
Recommendations for Hosts
- Consider adopting a Strict policy to align with the 41.4% market standard in Binissalem.
- With 41.4% using Strict terms, this is a viable option in Binissalem, particularly for high-value properties or during peak demand periods.
- Regularly review your cancellation policy against competitors and market demand shifts in Binissalem.
Binissalem STR Booking Lead Time Analysis (2025)
Average Booking Lead Time by Month
Booking Lead Time Insights for Binissalem
- The overall average booking lead time for vacation rentals in Binissalem is 98 days.
- Guests book furthest in advance for stays during July (average 154 days), likely coinciding with peak travel demand or local events.
- The shortest booking windows occur for stays in February (average 61 days), indicating more last-minute travel plans during this time.
- Seasonally, Summer (133 days avg.) sees the longest lead times, while Winter (68 days avg.) has the shortest, reflecting typical travel planning cycles.
Recommendations for Hosts
- Use the overall average lead time (98 days) as a baseline for your pricing and availability strategy in Binissalem.
- For July stays, consider implementing length-of-stay discounts or slightly higher rates for bookings made less than 154 days out to capitalize on advance planning.
- Target marketing efforts for the Summer season well in advance (at least 133 days) to capture early planners.
- Monitor your own booking lead times against these Binissalem averages to identify opportunities for dynamic pricing adjustments.
Popular & Essential Airbnb Amenities in Binissalem (2025)
Amenity Prevalence
Amenity Insights for Binissalem
- Essential amenities in Binissalem that guests expect include: Kitchen, Wifi, Washer, TV. Lacking these (any) could significantly impact bookings.
- Popular amenities like Hot water, Essentials, Dishes and silverware are common but not universal. Offering these can provide a competitive edge.
Recommendations for Hosts
- Ensure your listing includes all essential amenities for Binissalem: Kitchen, Wifi, Washer, TV.
- Prioritize adding missing essentials: Washer, TV.
- Consider adding popular differentiators like Hot water or Essentials to increase appeal.
- Highlight unique or less common amenities you offer (e.g., hot tub, dedicated workspace, EV charger) in your listing description and photos.
- Regularly check competitor amenities in Binissalem to stay competitive.
Binissalem Airbnb Guest Demographics & Profile Analysis (2025)
Guest Profile Summary for Binissalem
- The typical guest profile for Airbnb in Binissalem consists of predominantly international visitors (90%), with top international origins including United Kingdom, typically belonging to the Post-2000s (Gen Z/Alpha) group (50%), primarily speaking English or German.
- Domestic travelers account for 10.0% of guests.
- Key international markets include Germany (28.9%) and United Kingdom (22.2%).
- Top languages spoken are English (39.5%) followed by German (20.7%).
- A significant demographic segment is the Post-2000s (Gen Z/Alpha) group, representing 50% of guests.
Recommendations for Hosts
- Focus marketing internationally, particularly towards travelers from United Kingdom.
- Tailor amenities and listing descriptions to appeal to the dominant Post-2000s (Gen Z/Alpha) demographic (e.g., highlight fast WiFi, smart home features, local guides).
- Highlight unique local experiences or amenities relevant to the primary guest profile.
- Consider seasonal promotions aligned with peak travel times for key origin markets.
Nearby Short-Term Rental Market Comparison
How does the Binissalem Airbnb market stack up against its neighbors? Compare key performance metrics like average monthly revenue, ADR, and occupancy rates in surrounding areas to understand the broader regional STR landscape.
| Market | Active Properties | Monthly Revenue | Daily Rate | Avg. Occupancy |
|---|---|---|---|---|
| sa Carroca | 98 | $10,551 | $862.81 | 52% |
| Can Germà | 25 | $9,819 | $927.22 | 47% |
| Can Tomàs | 26 | $9,321 | $878.17 | 47% |
| Es Cubells | 31 | $8,883 | $1002.54 | 54% |
| Sant Rafel de sa Creu | 46 | $7,518 | $730.00 | 45% |
| Vista Mar | 64 | $7,047 | $750.94 | 46% |
| Algaida | 79 | $6,918 | $709.08 | 48% |
| Vista Alegre | 18 | $6,413 | $1214.28 | 42% |
| Mancor de la Vall | 35 | $6,389 | $620.29 | 54% |
| Sant Josep de sa Talaia | 256 | $6,308 | $699.24 | 48% |