Orio Airbnb Market Analysis 2025: Short Term Rental Data & Vacation Rental Statistics in Autonomous Community of the Basque Country, Spain
Is Airbnb profitable in Orio in 2025? Explore comprehensive Airbnb analytics for Orio, Autonomous Community of the Basque Country, Spain to uncover income potential. This 2025 STR market report for Orio, based on AirROI data from April 2024 to March 2025, reveals key trends in the niche market of 33 active listings.
Whether you're considering an Airbnb investment in Orio, optimizing your existing vacation rental, or exploring rental arbitrage opportunities, understanding the Orio Airbnb data is crucial. Navigating the high regulation landscape is key to maximizing your short term rental income potential. Let's dive into the specifics.
Key Orio Airbnb Performance Metrics Overview
Monthly Airbnb Revenue Variations & Income Potential in Orio (2025)
Understanding the monthly revenue variations for Airbnb listings in Orio is key to maximizing your short term rental income potential. Seasonality significantly impacts earnings. Our analysis, based on data from the past 12 months, shows that the peak revenue month for STRs in Orio is typically August, while February often presents the lowest earnings, highlighting opportunities for strategic pricing adjustments during shoulder and low seasons. Explore the typical Airbnb income in Orio across different performance tiers:
- Best-in-class properties (Top 10%) achieve $5,634+ monthly, often utilizing dynamic pricing and superior guest experiences.
- Strong performing properties (Top 25%) earn $3,633 or more, indicating effective management and desirable locations/amenities.
- Typical properties (Median) generate around $1,796 per month, representing the average market performance.
- Entry-level properties (Bottom 25%) see earnings around $908, often with potential for optimization.
Average Monthly Airbnb Earnings Trend in Orio
Orio Airbnb Occupancy Rate Trends (2025)
Maximize your bookings by understanding the Orio STR occupancy trends. Seasonal demand shifts significantly influence how often properties are booked. Typically, Augustsees the highest demand (peak season occupancy), while March experiences the lowest (low season). Effective strategies, like adjusting minimum stays or offering promotions, can boost occupancy during slower periods. Here's how different property tiers perform in Orio:
- Best-in-class properties (Top 10%) achieve 67%+ occupancy, indicating high desirability and potentially optimized availability.
- Strong performing properties (Top 25%) maintain 49% or higher occupancy, suggesting good market fit and guest satisfaction.
- Typical properties (Median) have an occupancy rate around 32%.
- Entry-level properties (Bottom 25%) average 21% occupancy, potentially facing higher vacancy.
Average Monthly Occupancy Rate Trend in Orio
Average Daily Rate (ADR) Airbnb Trends in Orio (2025)
Effective short term rental pricing strategy in Orio involves understanding monthly ADR fluctuations. The Average Daily Rate (ADR) for Airbnb in Orio typically peaks in August and dips lowest during February. Leveraging Airbnb dynamic pricing tools or strategies based on this seasonality can significantly boost revenue. Here's a look at the typical nightly rates achieved:
- Best-in-class properties (Top 10%) command rates of $318+ per night, often due to premium features or locations.
- Strong performing properties (Top 25%) achieve nightly rates of $230 or more.
- Typical properties (Median) charge around $174 per night.
- Entry-level properties (Bottom 25%) earn around $117 per night.
Average Daily Rate (ADR) Trend by Month in Orio
Get Live Orio Market Intelligence 👇

Explore Real-time Analytics
Airbnb Seasonality Analysis & Trends in Orio (2025)
Peak Season (August, July, June)
- Revenue averages $4,315 per month
- Occupancy rates average 56.8%
- Daily rates average $210
Shoulder Season
- Revenue averages $2,242 per month
- Occupancy maintains around 34.2%
- Daily rates hold near $184
Low Season (January, February, March)
- Revenue drops to average $1,083 per month
- Occupancy decreases to average 20.7%
- Daily rates adjust to average $169
Seasonality Insights for Orio
- The Airbnb seasonality in Orio shows highly seasonal trends requiring careful strategy. While the sections above show seasonal averages, it's also insightful to look at the extremes:
- During the high season, the absolute peak month showcases Orio's highest earning potential, with monthly revenues capable of climbing to $5,336, occupancy reaching a high of 68.8%, and ADRs peaking at $219.
- Conversely, the slowest single month of the year, typically falling within the low season, marks the market's lowest point. In this month, revenue might dip to $880, occupancy could drop to 20.5%, and ADRs may adjust down to $165.
- Understanding both the seasonal averages and these monthly peaks and troughs in revenue, occupancy, and ADR is crucial for maximizing your Airbnb profit potential in Orio.
Seasonal Strategies for Maximizing Profit
- Peak Season: Maximize revenue through premium pricing and potentially longer minimum stays. Ensure high availability.
- Low Season: Offer competitive pricing, special promotions (e.g., extended stay discounts), and flexible cancellation policies. Target off-season travelers like remote workers or budget-conscious guests.
- Shoulder Seasons: Implement dynamic pricing that balances peak and low rates. Target weekend travelers or specific events. Offer slightly more flexible terms than peak season.
- Regularly analyze your own performance against these Orio seasonality benchmarks and adjust your pricing and availability strategy accordingly.
Best Areas for Airbnb Investment in Orio (2025)
Exploring the top neighborhoods for short-term rentals in Orio? This section highlights key areas, outlining why they are attractive for hosts and guests, along with notable local attractions. Consider these locations based on your target guest profile and investment strategy.
| Neighborhood / Area | Why Host Here? (Target Guests & Appeal) | Key Attractions & Landmarks |
|---|---|---|
| Getaria | Charming coastal town known for its picturesque views and wine culture. Perfect for tourists looking for a quaint escape and delicious local cuisine. | San Prudentzio Church, Cristobal Balenciaga Museum, Getaria Beach, Txakoli wineries, Old Town with traditional fishing port |
| Zarautz | Popular beach destination famous for its long sandy beach ideal for surfing. Attracts sun-seekers and those looking for vibrant beach life. | Zarautz Beach, Surf schools, Paseo Marítimo, Gaztetxe Zarautz, Culinary tours featuring local pintxos |
| Donostia-San Sebastián | Iconic city renowned for its beautiful beaches, exceptional dining scene, and vibrant culture. A top destination for foodies and beach lovers. | La Concha Beach, Old Town (Parte Vieja), Pintxos bars, Monte Igueldo, San Telmo Museoa |
| Orio | Quaint village offering scenic views and a peaceful coastal experience. Great for families and individuals looking for a relaxed atmosphere amid nature. | Orio Beach, Txangurro Fishing Port, Basque cuisine restaurants, Walking trails along the coast, Orio's famous surf spots |
| Pasaia | Small charming coastal town known for its natural harbor and historical significance. Attracts those interested in maritime culture and history. | Pasaia Marina, San Juan Bautista (traditional boat), Historical buildings, Scenic boat tours, Elbira Zipitria Zentroa |
| Hondarribia | Picturesque town located at the French border, known for its medieval architecture and vibrant atmosphere. Popular with visitors for its charm and excellent dining. | Hondarribia Castle, Old town (Parte vieja), beach and promenade, Basque tapas bars, Jaizkibel Mountain trails |
| Bermeo | Fishing town that serves as a gateway to the beautiful Urdaibai Biosphere Reserve. Attracts nature lovers and those interested in Basque culture. | Bermeo Port, San Juan de Gaztelugatxe, Urdaibai Biosphere Reserve, Old town with unique architecture, Local seafood restaurants |
| Lekeitio | Charming coastal town famous for its beautiful beach and rich fishing traditions. Offers an authentic Basque seaside experience. | Lekeitio Beach, San Nikolas Island, Historical center, Fishermen's quarter, Local festivals and traditions |
Understanding Airbnb License Requirements & STR Laws in Orio (2025)
Yes, Orio, Autonomous Community of the Basque Country, Spain enforces high STR regulations. Obtaining a license and ensuring compliance is almost certainly required according to current 2025 STR laws. Always verify the latest short term rental regulations and Airbnb license requirements directly with local government authorities for Orio to ensure full compliance before hosting.
(Source: AirROI data, 2025, based on 36% licensed listings)
Top Performing Airbnb Properties in Orio (2025)
Benchmark your potential! Explore examples of top-performing Airbnb properties in Oriobased on Trailing Twelve Month (TTM) revenue. Analyze their characteristics, revenue, occupancy rate, and ADR to understand what drives success in this market.
Igeldo Agrotourism
Entire Place • 6 bedrooms

San Sebastian, Orio, beach apartment with garage
Entire Place • 2 bedrooms

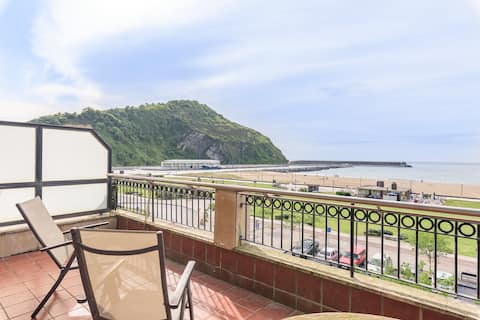
Beach, River & Mount in 1st Line
Entire Place • 2 bedrooms
Balea Duplex | Local Rentss
Entire Place • 3 bedrooms

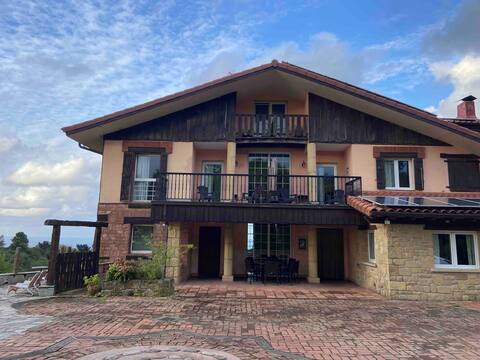
Beautiful townhouse in a unique setting.
Entire Place • 3 bedrooms
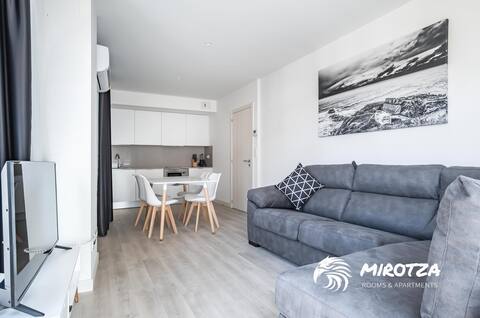
MIROTZA 22,31,32,43- APARTMENT 2 BEDROOMS
Entire Place • 2 bedrooms
Note: Performance varies based on location, size, amenities, seasonality, and management quality. Data reflects the past 12 months.
Top Performing Airbnb Hosts in Orio (2025)
Learn from the best! This table showcases top-performing Airbnb hosts in Orio based on the number of properties managed and estimated total revenue over the past year. Analyze their scale and performance metrics.
| Host Name | Properties | Grossing Revenue | Stay Reviews | Avg Rating |
|---|---|---|---|---|
| Amaya | 6 | $117,154 | 175 | 4.79/5.0 |
| Mari Jose | 1 | $86,046 | 40 | 4.95/5.0 |
| Basque Local Rentss | 4 | $77,532 | 72 | 4.44/5.0 |
| Isabel | 1 | $52,602 | 167 | 4.80/5.0 |
| Alexandra&Family | 1 | $51,676 | 16 | 4.56/5.0 |
| Maria | 1 | $38,857 | 42 | 4.98/5.0 |
| Mª Luisa | 1 | $33,178 | 169 | 4.98/5.0 |
| Eider | 1 | $26,733 | 19 | 4.84/5.0 |
| Jone | 1 | $26,381 | 90 | 4.98/5.0 |
| Iban | 1 | $25,110 | 29 | 4.45/5.0 |
Analyzing the strategies of top hosts, such as their property selection, pricing, and guest communication, can offer valuable lessons for optimizing your own Airbnb operations in Orio.
Dive Deeper: Advanced Orio STR Market Data (2025)
Ready to unlock more insights? AirROI provides access to advanced metrics and comprehensive Airbnb data for Orio. Explore detailed analytics beyond this report to refine your investment strategy, optimize pricing, and maximize your vacation rental profits.
Explore Advanced MetricsOrio Short-Term Rental Market Composition (2025): Property & Room Types
Room Type Distribution
Property Type Distribution
Market Composition Insights for Orio
- The Orio Airbnb market composition is heavily skewed towards Entire Home/Apt listings, which make up 75.8% of the 33 active rentals. This indicates strong guest preference for privacy and space.
- Looking at the property type distribution in Orio, Apartment/Condo properties are the most common (69.7%), reflecting the local real estate landscape.
- Houses represent a significant 18.2% portion, catering likely to families or larger groups.
- The presence of 9.1% Hotel/Boutique listings indicates integration with traditional hospitality.
- Smaller segments like others (combined 3.0%) offer potential for unique stay experiences.
Orio Airbnb Room Capacity Analysis (2025): Bedroom Distribution
Distribution of Listings by Number of Bedrooms
Room Capacity Insights for Orio
- The dominant room capacity in Orio is 2 bedrooms listings, making up 36.4% of the market. This suggests a strong demand for properties suitable for couples or solo travelers.
- Together, 2 bedrooms and 3 bedrooms properties represent 60.6% of the active Airbnb listings in Orio, indicating a high concentration in these sizes.
- A significant 27.2% of listings offer 3+ bedrooms, catering to larger groups and families seeking more space in Orio.
Orio Vacation Rental Guest Capacity Trends (2025)
Distribution of Listings by Guest Capacity
Guest Capacity Insights for Orio
- The most common guest capacity trend in Orio vacation rentals is listings accommodating 4 guests (36.4%). This suggests the primary traveler segment is likely small families or groups.
- Properties designed for 4 guests and 2 guests dominate the Orio STR market, accounting for 51.6% of listings.
- 18.2% of properties accommodate 6+ guests, serving the market segment for larger families or group travel in Orio.
- On average, properties in Orio are equipped to host 3.7 guests.
Orio Airbnb Booking Patterns (2025): Available vs. Booked Days
Available Days Distribution
Booked Days Distribution
Booking Pattern Insights for Orio
- The most common availability pattern in Orio falls within the 271-366 days range, representing 48.5% of listings. This suggests many properties have significant open periods on their calendars.
- Approximately 90.9% of listings show high availability (181+ days open annually), indicating potential for increased bookings or specific owner usage patterns.
- For booked days, the 31-90 days range is most frequent in Orio (45.5%), reflecting common guest stay durations or potential owner blocking patterns.
- A notable 9.1% of properties secure long booking periods (181+ days booked per year), highlighting successful long-term rental strategies or significant owner usage.
Orio Airbnb Minimum Stay Requirements Analysis
Distribution of Listings by Minimum Night Requirement
1 Night
9 listings
29% of total
2 Nights
9 listings
29% of total
3 Nights
3 listings
9.7% of total
4-6 Nights
1 listings
3.2% of total
7-29 Nights
1 listings
3.2% of total
30+ Nights
8 listings
25.8% of total
Key Insights
- The most prevalent minimum stay requirement in Orio is 1 Night, adopted by 29% of listings. This highlights the market's preference for shorter, flexible bookings.
- A significant segment (25.8%) caters to monthly stays (30+ nights) in Orio, pointing to opportunities in the extended-stay market.
Recommendations
- Align with the market by considering a 1 Night minimum stay, as 29% of Orio hosts use this setting.
- If feasible, allowing 1-night stays, especially midweek or during low season, could capture last-minute bookings, as only 29% currently do.
- Explore offering discounts for stays of 30+ nights to attract the 25.8% of the market seeking extended stays.
- Adjust minimum nights based on seasonality – potentially shorter during low season and longer during peak demand periods in Orio.
Orio Airbnb Cancellation Policy Trends Analysis (2025)
Flexible
12 listings
41.4% of total
Moderate
7 listings
24.1% of total
Firm
5 listings
17.2% of total
Strict
5 listings
17.2% of total
Cancellation Policy Insights for Orio
- The prevailing Airbnb cancellation policy trend in Orio is Flexible, used by 41.4% of listings.
- There's a relatively balanced mix between guest-friendly (65.5%) and stricter (34.4%) policies, offering choices for different guest needs.
Recommendations for Hosts
- Consider adopting a Flexible policy to align with the 41.4% market standard in Orio.
- Regularly review your cancellation policy against competitors and market demand shifts in Orio.
Orio STR Booking Lead Time Analysis (2025)
Average Booking Lead Time by Month
Booking Lead Time Insights for Orio
- The overall average booking lead time for vacation rentals in Orio is 51 days.
- Guests book furthest in advance for stays during August (average 86 days), likely coinciding with peak travel demand or local events.
- The shortest booking windows occur for stays in February (average 28 days), indicating more last-minute travel plans during this time.
- Seasonally, Summer (74 days avg.) sees the longest lead times, while Winter (41 days avg.) has the shortest, reflecting typical travel planning cycles.
Recommendations for Hosts
- Use the overall average lead time (51 days) as a baseline for your pricing and availability strategy in Orio.
- For August stays, consider implementing length-of-stay discounts or slightly higher rates for bookings made less than 86 days out to capitalize on advance planning.
- Target marketing efforts for the Summer season well in advance (at least 74 days) to capture early planners.
- Monitor your own booking lead times against these Orio averages to identify opportunities for dynamic pricing adjustments.
Popular & Essential Airbnb Amenities in Orio (2025)
Amenity Prevalence
Amenity Insights for Orio
- Essential amenities in Orio that guests expect include: TV. Lacking these (this) could significantly impact bookings.
- Popular amenities like Wifi, Kitchen, Essentials are common but not universal. Offering these can provide a competitive edge.
- Warning: Wifi is not universally provided but is considered essential globally. Ensure reliable Wifi is offered.
Recommendations for Hosts
- Ensure your listing includes all essential amenities for Orio: TV.
- Prioritize adding missing essentials: TV.
- Consider adding popular differentiators like Wifi or Kitchen to increase appeal.
- Highlight unique or less common amenities you offer (e.g., hot tub, dedicated workspace, EV charger) in your listing description and photos.
- Regularly check competitor amenities in Orio to stay competitive.
Orio Airbnb Guest Demographics & Profile Analysis (2025)
Guest Profile Summary for Orio
- The typical guest profile for Airbnb in Orio consists of a mix of domestic (42%) and international guests, with top international origins including France, typically belonging to the Post-2000s (Gen Z/Alpha) group (50%), primarily speaking English or Spanish.
- Domestic travelers account for 41.7% of guests.
- Key international markets include Spain (41.7%) and France (25.1%).
- Top languages spoken are English (34.8%) followed by Spanish (28%).
- A significant demographic segment is the Post-2000s (Gen Z/Alpha) group, representing 50% of guests.
Recommendations for Hosts
- Balance marketing efforts between domestic and international channels based on the guest mix.
- Tailor amenities and listing descriptions to appeal to the dominant Post-2000s (Gen Z/Alpha) demographic (e.g., highlight fast WiFi, smart home features, local guides).
- Highlight unique local experiences or amenities relevant to the primary guest profile.
- Consider seasonal promotions aligned with peak travel times for key origin markets.
Nearby Short-Term Rental Market Comparison
How does the Orio Airbnb market stack up against its neighbors? Compare key performance metrics like average monthly revenue, ADR, and occupancy rates in surrounding areas to understand the broader regional STR landscape.
| Market | Active Properties | Monthly Revenue | Daily Rate | Avg. Occupancy |
|---|---|---|---|---|
| San Sebastián | 1,426 | $3,546 | $262.81 | 49% |
| Gautegiz Arteaga | 21 | $2,865 | $293.66 | 38% |
| Labastida/Bastida | 11 | $2,662 | $268.80 | 34% |
| Barrika | 13 | $2,629 | $314.61 | 41% |
| Esteribar | 20 | $2,574 | $276.81 | 32% |
| Hernani | 11 | $2,572 | $345.16 | 40% |
| Dima | 11 | $2,422 | $332.91 | 42% |
| Lège-Cap-Ferret | 1,210 | $2,420 | $337.40 | 41% |
| Larraun | 18 | $2,387 | $225.55 | 40% |
| Erandio | 16 | $2,361 | $164.90 | 56% |