Mungia Airbnb Market Analysis 2025: Short Term Rental Data & Vacation Rental Statistics in Autonomous Community of the Basque Country, Spain
Is Airbnb profitable in Mungia in 2025? Explore comprehensive Airbnb analytics for Mungia, Autonomous Community of the Basque Country, Spain to uncover income potential. This 2025 STR market report for Mungia, based on AirROI data from April 2024 to March 2025, reveals key trends in the niche market of 27 active listings.
Whether you're considering an Airbnb investment in Mungia, optimizing your existing vacation rental, or exploring rental arbitrage opportunities, understanding the Mungia Airbnb data is crucial. Understanding the local regulations is key to maximizing your short term rental income potential. Let's dive into the specifics.
Key Mungia Airbnb Performance Metrics Overview
Monthly Airbnb Revenue Variations & Income Potential in Mungia (2025)
Understanding the monthly revenue variations for Airbnb listings in Mungia is key to maximizing your short term rental income potential. Seasonality significantly impacts earnings. Our analysis, based on data from the past 12 months, shows that the peak revenue month for STRs in Mungia is typically August, while February often presents the lowest earnings, highlighting opportunities for strategic pricing adjustments during shoulder and low seasons. Explore the typical Airbnb income in Mungia across different performance tiers:
- Best-in-class properties (Top 10%) achieve $5,581+ monthly, often utilizing dynamic pricing and superior guest experiences.
- Strong performing properties (Top 25%) earn $2,818 or more, indicating effective management and desirable locations/amenities.
- Typical properties (Median) generate around $1,573 per month, representing the average market performance.
- Entry-level properties (Bottom 25%) see earnings around $1,025, often with potential for optimization.
Average Monthly Airbnb Earnings Trend in Mungia
Mungia Airbnb Occupancy Rate Trends (2025)
Maximize your bookings by understanding the Mungia STR occupancy trends. Seasonal demand shifts significantly influence how often properties are booked. Typically, Augustsees the highest demand (peak season occupancy), while February experiences the lowest (low season). Effective strategies, like adjusting minimum stays or offering promotions, can boost occupancy during slower periods. Here's how different property tiers perform in Mungia:
- Best-in-class properties (Top 10%) achieve 61%+ occupancy, indicating high desirability and potentially optimized availability.
- Strong performing properties (Top 25%) maintain 49% or higher occupancy, suggesting good market fit and guest satisfaction.
- Typical properties (Median) have an occupancy rate around 35%.
- Entry-level properties (Bottom 25%) average 21% occupancy, potentially facing higher vacancy.
Average Monthly Occupancy Rate Trend in Mungia
Average Daily Rate (ADR) Airbnb Trends in Mungia (2025)
Effective short term rental pricing strategy in Mungia involves understanding monthly ADR fluctuations. The Average Daily Rate (ADR) for Airbnb in Mungia typically peaks in December and dips lowest during October. Leveraging Airbnb dynamic pricing tools or strategies based on this seasonality can significantly boost revenue. Here's a look at the typical nightly rates achieved:
- Best-in-class properties (Top 10%) command rates of $461+ per night, often due to premium features or locations.
- Strong performing properties (Top 25%) achieve nightly rates of $214 or more.
- Typical properties (Median) charge around $136 per night.
- Entry-level properties (Bottom 25%) earn around $97 per night.
Average Daily Rate (ADR) Trend by Month in Mungia
Get Live Mungia Market Intelligence 👇

Explore Real-time Analytics
Airbnb Seasonality Analysis & Trends in Mungia (2025)
Peak Season (August, June, May)
- Revenue averages $4,184 per month
- Occupancy rates average 52.7%
- Daily rates average $193
Shoulder Season
- Revenue averages $2,270 per month
- Occupancy maintains around 36.2%
- Daily rates hold near $189
Low Season (January, February, December)
- Revenue drops to average $1,112 per month
- Occupancy decreases to average 19.4%
- Daily rates adjust to average $200
Seasonality Insights for Mungia
- The Airbnb seasonality in Mungia shows highly seasonal trends requiring careful strategy. While the sections above show seasonal averages, it's also insightful to look at the extremes:
- During the high season, the absolute peak month showcases Mungia's highest earning potential, with monthly revenues capable of climbing to $4,470, occupancy reaching a high of 68.5%, and ADRs peaking at $204.
- Conversely, the slowest single month of the year, typically falling within the low season, marks the market's lowest point. In this month, revenue might dip to $833, occupancy could drop to 18.1%, and ADRs may adjust down to $178.
- Understanding both the seasonal averages and these monthly peaks and troughs in revenue, occupancy, and ADR is crucial for maximizing your Airbnb profit potential in Mungia.
Seasonal Strategies for Maximizing Profit
- Peak Season: Maximize revenue through premium pricing and potentially longer minimum stays. Ensure high availability.
- Low Season: Offer competitive pricing, special promotions (e.g., extended stay discounts), and flexible cancellation policies. Target off-season travelers like remote workers or budget-conscious guests.
- Shoulder Seasons: Implement dynamic pricing that balances peak and low rates. Target weekend travelers or specific events. Offer slightly more flexible terms than peak season.
- Regularly analyze your own performance against these Mungia seasonality benchmarks and adjust your pricing and availability strategy accordingly.
Best Areas for Airbnb Investment in Mungia (2025)
Exploring the top neighborhoods for short-term rentals in Mungia? This section highlights key areas, outlining why they are attractive for hosts and guests, along with notable local attractions. Consider these locations based on your target guest profile and investment strategy.
| Neighborhood / Area | Why Host Here? (Target Guests & Appeal) | Key Attractions & Landmarks |
|---|---|---|
| Mungia Center | The historical and cultural heart of Mungia, offering visitors a glimpse into Basque heritage. It's a convenient area for tourists to access local attractions, dining, and public transport. | Mungia Church, Jardines del Botánico, Ermita de San Miguel, Local Basque cuisine restaurants, Weekly markets |
| Galdakao Park | A family-friendly area with recreational facilities and parks. Ideal for families visiting the Basque Country who want easy access to outdoor activities and green spaces. | Galdakao Park, Playgrounds, Walking trails, Picnic areas |
| San Juan de Gaztelugatxe | Famous for its stunning cliffs and iconic hermitage, this area attracts nature lovers and photographers. An excellent spot for guests seeking a unique natural experience. | Gaztelugatxe Hermitage, Hiking trails, Scenic views, Photography spots |
| Wrapping Nature Trail | This area offers beautiful nature trails for hiking enthusiasts. Visitors can explore the lush landscapes and enjoy the tranquility away from urban life. | Nature trails, Birdwatching, Scenic viewpoints |
| Begetxo | A charming coastal town nearby, known for its beaches and relaxed atmosphere. Great for tourists looking for a seaside experience without being in a larger city. | Begetxo Beach, Coastal walks, Beachfront cafés, Diverse marine activities |
| Getxo Harbour | A picturesque harbour area offering various maritime activities and dining. A popular area for tourists looking to enjoy the sea and local marine cuisine. | Getxo Marina, Boardwalks, Seafood restaurants, Boat tours |
| Mungia Vineyards | Located near Mungia, this area is perfect for wine enthusiasts. Visitors can explore vineyards and enjoy wine tasting experiences, highlighting the local gastronomy. | Vineyard tours, Wine tasting events, Local wine shops, Gastronomy tours |
| Biscay Coast | The breathtaking Biscay Coast offers stunning views and exquisite natural landscapes. Ideal for those seeking outdoor adventures such as hiking, surfing, or simply relaxing by the sea. | Cliffs of Biscay, Surf spots, Scenic beaches, Outdoor recreational activities |
Understanding Airbnb License Requirements & STR Laws in Mungia (2025)
With 26% of listings showing registration in 2025, understanding potential Airbnb license requirements is crucial in Mungia. Always verify the latest short term rental regulations and Airbnb license requirements directly with local government authorities for Mungia to ensure full compliance before hosting.
(Source: AirROI data, 2025, based on 26% licensed listings)
Top Performing Airbnb Properties in Mungia (2025)
Benchmark your potential! Explore examples of top-performing Airbnb properties in Mungiabased on Trailing Twelve Month (TTM) revenue. Analyze their characteristics, revenue, occupancy rate, and ADR to understand what drives success in this market.

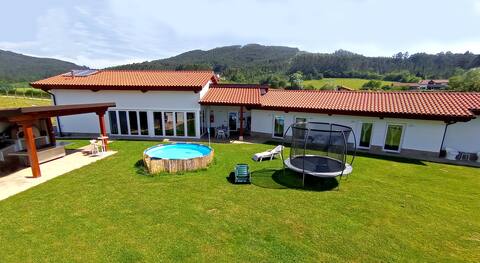
Casa Markaida with swimming pool
Entire Place • 5 bedrooms
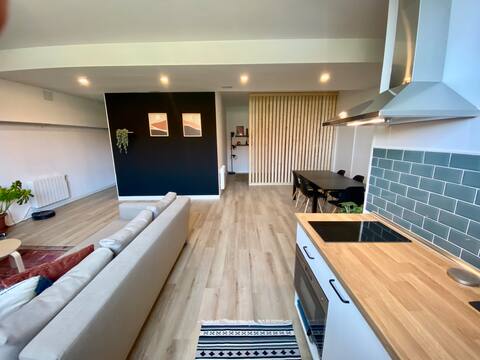
Country house between the sea and the mountains
Entire Place • 5 bedrooms
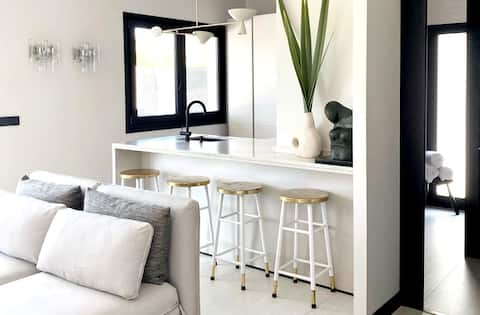
Separate apartment
Entire Place • 2 bedrooms

Golf & Pool
Entire Place • 6 bedrooms
Studio apartment with garden in chalet. Laukariz
Entire Place • 1 bedroom
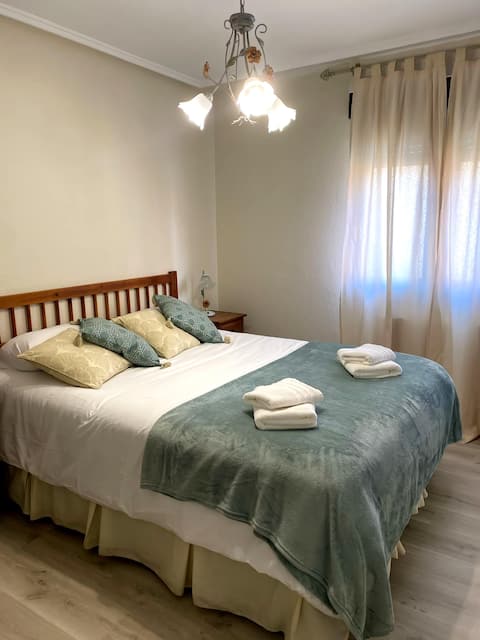
Centrally located apartment in Mungia.
Entire Place • 3 bedrooms
Note: Performance varies based on location, size, amenities, seasonality, and management quality. Data reflects the past 12 months.
Top Performing Airbnb Hosts in Mungia (2025)
Learn from the best! This table showcases top-performing Airbnb hosts in Mungia based on the number of properties managed and estimated total revenue over the past year. Analyze their scale and performance metrics.
| Host Name | Properties | Grossing Revenue | Stay Reviews | Avg Rating |
|---|---|---|---|---|
| Pedro Maria | 1 | $119,249 | 12 | 5.00/5.0 |
| Itxaso | 1 | $72,891 | 31 | 4.90/5.0 |
| Maria | 4 | $69,631 | 198 | 3.75/5.0 |
| Sofia | 1 | $40,711 | 114 | 4.86/5.0 |
| Isabel | 1 | $39,218 | 4 | 5.00/5.0 |
| Joseba | 5 | $31,501 | 9 | 1.00/5.0 |
| Alvaro | 1 | $26,139 | 72 | 4.99/5.0 |
| Ane | 1 | $25,551 | 49 | 4.78/5.0 |
| Joana | 1 | $20,265 | 437 | 4.82/5.0 |
| Ekaitz | 1 | $19,762 | 24 | 4.71/5.0 |
Analyzing the strategies of top hosts, such as their property selection, pricing, and guest communication, can offer valuable lessons for optimizing your own Airbnb operations in Mungia.
Dive Deeper: Advanced Mungia STR Market Data (2025)
Ready to unlock more insights? AirROI provides access to advanced metrics and comprehensive Airbnb data for Mungia. Explore detailed analytics beyond this report to refine your investment strategy, optimize pricing, and maximize your vacation rental profits.
Explore Advanced MetricsMungia Short-Term Rental Market Composition (2025): Property & Room Types
Room Type Distribution
Property Type Distribution
Market Composition Insights for Mungia
- The Mungia Airbnb market composition is heavily skewed towards Entire Home/Apt listings, which make up 74.1% of the 27 active rentals. This indicates strong guest preference for privacy and space.
- Looking at the property type distribution in Mungia, House properties are the most common (51.9%), reflecting the local real estate landscape.
- Houses represent a significant 51.9% portion, catering likely to families or larger groups.
- Smaller segments like hotel/boutique (combined 3.7%) offer potential for unique stay experiences.
Mungia Airbnb Room Capacity Analysis (2025): Bedroom Distribution
Distribution of Listings by Number of Bedrooms
Room Capacity Insights for Mungia
- The dominant room capacity in Mungia is 1 bedroom listings, making up 55.6% of the market. This suggests a strong demand for properties suitable for couples or solo travelers.
- Together, 1 bedroom and 2 bedrooms properties represent 70.4% of the active Airbnb listings in Mungia, indicating a high concentration in these sizes.
- With over half the market (55.6%) consisting of studios or 1-bedroom units, Mungia is particularly well-suited for individuals or couples.
- A significant 22.2% of listings offer 3+ bedrooms, catering to larger groups and families seeking more space in Mungia.
Mungia Vacation Rental Guest Capacity Trends (2025)
Distribution of Listings by Guest Capacity
Guest Capacity Insights for Mungia
- The most common guest capacity trend in Mungia vacation rentals is listings accommodating 2 guests (25.9%). This suggests the primary traveler segment is likely couples or solo travelers.
- Properties designed for 2 guests and 4 guests dominate the Mungia STR market, accounting for 48.1% of listings.
- 25.9% of properties accommodate 6+ guests, serving the market segment for larger families or group travel in Mungia.
- On average, properties in Mungia are equipped to host 4.0 guests.
Mungia Airbnb Booking Patterns (2025): Available vs. Booked Days
Available Days Distribution
Booked Days Distribution
Booking Pattern Insights for Mungia
- The most common availability pattern in Mungia falls within the 271-366 days range, representing 44.4% of listings. This suggests many properties have significant open periods on their calendars.
- Approximately 77.7% of listings show high availability (181+ days open annually), indicating potential for increased bookings or specific owner usage patterns.
- For booked days, the 91-180 days range is most frequent in Mungia (33.3%), reflecting common guest stay durations or potential owner blocking patterns.
- A notable 22.2% of properties secure long booking periods (181+ days booked per year), highlighting successful long-term rental strategies or significant owner usage.
Mungia Airbnb Minimum Stay Requirements Analysis
Distribution of Listings by Minimum Night Requirement
1 Night
12 listings
48% of total
2 Nights
7 listings
28% of total
7-29 Nights
1 listings
4% of total
30+ Nights
5 listings
20% of total
Key Insights
- The most prevalent minimum stay requirement in Mungia is 1 Night, adopted by 48% of listings. This highlights the market's preference for shorter, flexible bookings.
- A strong majority (76.0%) of the Mungia Airbnb data shows acceptance of very short stays (1-2 nights), indicating a dynamic, high-turnover market.
- A significant segment (20%) caters to monthly stays (30+ nights) in Mungia, pointing to opportunities in the extended-stay market.
Recommendations
- Align with the market by considering a 1 Night minimum stay, as 48% of Mungia hosts use this setting.
- Explore offering discounts for stays of 30+ nights to attract the 20% of the market seeking extended stays.
- Adjust minimum nights based on seasonality – potentially shorter during low season and longer during peak demand periods in Mungia.
Mungia Airbnb Cancellation Policy Trends Analysis (2025)
Flexible
3 listings
15.8% of total
Moderate
6 listings
31.6% of total
Firm
7 listings
36.8% of total
Strict
3 listings
15.8% of total
Cancellation Policy Insights for Mungia
- The prevailing Airbnb cancellation policy trend in Mungia is Firm, used by 36.8% of listings.
- A majority (52.6%) of hosts in Mungia utilize Firm or Strict policies, indicating a market where hosts prioritize booking security.
Recommendations for Hosts
- Consider adopting a Firm policy to align with the 36.8% market standard in Mungia.
- Regularly review your cancellation policy against competitors and market demand shifts in Mungia.
Mungia STR Booking Lead Time Analysis (2025)
Average Booking Lead Time by Month
Booking Lead Time Insights for Mungia
- The overall average booking lead time for vacation rentals in Mungia is 44 days.
- Guests book furthest in advance for stays during July (average 77 days), likely coinciding with peak travel demand or local events.
- The shortest booking windows occur for stays in March (average 22 days), indicating more last-minute travel plans during this time.
- Seasonally, Summer (74 days avg.) sees the longest lead times, while Fall (32 days avg.) has the shortest, reflecting typical travel planning cycles.
Recommendations for Hosts
- Use the overall average lead time (44 days) as a baseline for your pricing and availability strategy in Mungia.
- For July stays, consider implementing length-of-stay discounts or slightly higher rates for bookings made less than 77 days out to capitalize on advance planning.
- Target marketing efforts for the Summer season well in advance (at least 74 days) to capture early planners.
- Monitor your own booking lead times against these Mungia averages to identify opportunities for dynamic pricing adjustments.
Popular & Essential Airbnb Amenities in Mungia (2025)
Amenity Prevalence
Amenity Insights for Mungia
- Essential amenities in Mungia that guests expect include: Heating, TV, Wifi. Lacking these (any) could significantly impact bookings.
- Popular amenities like Hair dryer, Hot water, Essentials are common but not universal. Offering these can provide a competitive edge.
Recommendations for Hosts
- Ensure your listing includes all essential amenities for Mungia: Heating, TV, Wifi.
- Prioritize adding missing essentials: Heating, TV, Wifi.
- Consider adding popular differentiators like Hair dryer or Hot water to increase appeal.
- Highlight unique or less common amenities you offer (e.g., hot tub, dedicated workspace, EV charger) in your listing description and photos.
- Regularly check competitor amenities in Mungia to stay competitive.
Mungia Airbnb Guest Demographics & Profile Analysis (2025)
Guest Profile Summary for Mungia
- The typical guest profile for Airbnb in Mungia consists of a mix of domestic (39%) and international guests, with top international origins including France, typically belonging to the Post-2000s (Gen Z/Alpha) group (50%), primarily speaking English or Spanish.
- Domestic travelers account for 38.7% of guests.
- Key international markets include Spain (38.7%) and France (15.9%).
- Top languages spoken are English (37.6%) followed by Spanish (21%).
- A significant demographic segment is the Post-2000s (Gen Z/Alpha) group, representing 50% of guests.
Recommendations for Hosts
- Focus marketing internationally, particularly towards travelers from France.
- Tailor amenities and listing descriptions to appeal to the dominant Post-2000s (Gen Z/Alpha) demographic (e.g., highlight fast WiFi, smart home features, local guides).
- Highlight unique local experiences or amenities relevant to the primary guest profile.
- Consider seasonal promotions aligned with peak travel times for key origin markets.
Nearby Short-Term Rental Market Comparison
How does the Mungia Airbnb market stack up against its neighbors? Compare key performance metrics like average monthly revenue, ADR, and occupancy rates in surrounding areas to understand the broader regional STR landscape.
| Market | Active Properties | Monthly Revenue | Daily Rate | Avg. Occupancy |
|---|---|---|---|---|
| San Sebastián | 1,426 | $3,546 | $262.81 | 49% |
| Gautegiz Arteaga | 21 | $2,865 | $293.66 | 38% |
| Labastida/Bastida | 11 | $2,662 | $268.80 | 34% |
| Barrika | 13 | $2,629 | $314.61 | 41% |
| Esteribar | 20 | $2,574 | $276.81 | 32% |
| Hernani | 11 | $2,572 | $345.16 | 40% |
| Dima | 11 | $2,422 | $332.91 | 42% |
| Lège-Cap-Ferret | 1,210 | $2,420 | $337.40 | 41% |
| Larraun | 18 | $2,387 | $225.55 | 40% |
| Erandio | 16 | $2,361 | $164.90 | 56% |