Busturia Airbnb Market Analysis 2025: Short Term Rental Data & Vacation Rental Statistics in Autonomous Community of the Basque Country, Spain
Is Airbnb profitable in Busturia in 2025? Explore comprehensive Airbnb analytics for Busturia, Autonomous Community of the Basque Country, Spain to uncover income potential. This 2025 STR market report for Busturia, based on AirROI data from April 2024 to March 2025, reveals key trends in the niche market of 20 active listings.
Whether you're considering an Airbnb investment in Busturia, optimizing your existing vacation rental, or exploring rental arbitrage opportunities, understanding the Busturia Airbnb data is crucial. Navigating the high regulation landscape is key to maximizing your short term rental income potential. Let's dive into the specifics.
Key Busturia Airbnb Performance Metrics Overview
Monthly Airbnb Revenue Variations & Income Potential in Busturia (2025)
Understanding the monthly revenue variations for Airbnb listings in Busturia is key to maximizing your short term rental income potential. Seasonality significantly impacts earnings. Our analysis, based on data from the past 12 months, shows that the peak revenue month for STRs in Busturia is typically July, while January often presents the lowest earnings, highlighting opportunities for strategic pricing adjustments during shoulder and low seasons. Explore the typical Airbnb income in Busturia across different performance tiers:
- Best-in-class properties (Top 10%) achieve $5,803+ monthly, often utilizing dynamic pricing and superior guest experiences.
- Strong performing properties (Top 25%) earn $4,095 or more, indicating effective management and desirable locations/amenities.
- Typical properties (Median) generate around $2,220 per month, representing the average market performance.
- Entry-level properties (Bottom 25%) see earnings around $1,059, often with potential for optimization.
Average Monthly Airbnb Earnings Trend in Busturia
Busturia Airbnb Occupancy Rate Trends (2025)
Maximize your bookings by understanding the Busturia STR occupancy trends. Seasonal demand shifts significantly influence how often properties are booked. Typically, Julysees the highest demand (peak season occupancy), while March experiences the lowest (low season). Effective strategies, like adjusting minimum stays or offering promotions, can boost occupancy during slower periods. Here's how different property tiers perform in Busturia:
- Best-in-class properties (Top 10%) achieve 75%+ occupancy, indicating high desirability and potentially optimized availability.
- Strong performing properties (Top 25%) maintain 45% or higher occupancy, suggesting good market fit and guest satisfaction.
- Typical properties (Median) have an occupancy rate around 30%.
- Entry-level properties (Bottom 25%) average 15% occupancy, potentially facing higher vacancy.
Average Monthly Occupancy Rate Trend in Busturia
Average Daily Rate (ADR) Airbnb Trends in Busturia (2025)
Effective short term rental pricing strategy in Busturia involves understanding monthly ADR fluctuations. The Average Daily Rate (ADR) for Airbnb in Busturia typically peaks in December and dips lowest during October. Leveraging Airbnb dynamic pricing tools or strategies based on this seasonality can significantly boost revenue. Here's a look at the typical nightly rates achieved:
- Best-in-class properties (Top 10%) command rates of $355+ per night, often due to premium features or locations.
- Strong performing properties (Top 25%) achieve nightly rates of $267 or more.
- Typical properties (Median) charge around $173 per night.
- Entry-level properties (Bottom 25%) earn around $130 per night.
Average Daily Rate (ADR) Trend by Month in Busturia
Get Live Busturia Market Intelligence 👇

Explore Real-time Analytics
Airbnb Seasonality Analysis & Trends in Busturia (2025)
Peak Season (July, August, May)
- Revenue averages $4,441 per month
- Occupancy rates average 52.9%
- Daily rates average $227
Shoulder Season
- Revenue averages $2,932 per month
- Occupancy maintains around 35.5%
- Daily rates hold near $225
Low Season (January, February, March)
- Revenue drops to average $1,361 per month
- Occupancy decreases to average 21.1%
- Daily rates adjust to average $235
Seasonality Insights for Busturia
- The Airbnb seasonality in Busturia shows highly seasonal trends requiring careful strategy. While the sections above show seasonal averages, it's also insightful to look at the extremes:
- During the high season, the absolute peak month showcases Busturia's highest earning potential, with monthly revenues capable of climbing to $4,803, occupancy reaching a high of 61.4%, and ADRs peaking at $249.
- Conversely, the slowest single month of the year, typically falling within the low season, marks the market's lowest point. In this month, revenue might dip to $1,249, occupancy could drop to 11.6%, and ADRs may adjust down to $211.
- Understanding both the seasonal averages and these monthly peaks and troughs in revenue, occupancy, and ADR is crucial for maximizing your Airbnb profit potential in Busturia.
Seasonal Strategies for Maximizing Profit
- Peak Season: Maximize revenue through premium pricing and potentially longer minimum stays. Ensure high availability.
- Low Season: Offer competitive pricing, special promotions (e.g., extended stay discounts), and flexible cancellation policies. Target off-season travelers like remote workers or budget-conscious guests.
- Shoulder Seasons: Implement dynamic pricing that balances peak and low rates. Target weekend travelers or specific events. Offer slightly more flexible terms than peak season.
- Regularly analyze your own performance against these Busturia seasonality benchmarks and adjust your pricing and availability strategy accordingly.
Best Areas for Airbnb Investment in Busturia (2025)
Exploring the top neighborhoods for short-term rentals in Busturia? This section highlights key areas, outlining why they are attractive for hosts and guests, along with notable local attractions. Consider these locations based on your target guest profile and investment strategy.
| Neighborhood / Area | Why Host Here? (Target Guests & Appeal) | Key Attractions & Landmarks |
|---|---|---|
| Busturia Old Town | Charming historic area with narrow streets, traditional Basque architecture, and a strong sense of local culture. Ideal for visitors seeking an authentic experience in the Basque Country. | San Juan Bautista Church, Busturia Museum, Local Tapas Bars, Historic Town Square, Scenic Views of the Countryside |
| Urdaibai Biosphere Reserve | A UNESCO Biosphere Reserve known for its stunning landscapes and diverse ecosystems. Perfect for nature lovers and outdoor enthusiasts. | Parque Natural de Urdaibai, Mundaka Beach, Gernika-Lumo Town, Birdwatching Opportunities, Hiking Trails |
| Oma Forest | Famous for its painted trees, this enchanted forest attracts visitors looking for unique experiences and stunning natural beauty. | Painted Trees of Oma, Scenic Hiking Paths, Nature Photography, Guided Tours, Picnic Areas |
| Mundaka | Known for its great surfing spots and beautiful beaches, Mundaka attracts surfers and beach lovers from around the world. | Mundaka Surf Spot, Mundaka Beach, Local Seafood Restaurants, Boat Tours, Scenic Cliff Walks |
| Gernika-Lumo | A town with rich history and cultural significance, known for the Gernika Peace Museum and vibrant local markets. | Gernika Peace Museum, Traditional Basque Markets, Pueblo de Gernika, Art and History Tours, Local Festivals |
| Bermeo | A picturesque fishing village known for its charming harbor and seafood restaurants, ideal for visitors looking to experience local culture. | Bermeo Harbor, San Juan de Gaztelugatxe, Local Seafood Markets, Cultural Events, Fishing Tours |
| Laga Beach | A beautiful beach surrounded by stunning cliffs, popular for its natural beauty and outdoor activities. | Swimming and Sunbathing, Hiking Trails in the Cliffs, Local Beach Bars, Wildlife Watching, Surfing Spots |
| Elantxobe | A small coastal town with stunning views and unique architecture. It’s perfect for visitors seeking tranquility and scenic beauty. | Elantxobe Harbor, Scenic Cliff Views, Traditional Basque Cuisine, Hiking Trails, Cultural Experiences |
Understanding Airbnb License Requirements & STR Laws in Busturia (2025)
Yes, Busturia, Autonomous Community of the Basque Country, Spain enforces high STR regulations. Obtaining a license and ensuring compliance is almost certainly required according to current 2025 STR laws. Always verify the latest short term rental regulations and Airbnb license requirements directly with local government authorities for Busturia to ensure full compliance before hosting.
(Source: AirROI data, 2025, based on 55% licensed listings)
Top Performing Airbnb Properties in Busturia (2025)
Benchmark your potential! Explore examples of top-performing Airbnb properties in Busturiabased on Trailing Twelve Month (TTM) revenue. Analyze their characteristics, revenue, occupancy rate, and ADR to understand what drives success in this market.
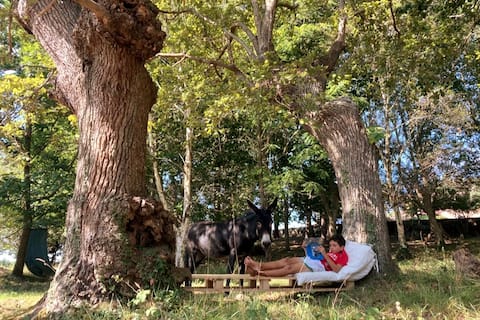
Caserío entre obles centenarians
Entire Place • 3 bedrooms
Apartments in Urdaibai.
Entire Place • 6 bedrooms

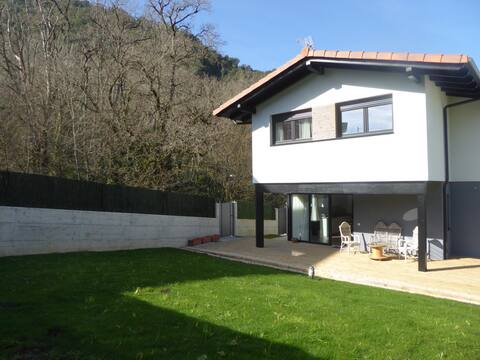
Fantástica vista a Urdaibai EBI566
Entire Place • 3 bedrooms

Sokaire en Urdaibai next to Mundaka
Entire Place • 2 bedrooms

Gorgeous Caserio with Pool
Entire Place • 6 bedrooms
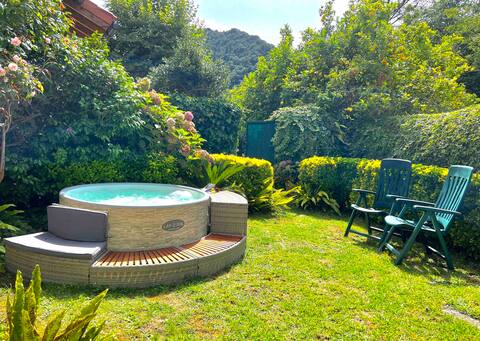
Agradable casa (jacuzzi exterior)en pleno Urdaibai
Entire Place • 5 bedrooms
Note: Performance varies based on location, size, amenities, seasonality, and management quality. Data reflects the past 12 months.
Top Performing Airbnb Hosts in Busturia (2025)
Learn from the best! This table showcases top-performing Airbnb hosts in Busturia based on the number of properties managed and estimated total revenue over the past year. Analyze their scale and performance metrics.
| Host Name | Properties | Grossing Revenue | Stay Reviews | Avg Rating |
|---|---|---|---|---|
| Aitor | 3 | $110,207 | 116 | 4.98/5.0 |
| Jose Juan | 1 | $63,805 | 13 | 4.85/5.0 |
| Miren | 1 | $51,001 | 122 | 4.90/5.0 |
| Marta | 1 | $45,796 | 19 | 4.95/5.0 |
| Pedro | 1 | $39,152 | 16 | 5.00/5.0 |
| Host #112518630 | 1 | $37,893 | 38 | 4.50/5.0 |
| Berezi | 1 | $21,430 | 29 | 4.93/5.0 |
| Guillermo | 1 | $16,355 | 66 | 4.95/5.0 |
| People Rentals | 1 | $16,250 | 17 | 4.06/5.0 |
| Jorge | 1 | $16,109 | 11 | 4.45/5.0 |
Analyzing the strategies of top hosts, such as their property selection, pricing, and guest communication, can offer valuable lessons for optimizing your own Airbnb operations in Busturia.
Dive Deeper: Advanced Busturia STR Market Data (2025)
Ready to unlock more insights? AirROI provides access to advanced metrics and comprehensive Airbnb data for Busturia. Explore detailed analytics beyond this report to refine your investment strategy, optimize pricing, and maximize your vacation rental profits.
Explore Advanced MetricsBusturia Short-Term Rental Market Composition (2025): Property & Room Types
Room Type Distribution
Property Type Distribution
Market Composition Insights for Busturia
- The Busturia Airbnb market composition is heavily skewed towards Entire Home/Apt listings, which make up 100% of the 20 active rentals. This indicates strong guest preference for privacy and space.
- Looking at the property type distribution in Busturia, Apartment/Condo properties are the most common (70%), reflecting the local real estate landscape.
- Houses represent a significant 30% portion, catering likely to families or larger groups.
Busturia Airbnb Room Capacity Analysis (2025): Bedroom Distribution
Distribution of Listings by Number of Bedrooms
Room Capacity Insights for Busturia
- The dominant room capacity in Busturia is 3 bedrooms listings, making up 45% of the market. This suggests a strong demand for properties suitable for families or small groups.
- Together, 3 bedrooms and 2 bedrooms properties represent 70.0% of the active Airbnb listings in Busturia, indicating a high concentration in these sizes.
- A significant 65.0% of listings offer 3+ bedrooms, catering to larger groups and families seeking more space in Busturia.
Busturia Vacation Rental Guest Capacity Trends (2025)
Distribution of Listings by Guest Capacity
Guest Capacity Insights for Busturia
- The most common guest capacity trend in Busturia vacation rentals is listings accommodating 8+ guests (30%). This suggests the primary traveler segment is likely larger groups.
- Properties designed for 8+ guests and 6 guests dominate the Busturia STR market, accounting for 55.0% of listings.
- 60.0% of properties accommodate 6+ guests, serving the market segment for larger families or group travel in Busturia.
- On average, properties in Busturia are equipped to host 6.0 guests.
Busturia Airbnb Booking Patterns (2025): Available vs. Booked Days
Available Days Distribution
Booked Days Distribution
Booking Pattern Insights for Busturia
- The most common availability pattern in Busturia falls within the 271-366 days range, representing 55% of listings. This suggests many properties have significant open periods on their calendars.
- Approximately 90.0% of listings show high availability (181+ days open annually), indicating potential for increased bookings or specific owner usage patterns.
- For booked days, the 31-90 days range is most frequent in Busturia (40%), reflecting common guest stay durations or potential owner blocking patterns.
- A notable 15.0% of properties secure long booking periods (181+ days booked per year), highlighting successful long-term rental strategies or significant owner usage.
Busturia Airbnb Minimum Stay Requirements Analysis
Distribution of Listings by Minimum Night Requirement
1 Night
2 listings
13.3% of total
2 Nights
10 listings
66.7% of total
3 Nights
2 listings
13.3% of total
4-6 Nights
1 listings
6.7% of total
Key Insights
- The most prevalent minimum stay requirement in Busturia is 2 Nights, adopted by 66.7% of listings. This highlights the market's preference for shorter, flexible bookings.
- A strong majority (80.0%) of the Busturia Airbnb data shows acceptance of very short stays (1-2 nights), indicating a dynamic, high-turnover market.
Recommendations
- Align with the market by considering a 2 Nights minimum stay, as 66.7% of Busturia hosts use this setting.
- If feasible, allowing 1-night stays, especially midweek or during low season, could capture last-minute bookings, as only 13.3% currently do.
- A 2-night minimum appears standard (66.7%). Consider this for weekends or peak periods.
- Adjust minimum nights based on seasonality – potentially shorter during low season and longer during peak demand periods in Busturia.
Busturia Airbnb Cancellation Policy Trends Analysis (2025)
Super Strict 30 Days
1 listings
6.7% of total
Moderate
3 listings
20% of total
Firm
4 listings
26.7% of total
Strict
7 listings
46.7% of total
Cancellation Policy Insights for Busturia
- The prevailing Airbnb cancellation policy trend in Busturia is Strict, used by 46.7% of listings.
- A majority (73.4%) of hosts in Busturia utilize Firm or Strict policies, indicating a market where hosts prioritize booking security.
Recommendations for Hosts
- Consider adopting a Strict policy to align with the 46.7% market standard in Busturia.
- With 46.7% using Strict terms, this is a viable option in Busturia, particularly for high-value properties or during peak demand periods.
- Regularly review your cancellation policy against competitors and market demand shifts in Busturia.
Busturia STR Booking Lead Time Analysis (2025)
Average Booking Lead Time by Month
Booking Lead Time Insights for Busturia
- The overall average booking lead time for vacation rentals in Busturia is 85 days.
- Guests book furthest in advance for stays during July (average 142 days), likely coinciding with peak travel demand or local events.
- The shortest booking windows occur for stays in February (average 39 days), indicating more last-minute travel plans during this time.
- Seasonally, Summer (124 days avg.) sees the longest lead times, while Spring (55 days avg.) has the shortest, reflecting typical travel planning cycles.
Recommendations for Hosts
- Use the overall average lead time (85 days) as a baseline for your pricing and availability strategy in Busturia.
- For July stays, consider implementing length-of-stay discounts or slightly higher rates for bookings made less than 142 days out to capitalize on advance planning.
- Target marketing efforts for the Summer season well in advance (at least 124 days) to capture early planners.
- Monitor your own booking lead times against these Busturia averages to identify opportunities for dynamic pricing adjustments.
Popular & Essential Airbnb Amenities in Busturia (2025)
Amenity Prevalence
Amenity Insights for Busturia
- Essential amenities in Busturia that guests expect include: TV, Hot water, Kitchen, Washer, Heating, Refrigerator, Wifi, Essentials, Oven, Microwave. Lacking these (any) could significantly impact bookings.
Recommendations for Hosts
- Ensure your listing includes all essential amenities for Busturia: TV, Hot water, Kitchen, Washer, Heating, Refrigerator, Wifi, Essentials, Oven, Microwave.
- Prioritize adding missing essentials: Washer, Heating, Refrigerator, Wifi, Essentials, Oven, Microwave.
- Highlight unique or less common amenities you offer (e.g., hot tub, dedicated workspace, EV charger) in your listing description and photos.
- Regularly check competitor amenities in Busturia to stay competitive.
Busturia Airbnb Guest Demographics & Profile Analysis (2025)
Guest Profile Summary for Busturia
- The typical guest profile for Airbnb in Busturia consists of a mix of domestic (37%) and international guests, with top international origins including France, typically belonging to the Post-2000s (Gen Z/Alpha) group (50%), primarily speaking English or French.
- Domestic travelers account for 36.7% of guests.
- Key international markets include Spain (36.7%) and France (31.6%).
- Top languages spoken are English (34.8%) followed by French (23.6%).
- A significant demographic segment is the Post-2000s (Gen Z/Alpha) group, representing 50% of guests.
Recommendations for Hosts
- Focus marketing internationally, particularly towards travelers from France.
- Tailor amenities and listing descriptions to appeal to the dominant Post-2000s (Gen Z/Alpha) demographic (e.g., highlight fast WiFi, smart home features, local guides).
- Highlight unique local experiences or amenities relevant to the primary guest profile.
- Consider seasonal promotions aligned with peak travel times for key origin markets.
Nearby Short-Term Rental Market Comparison
How does the Busturia Airbnb market stack up against its neighbors? Compare key performance metrics like average monthly revenue, ADR, and occupancy rates in surrounding areas to understand the broader regional STR landscape.
| Market | Active Properties | Monthly Revenue | Daily Rate | Avg. Occupancy |
|---|---|---|---|---|
| San Sebastián | 1,426 | $3,546 | $262.81 | 49% |
| Gautegiz Arteaga | 21 | $2,865 | $293.66 | 38% |
| Labastida/Bastida | 11 | $2,662 | $268.80 | 34% |
| Barrika | 13 | $2,629 | $314.61 | 41% |
| Esteribar | 20 | $2,574 | $276.81 | 32% |
| Hernani | 11 | $2,572 | $345.16 | 40% |
| Dima | 11 | $2,422 | $332.91 | 42% |
| Lège-Cap-Ferret | 1,210 | $2,420 | $337.40 | 41% |
| Larraun | 18 | $2,387 | $225.55 | 40% |
| Erandio | 16 | $2,361 | $164.90 | 56% |