Teruel Airbnb Market Analysis 2025: Short Term Rental Data & Vacation Rental Statistics in Aragon, Spain
Is Airbnb profitable in Teruel in 2025? Explore comprehensive Airbnb analytics for Teruel, Aragon, Spain to uncover income potential. This 2025 STR market report for Teruel, based on AirROI data from April 2024 to March 2025, reveals key trends in the niche market of 82 active listings.
Whether you're considering an Airbnb investment in Teruel, optimizing your existing vacation rental, or exploring rental arbitrage opportunities, understanding the Teruel Airbnb data is crucial. Navigating the high regulation landscape is key to maximizing your short term rental income potential. Let's dive into the specifics.
Key Teruel Airbnb Performance Metrics Overview
Monthly Airbnb Revenue Variations & Income Potential in Teruel (2025)
Understanding the monthly revenue variations for Airbnb listings in Teruel is key to maximizing your short term rental income potential. Seasonality significantly impacts earnings. Our analysis, based on data from the past 12 months, shows that the peak revenue month for STRs in Teruel is typically July, while February often presents the lowest earnings, highlighting opportunities for strategic pricing adjustments during shoulder and low seasons. Explore the typical Airbnb income in Teruel across different performance tiers:
- Best-in-class properties (Top 10%) achieve $3,574+ monthly, often utilizing dynamic pricing and superior guest experiences.
- Strong performing properties (Top 25%) earn $2,303 or more, indicating effective management and desirable locations/amenities.
- Typical properties (Median) generate around $1,327 per month, representing the average market performance.
- Entry-level properties (Bottom 25%) see earnings around $660, often with potential for optimization.
Average Monthly Airbnb Earnings Trend in Teruel
Teruel Airbnb Occupancy Rate Trends (2025)
Maximize your bookings by understanding the Teruel STR occupancy trends. Seasonal demand shifts significantly influence how often properties are booked. Typically, Maysees the highest demand (peak season occupancy), while March experiences the lowest (low season). Effective strategies, like adjusting minimum stays or offering promotions, can boost occupancy during slower periods. Here's how different property tiers perform in Teruel:
- Best-in-class properties (Top 10%) achieve 78%+ occupancy, indicating high desirability and potentially optimized availability.
- Strong performing properties (Top 25%) maintain 55% or higher occupancy, suggesting good market fit and guest satisfaction.
- Typical properties (Median) have an occupancy rate around 28%.
- Entry-level properties (Bottom 25%) average 14% occupancy, potentially facing higher vacancy.
Average Monthly Occupancy Rate Trend in Teruel
Average Daily Rate (ADR) Airbnb Trends in Teruel (2025)
Effective short term rental pricing strategy in Teruel involves understanding monthly ADR fluctuations. The Average Daily Rate (ADR) for Airbnb in Teruel typically peaks in December and dips lowest during May. Leveraging Airbnb dynamic pricing tools or strategies based on this seasonality can significantly boost revenue. Here's a look at the typical nightly rates achieved:
- Best-in-class properties (Top 10%) command rates of $304+ per night, often due to premium features or locations.
- Strong performing properties (Top 25%) achieve nightly rates of $193 or more.
- Typical properties (Median) charge around $144 per night.
- Entry-level properties (Bottom 25%) earn around $102 per night.
Average Daily Rate (ADR) Trend by Month in Teruel
Get Live Teruel Market Intelligence 👇

Explore Real-time Analytics
Airbnb Seasonality Analysis & Trends in Teruel (2025)
Peak Season (July, August, April)
- Revenue averages $2,161 per month
- Occupancy rates average 42.2%
- Daily rates average $171
Shoulder Season
- Revenue averages $1,783 per month
- Occupancy maintains around 35.8%
- Daily rates hold near $175
Low Season (January, February, March)
- Revenue drops to average $1,211 per month
- Occupancy decreases to average 29.7%
- Daily rates adjust to average $196
Seasonality Insights for Teruel
- The Airbnb seasonality in Teruel shows moderate seasonality with distinct peak and low periods. While the sections above show seasonal averages, it's also insightful to look at the extremes:
- During the high season, the absolute peak month showcases Teruel's highest earning potential, with monthly revenues capable of climbing to $2,244, occupancy reaching a high of 43.4%, and ADRs peaking at $203.
- Conversely, the slowest single month of the year, typically falling within the low season, marks the market's lowest point. In this month, revenue might dip to $1,121, occupancy could drop to 28.9%, and ADRs may adjust down to $156.
- Understanding both the seasonal averages and these monthly peaks and troughs in revenue, occupancy, and ADR is crucial for maximizing your Airbnb profit potential in Teruel.
Seasonal Strategies for Maximizing Profit
- Peak Season: Maximize revenue through premium pricing and potentially longer minimum stays. Ensure high availability.
- Low Season: Offer competitive pricing, special promotions (e.g., extended stay discounts), and flexible cancellation policies. Target off-season travelers like remote workers or budget-conscious guests.
- Shoulder Seasons: Implement dynamic pricing that balances peak and low rates. Target weekend travelers or specific events. Offer slightly more flexible terms than peak season.
- Regularly analyze your own performance against these Teruel seasonality benchmarks and adjust your pricing and availability strategy accordingly.
Best Areas for Airbnb Investment in Teruel (2025)
Exploring the top neighborhoods for short-term rentals in Teruel? This section highlights key areas, outlining why they are attractive for hosts and guests, along with notable local attractions. Consider these locations based on your target guest profile and investment strategy.
| Neighborhood / Area | Why Host Here? (Target Guests & Appeal) | Key Attractions & Landmarks |
|---|---|---|
| Teruel | The capital of the province known for its rich history and Mudejar architecture, a UNESCO World Heritage site. It attracts tourists interested in culture and history, making it a prime location for Airbnb hosting. | Mudejar Architecture of Teruel, Cathedral of Teruel, Dinopolis, Bridge of the Styles, Plaza del Torico, Museo Provincial de Teruel |
| Albarracín | A medieval town known for its picturesque streets and historic buildings. It is a popular tourist destination for those looking to experience medieval Spain and natural landscapes. | Catedral del Salvador, Alcazaba de Albarracín, Wall of Albarracín, Museo de Albarracín, Mirador de Albarracín, Parque Cultural de Albarracín |
| Morella | Known for its well-preserved medieval castle and historical center, Morella is a charming town that attracts visitors interested in history and nature. | Morella Castle, Iglesia de Santa María, Puerta de San Miguel, Museo Time, Mirador del Castillo, Monasterio de San Francisco |
| Rubielos de Mora | A beautiful historic town with stunning architecture and nature around. It attracts visitors looking for a quiet getaway and cultural experiences. | Iglesia de Rubielos, Castillo de Rubielos, Museo de la localidad, Plaza del pueblo, Senderismo en la Sierra de Gúdar |
| Caminreal | A small town located near larger cities, offering a peaceful rural getaway. Ideal for travelers looking to escape to nature while remaining accessible to city amenities. | Local parks, Cultural festivals, Nearby hiking trails, Historical buildings |
| Bronchales | A quaint mountain village known for its natural beauty and tranquil environment, it attracts those who want a quiet retreat in nature. | Sierra de Albarracín, Hiking trails, Natural parks, Historic architecture |
| Mora de Rubielos | Another historical town with medieval roots, surrounded by beautiful landscapes and ideal for cultural tourism. | Castillo de Mora de Rubielos, Iglesia de San Miguel, Museo de Mora de Rubielos, Festival de Teatro |
| Valderrobres | A picturesque town located in the Matarraña, known for its historic center and beautiful landscape, ideal for tourism focusing on culture and nature. | Castillo de Valderrobres, Iglesia de Santa María, Puente de Valderrobres, Fresnes de la Sierra, Parajes naturales en Matarraña |
Understanding Airbnb License Requirements & STR Laws in Teruel (2025)
Yes, Teruel, Aragon, Spain enforces high STR regulations. Obtaining a license and ensuring compliance is almost certainly required according to current 2025 STR laws. Always verify the latest short term rental regulations and Airbnb license requirements directly with local government authorities for Teruel to ensure full compliance before hosting.
(Source: AirROI data, 2025, based on 39% licensed listings)
Top Performing Airbnb Properties in Teruel (2025)
Benchmark your potential! Explore examples of top-performing Airbnb properties in Teruelbased on Trailing Twelve Month (TTM) revenue. Analyze their characteristics, revenue, occupancy rate, and ADR to understand what drives success in this market.

Centrico apartamento parking incl VUT18-035
Entire Place • 1 bedroom

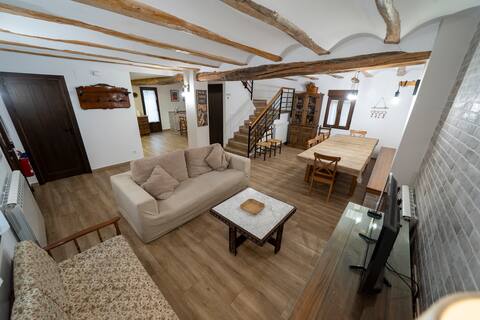
<3 Villa w Views/BBQ/Parking-Teruel in 2 minutes
Entire Place • 6 bedrooms
lodgingsteruelmarqueses/Marquesita
Entire Place • 1 bedroom
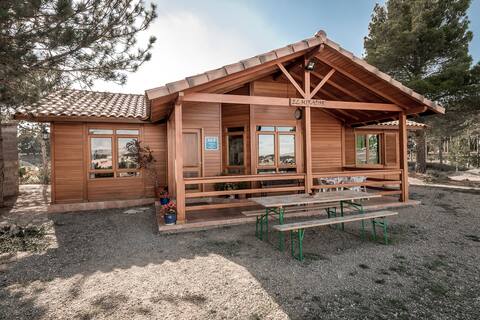
Casa El Mirador
Entire Place • 3 bedrooms
Meet Teruel and Dinópolis at Casa Clemen
Entire Place • 5 bedrooms

APARTMENT for tourist use. Ideal for families
Entire Place • 3 bedrooms
Note: Performance varies based on location, size, amenities, seasonality, and management quality. Data reflects the past 12 months.
Top Performing Airbnb Hosts in Teruel (2025)
Learn from the best! This table showcases top-performing Airbnb hosts in Teruel based on the number of properties managed and estimated total revenue over the past year. Analyze their scale and performance metrics.
| Host Name | Properties | Grossing Revenue | Stay Reviews | Avg Rating |
|---|---|---|---|---|
| Angel | 1 | $99,436 | 13 | 5.00/5.0 |
| Fernando | 4 | $92,653 | 173 | 4.80/5.0 |
| Eva | 3 | $59,975 | 27 | 4.49/5.0 |
| Javier Y Carmen | 3 | $57,216 | 72 | 4.94/5.0 |
| Victor Daniel | 3 | $55,851 | 94 | 4.59/5.0 |
| Reway | 2 | $50,214 | 28 | 2.35/5.0 |
| Teresa | 1 | $48,731 | 18 | 4.89/5.0 |
| Miguel Angel | 5 | $45,860 | 45 | 4.93/5.0 |
| Jesús | 3 | $45,183 | 47 | 4.97/5.0 |
| Mtb Teruel Turistico | 6 | $44,935 | 70 | 4.71/5.0 |
Analyzing the strategies of top hosts, such as their property selection, pricing, and guest communication, can offer valuable lessons for optimizing your own Airbnb operations in Teruel.
Dive Deeper: Advanced Teruel STR Market Data (2025)
Ready to unlock more insights? AirROI provides access to advanced metrics and comprehensive Airbnb data for Teruel. Explore detailed analytics beyond this report to refine your investment strategy, optimize pricing, and maximize your vacation rental profits.
Explore Advanced MetricsTeruel Short-Term Rental Market Composition (2025): Property & Room Types
Room Type Distribution
Property Type Distribution
Market Composition Insights for Teruel
- The Teruel Airbnb market composition is heavily skewed towards Entire Home/Apt listings, which make up 96.3% of the 82 active rentals. This indicates strong guest preference for privacy and space.
- Looking at the property type distribution in Teruel, Apartment/Condo properties are the most common (73.2%), reflecting the local real estate landscape.
- Houses represent a significant 23.2% portion, catering likely to families or larger groups.
- Smaller segments like unique stays, outdoor/unique (combined 3.6%) offer potential for unique stay experiences.
Teruel Airbnb Room Capacity Analysis (2025): Bedroom Distribution
Distribution of Listings by Number of Bedrooms
Room Capacity Insights for Teruel
- The dominant room capacity in Teruel is 2 bedrooms listings, making up 32.9% of the market. This suggests a strong demand for properties suitable for couples or solo travelers.
- Together, 2 bedrooms and 1 bedroom properties represent 60.9% of the active Airbnb listings in Teruel, indicating a high concentration in these sizes.
- A significant 36.6% of listings offer 3+ bedrooms, catering to larger groups and families seeking more space in Teruel.
Teruel Vacation Rental Guest Capacity Trends (2025)
Distribution of Listings by Guest Capacity
Guest Capacity Insights for Teruel
- The most common guest capacity trend in Teruel vacation rentals is listings accommodating 4 guests (36.6%). This suggests the primary traveler segment is likely small families or groups.
- Properties designed for 4 guests and 8+ guests dominate the Teruel STR market, accounting for 61.0% of listings.
- 42.7% of properties accommodate 6+ guests, serving the market segment for larger families or group travel in Teruel.
- On average, properties in Teruel are equipped to host 5.3 guests.
Teruel Airbnb Booking Patterns (2025): Available vs. Booked Days
Available Days Distribution
Booked Days Distribution
Booking Pattern Insights for Teruel
- The most common availability pattern in Teruel falls within the 271-366 days range, representing 50% of listings. This suggests many properties have significant open periods on their calendars.
- Approximately 87.8% of listings show high availability (181+ days open annually), indicating potential for increased bookings or specific owner usage patterns.
- For booked days, the 91-180 days range is most frequent in Teruel (39%), reflecting common guest stay durations or potential owner blocking patterns.
- A notable 12.2% of properties secure long booking periods (181+ days booked per year), highlighting successful long-term rental strategies or significant owner usage.
Teruel Airbnb Minimum Stay Requirements Analysis
Distribution of Listings by Minimum Night Requirement
1 Night
17 listings
21.8% of total
2 Nights
45 listings
57.7% of total
3 Nights
2 listings
2.6% of total
4-6 Nights
2 listings
2.6% of total
30+ Nights
12 listings
15.4% of total
Key Insights
- The most prevalent minimum stay requirement in Teruel is 2 Nights, adopted by 57.7% of listings. This highlights the market's preference for shorter, flexible bookings.
- A strong majority (79.5%) of the Teruel Airbnb data shows acceptance of very short stays (1-2 nights), indicating a dynamic, high-turnover market.
- A significant segment (15.4%) caters to monthly stays (30+ nights) in Teruel, pointing to opportunities in the extended-stay market.
Recommendations
- Align with the market by considering a 2 Nights minimum stay, as 57.7% of Teruel hosts use this setting.
- If feasible, allowing 1-night stays, especially midweek or during low season, could capture last-minute bookings, as only 21.8% currently do.
- Explore offering discounts for stays of 30+ nights to attract the 15.4% of the market seeking extended stays.
- Adjust minimum nights based on seasonality – potentially shorter during low season and longer during peak demand periods in Teruel.
Teruel Airbnb Cancellation Policy Trends Analysis (2025)
Flexible
22 listings
30.1% of total
Moderate
24 listings
32.9% of total
Firm
8 listings
11% of total
Strict
19 listings
26% of total
Cancellation Policy Insights for Teruel
- The prevailing Airbnb cancellation policy trend in Teruel is Moderate, used by 32.9% of listings.
- There's a relatively balanced mix between guest-friendly (63.0%) and stricter (37.0%) policies, offering choices for different guest needs.
Recommendations for Hosts
- Consider adopting a Moderate policy to align with the 32.9% market standard in Teruel.
- Regularly review your cancellation policy against competitors and market demand shifts in Teruel.
Teruel STR Booking Lead Time Analysis (2025)
Average Booking Lead Time by Month
Booking Lead Time Insights for Teruel
- The overall average booking lead time for vacation rentals in Teruel is 53 days.
- Guests book furthest in advance for stays during July (average 87 days), likely coinciding with peak travel demand or local events.
- The shortest booking windows occur for stays in March (average 33 days), indicating more last-minute travel plans during this time.
- Seasonally, Summer (64 days avg.) sees the longest lead times, while Spring (46 days avg.) has the shortest, reflecting typical travel planning cycles.
Recommendations for Hosts
- Use the overall average lead time (53 days) as a baseline for your pricing and availability strategy in Teruel.
- For July stays, consider implementing length-of-stay discounts or slightly higher rates for bookings made less than 87 days out to capitalize on advance planning.
- Target marketing efforts for the Summer season well in advance (at least 64 days) to capture early planners.
- Monitor your own booking lead times against these Teruel averages to identify opportunities for dynamic pricing adjustments.
Popular & Essential Airbnb Amenities in Teruel (2025)
Amenity Prevalence
Amenity Insights for Teruel
- Popular amenities like Kitchen, TV, Heating are common but not universal. Offering these can provide a competitive edge.
- Warning: Wifi is not universally provided but is considered essential globally. Ensure reliable Wifi is offered.
Recommendations for Hosts
- Consider adding popular differentiators like Kitchen or TV to increase appeal.
- Highlight unique or less common amenities you offer (e.g., hot tub, dedicated workspace, EV charger) in your listing description and photos.
- Regularly check competitor amenities in Teruel to stay competitive.
Teruel Airbnb Guest Demographics & Profile Analysis (2025)
Guest Profile Summary for Teruel
- The typical guest profile for Airbnb in Teruel consists of primarily domestic travelers (74%), often arriving from nearby Madrid, typically belonging to the Post-2000s (Gen Z/Alpha) group (50%), primarily speaking Spanish or English.
- Domestic travelers account for 74.2% of guests.
- Key international markets include Spain (74.2%) and France (8.5%).
- Top languages spoken are Spanish (40.8%) followed by English (31.6%).
- A significant demographic segment is the Post-2000s (Gen Z/Alpha) group, representing 50% of guests.
Recommendations for Hosts
- Target domestic marketing efforts towards travelers from Madrid and Valencia.
- Tailor amenities and listing descriptions to appeal to the dominant Post-2000s (Gen Z/Alpha) demographic (e.g., highlight fast WiFi, smart home features, local guides).
- Highlight unique local experiences or amenities relevant to the primary guest profile.
- Consider seasonal promotions aligned with peak travel times for key origin markets.
Nearby Short-Term Rental Market Comparison
How does the Teruel Airbnb market stack up against its neighbors? Compare key performance metrics like average monthly revenue, ADR, and occupancy rates in surrounding areas to understand the broader regional STR landscape.
| Market | Active Properties | Monthly Revenue | Daily Rate | Avg. Occupancy |
|---|---|---|---|---|
| Macastre | 13 | $2,924 | $296.93 | 42% |
| Corbera | 13 | $2,721 | $206.87 | 41% |
| Bétera | 31 | $2,711 | $222.77 | 46% |
| l'Eliana | 33 | $2,510 | $298.45 | 43% |
| San Antonio de Benagéber | 11 | $2,374 | $335.55 | 40% |
| Manises | 25 | $2,352 | $175.71 | 38% |
| Olocau | 11 | $2,245 | $308.22 | 36% |
| Alboraia / Alboraya | 272 | $2,220 | $186.05 | 49% |
| la Pobla de Vallbona | 27 | $2,163 | $193.69 | 49% |
| Riba-roja de Túria | 21 | $2,132 | $221.03 | 41% |