Zahara Airbnb Market Analysis 2025: Short Term Rental Data & Vacation Rental Statistics in Andalusia, Spain
Is Airbnb profitable in Zahara in 2025? Explore comprehensive Airbnb analytics for Zahara, Andalusia, Spain to uncover income potential. This 2025 STR market report for Zahara, based on AirROI data from April 2024 to March 2025, reveals key trends in the niche market of 31 active listings.
Whether you're considering an Airbnb investment in Zahara, optimizing your existing vacation rental, or exploring rental arbitrage opportunities, understanding the Zahara Airbnb data is crucial. Navigating the high regulation landscape is key to maximizing your short term rental income potential. Let's dive into the specifics.
Key Zahara Airbnb Performance Metrics Overview
Monthly Airbnb Revenue Variations & Income Potential in Zahara (2025)
Understanding the monthly revenue variations for Airbnb listings in Zahara is key to maximizing your short term rental income potential. Seasonality significantly impacts earnings. Our analysis, based on data from the past 12 months, shows that the peak revenue month for STRs in Zahara is typically July, while February often presents the lowest earnings, highlighting opportunities for strategic pricing adjustments during shoulder and low seasons. Explore the typical Airbnb income in Zahara across different performance tiers:
- Best-in-class properties (Top 10%) achieve $2,612+ monthly, often utilizing dynamic pricing and superior guest experiences.
- Strong performing properties (Top 25%) earn $1,749 or more, indicating effective management and desirable locations/amenities.
- Typical properties (Median) generate around $842 per month, representing the average market performance.
- Entry-level properties (Bottom 25%) see earnings around $412, often with potential for optimization.
Average Monthly Airbnb Earnings Trend in Zahara
Zahara Airbnb Occupancy Rate Trends (2025)
Maximize your bookings by understanding the Zahara STR occupancy trends. Seasonal demand shifts significantly influence how often properties are booked. Typically, Julysees the highest demand (peak season occupancy), while January experiences the lowest (low season). Effective strategies, like adjusting minimum stays or offering promotions, can boost occupancy during slower periods. Here's how different property tiers perform in Zahara:
- Best-in-class properties (Top 10%) achieve 70%+ occupancy, indicating high desirability and potentially optimized availability.
- Strong performing properties (Top 25%) maintain 51% or higher occupancy, suggesting good market fit and guest satisfaction.
- Typical properties (Median) have an occupancy rate around 26%.
- Entry-level properties (Bottom 25%) average 13% occupancy, potentially facing higher vacancy.
Average Monthly Occupancy Rate Trend in Zahara
Average Daily Rate (ADR) Airbnb Trends in Zahara (2025)
Effective short term rental pricing strategy in Zahara involves understanding monthly ADR fluctuations. The Average Daily Rate (ADR) for Airbnb in Zahara typically peaks in November and dips lowest during April. Leveraging Airbnb dynamic pricing tools or strategies based on this seasonality can significantly boost revenue. Here's a look at the typical nightly rates achieved:
- Best-in-class properties (Top 10%) command rates of $215+ per night, often due to premium features or locations.
- Strong performing properties (Top 25%) achieve nightly rates of $140 or more.
- Typical properties (Median) charge around $87 per night.
- Entry-level properties (Bottom 25%) earn around $64 per night.
Average Daily Rate (ADR) Trend by Month in Zahara
Get Live Zahara Market Intelligence 👇

Explore Real-time Analytics
Airbnb Seasonality Analysis & Trends in Zahara (2025)
Peak Season (July, May, August)
- Revenue averages $1,669 per month
- Occupancy rates average 42.1%
- Daily rates average $105
Shoulder Season
- Revenue averages $1,227 per month
- Occupancy maintains around 32.8%
- Daily rates hold near $107
Low Season (January, February, November)
- Revenue drops to average $749 per month
- Occupancy decreases to average 26.1%
- Daily rates adjust to average $114
Seasonality Insights for Zahara
- The Airbnb seasonality in Zahara shows highly seasonal trends requiring careful strategy. While the sections above show seasonal averages, it's also insightful to look at the extremes:
- During the high season, the absolute peak month showcases Zahara's highest earning potential, with monthly revenues capable of climbing to $1,715, occupancy reaching a high of 42.6%, and ADRs peaking at $121.
- Conversely, the slowest single month of the year, typically falling within the low season, marks the market's lowest point. In this month, revenue might dip to $665, occupancy could drop to 24.7%, and ADRs may adjust down to $100.
- Understanding both the seasonal averages and these monthly peaks and troughs in revenue, occupancy, and ADR is crucial for maximizing your Airbnb profit potential in Zahara.
Seasonal Strategies for Maximizing Profit
- Peak Season: Maximize revenue through premium pricing and potentially longer minimum stays. Ensure high availability.
- Low Season: Offer competitive pricing, special promotions (e.g., extended stay discounts), and flexible cancellation policies. Target off-season travelers like remote workers or budget-conscious guests.
- Shoulder Seasons: Implement dynamic pricing that balances peak and low rates. Target weekend travelers or specific events. Offer slightly more flexible terms than peak season.
- Regularly analyze your own performance against these Zahara seasonality benchmarks and adjust your pricing and availability strategy accordingly.
Best Areas for Airbnb Investment in Zahara (2025)
Exploring the top neighborhoods for short-term rentals in Zahara? This section highlights key areas, outlining why they are attractive for hosts and guests, along with notable local attractions. Consider these locations based on your target guest profile and investment strategy.
| Neighborhood / Area | Why Host Here? (Target Guests & Appeal) | Key Attractions & Landmarks |
|---|---|---|
| Zahara de los Atunes Beach | A beautiful beach renowned for its stunning sunsets and clear waters, ideal for tourists looking for a relaxing coastal escape. The area is popular among beach lovers and offers various water activities. | Zahara de los Atunes Beach, La Playa del Cañuelo, Los Caños de Meca, Zahara Castle, Tuna fishery tours |
| Historic Zahara Village | Charming village known for its whitewashed buildings and traditional Andalusian architecture. Perfect for tourists seeking authentic cultural experiences and picturesque landscapes. | Zahara de la Sierra castle, San Juan Bautista Church, Mirador de Zahara, Local tapas bars, Scenic viewpoints |
| Natural Park of La Breña | A protected natural area offering breathtaking cliffs and rich biodiversity. Inviting for eco-tourists and nature lovers looking for hiking and exploration. | Hiking trails, Birdwatching, Cliff views, Beach access, Nature tours |
| Hiking Trails | Various hiking paths around Zahara offer stunning views of the Sierra de Grazalema and the coastline. Attracts active travelers looking to explore the natural beauty of the region. | Caminito del Rey, Los Alcornocales Natural Park, Sierra de Grazalema, Coastal hiking trails, Guided nature hikes |
| Local Markets | Vibrant markets featuring fresh produce, local crafts, and Andalusian gastronomy. Thrives on attracting visitors interested in local culture and culinary experiences. | Weekly local food market, Crafts from local artisans, Tasting local wines, Fresh seafood stalls, Culinary workshops |
| Aquatic Activities | Zahara offers a variety of water sports and activities that are great for families and thrill-seekers alike. Ideal for tourists who love adventure and fun in the sun. | Kayaking, Snorkeling, Diving schools, Boat tours, Fishing trips |
| Summer Festivals | Zahara hosts various summer festivals showcasing local traditions, music, and cuisine. Engages tourists looking for lively experiences and cultural immersion. | Festival de la Tuna, Flamenco shows, Gastronomy fairs, Cultural parades, Local art exhibitions |
| Nearby Towns Exploration | The vicinity of Zahara allows for easy day trips to other picturesque Andalusian towns like Vejer de la Frontera and Tarifa, appealing to tourists looking for exploration adventures. | Vejer de la Frontera, Tarifa Beach, Baelo Claudia ruins, Local historical sites, Culinary tours |
Understanding Airbnb License Requirements & STR Laws in Zahara (2025)
Yes, Zahara, Andalusia, Spain enforces high STR regulations. Obtaining a license and ensuring compliance is almost certainly required according to current 2025 STR laws. Always verify the latest short term rental regulations and Airbnb license requirements directly with local government authorities for Zahara to ensure full compliance before hosting.
(Source: AirROI data, 2025, based on 81% licensed listings)
Top Performing Airbnb Properties in Zahara (2025)
Benchmark your potential! Explore examples of top-performing Airbnb properties in Zaharabased on Trailing Twelve Month (TTM) revenue. Analyze their characteristics, revenue, occupancy rate, and ADR to understand what drives success in this market.
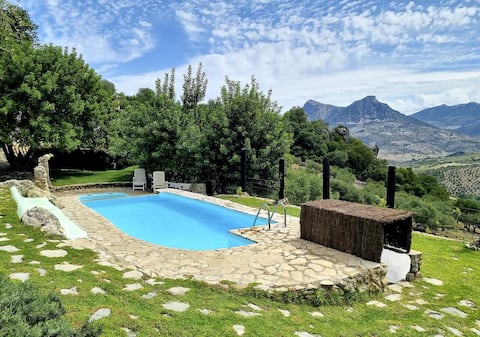
Villa in Natural Park, Unique Location with Pool
Entire Place • 3 bedrooms
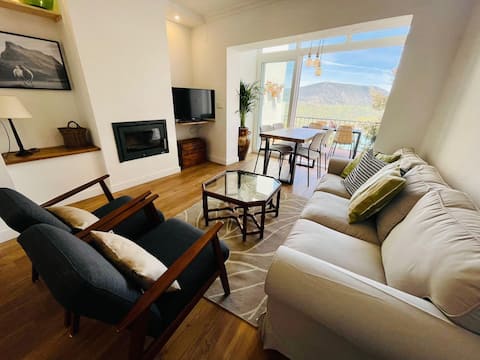
Casa "La Buganvilla"
Entire Place • 3 bedrooms
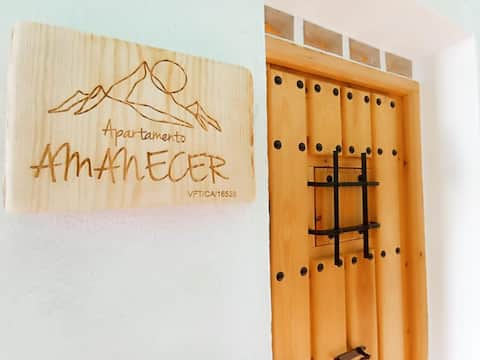
Apartamento Amanecer
Entire Place • 2 bedrooms
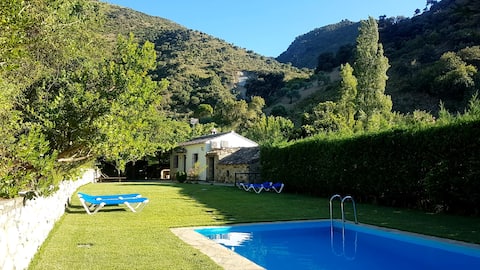
Great casa de campo in spectacular surroundings
Entire Place • 2 bedrooms
Rural accommodation 'El Reposo' by Turismodecality
Entire Place • 2 bedrooms

Cheerful country home with pool
Entire Place • 5 bedrooms
Note: Performance varies based on location, size, amenities, seasonality, and management quality. Data reflects the past 12 months.
Top Performing Airbnb Hosts in Zahara (2025)
Learn from the best! This table showcases top-performing Airbnb hosts in Zahara based on the number of properties managed and estimated total revenue over the past year. Analyze their scale and performance metrics.
| Host Name | Properties | Grossing Revenue | Stay Reviews | Avg Rating |
|---|---|---|---|---|
| David | 1 | $41,600 | 127 | 4.87/5.0 |
| Blas | 1 | $32,382 | 53 | 4.94/5.0 |
| Ciara | 1 | $26,337 | 9 | 5.00/5.0 |
| Elbert | 1 | $22,238 | 299 | 4.80/5.0 |
| Vivelorural | 2 | $21,102 | 35 | 4.61/5.0 |
| Miguel | 1 | $20,065 | 9 | 4.67/5.0 |
| Alojamientos | 5 | $18,366 | 15 | 2.95/5.0 |
| María Dolores | 1 | $18,322 | 4 | 4.25/5.0 |
| Jesus | 1 | $15,858 | 31 | 4.97/5.0 |
| Juan Antonio | 1 | $13,446 | 39 | 4.49/5.0 |
Analyzing the strategies of top hosts, such as their property selection, pricing, and guest communication, can offer valuable lessons for optimizing your own Airbnb operations in Zahara.
Dive Deeper: Advanced Zahara STR Market Data (2025)
Ready to unlock more insights? AirROI provides access to advanced metrics and comprehensive Airbnb data for Zahara. Explore detailed analytics beyond this report to refine your investment strategy, optimize pricing, and maximize your vacation rental profits.
Explore Advanced MetricsZahara Short-Term Rental Market Composition (2025): Property & Room Types
Room Type Distribution
Property Type Distribution
Market Composition Insights for Zahara
- The Zahara Airbnb market composition is heavily skewed towards Entire Home/Apt listings, which make up 83.9% of the 31 active rentals. This indicates strong guest preference for privacy and space.
- Looking at the property type distribution in Zahara, House properties are the most common (77.4%), reflecting the local real estate landscape.
- Houses represent a significant 77.4% portion, catering likely to families or larger groups.
- Smaller segments like hotel/boutique (combined 3.2%) offer potential for unique stay experiences.
Zahara Airbnb Room Capacity Analysis (2025): Bedroom Distribution
Distribution of Listings by Number of Bedrooms
Room Capacity Insights for Zahara
- The dominant room capacity in Zahara is 3 bedrooms listings, making up 32.3% of the market. This suggests a strong demand for properties suitable for families or small groups.
- Together, 3 bedrooms and 2 bedrooms properties represent 58.1% of the active Airbnb listings in Zahara, indicating a high concentration in these sizes.
- A significant 42.0% of listings offer 3+ bedrooms, catering to larger groups and families seeking more space in Zahara.
Zahara Vacation Rental Guest Capacity Trends (2025)
Distribution of Listings by Guest Capacity
Guest Capacity Insights for Zahara
- The most common guest capacity trend in Zahara vacation rentals is listings accommodating 6 guests (25.8%). This suggests the primary traveler segment is likely larger groups.
- Properties designed for 6 guests and 4 guests dominate the Zahara STR market, accounting for 41.9% of listings.
- 41.9% of properties accommodate 6+ guests, serving the market segment for larger families or group travel in Zahara.
- On average, properties in Zahara are equipped to host 4.5 guests.
Zahara Airbnb Booking Patterns (2025): Available vs. Booked Days
Available Days Distribution
Booked Days Distribution
Booking Pattern Insights for Zahara
- The most common availability pattern in Zahara falls within the 271-366 days range, representing 61.3% of listings. This suggests many properties have significant open periods on their calendars.
- Approximately 80.7% of listings show high availability (181+ days open annually), indicating potential for increased bookings or specific owner usage patterns.
- For booked days, the 31-90 days range is most frequent in Zahara (38.7%), reflecting common guest stay durations or potential owner blocking patterns.
- A notable 19.4% of properties secure long booking periods (181+ days booked per year), highlighting successful long-term rental strategies or significant owner usage.
Zahara Airbnb Minimum Stay Requirements Analysis
Distribution of Listings by Minimum Night Requirement
1 Night
7 listings
22.6% of total
2 Nights
22 listings
71% of total
30+ Nights
2 listings
6.5% of total
Key Insights
- The most prevalent minimum stay requirement in Zahara is 2 Nights, adopted by 71% of listings. This highlights the market's preference for shorter, flexible bookings.
- A strong majority (93.6%) of the Zahara Airbnb data shows acceptance of very short stays (1-2 nights), indicating a dynamic, high-turnover market.
Recommendations
- Align with the market by considering a 2 Nights minimum stay, as 71% of Zahara hosts use this setting.
- If feasible, allowing 1-night stays, especially midweek or during low season, could capture last-minute bookings, as only 22.6% currently do.
- Explore offering discounts for stays of 30+ nights to attract the 6.5% of the market seeking extended stays.
- Adjust minimum nights based on seasonality – potentially shorter during low season and longer during peak demand periods in Zahara.
Zahara Airbnb Cancellation Policy Trends Analysis (2025)
Super Strict 60 Days
2 listings
7.1% of total
Flexible
4 listings
14.3% of total
Moderate
13 listings
46.4% of total
Firm
2 listings
7.1% of total
Strict
7 listings
25% of total
Cancellation Policy Insights for Zahara
- The prevailing Airbnb cancellation policy trend in Zahara is Moderate, used by 46.4% of listings.
- There's a relatively balanced mix between guest-friendly (60.7%) and stricter (32.1%) policies, offering choices for different guest needs.
Recommendations for Hosts
- Consider adopting a Moderate policy to align with the 46.4% market standard in Zahara.
- Regularly review your cancellation policy against competitors and market demand shifts in Zahara.
Zahara STR Booking Lead Time Analysis (2025)
Average Booking Lead Time by Month
Booking Lead Time Insights for Zahara
- The overall average booking lead time for vacation rentals in Zahara is 50 days.
- Guests book furthest in advance for stays during October (average 81 days), likely coinciding with peak travel demand or local events.
- The shortest booking windows occur for stays in February (average 24 days), indicating more last-minute travel plans during this time.
- Seasonally, Summer (70 days avg.) sees the longest lead times, while Winter (38 days avg.) has the shortest, reflecting typical travel planning cycles.
Recommendations for Hosts
- Use the overall average lead time (50 days) as a baseline for your pricing and availability strategy in Zahara.
- For October stays, consider implementing length-of-stay discounts or slightly higher rates for bookings made less than 81 days out to capitalize on advance planning.
- Target marketing efforts for the Summer season well in advance (at least 70 days) to capture early planners.
- Monitor your own booking lead times against these Zahara averages to identify opportunities for dynamic pricing adjustments.
Popular & Essential Airbnb Amenities in Zahara (2025)
Amenity Prevalence
Amenity Insights for Zahara
- Essential amenities in Zahara that guests expect include: TV, Kitchen. Lacking these (any) could significantly impact bookings.
- Popular amenities like Hangers, Dishes and silverware, Essentials are common but not universal. Offering these can provide a competitive edge.
- Warning: Wifi is not universally provided but is considered essential globally. Ensure reliable Wifi is offered.
Recommendations for Hosts
- Ensure your listing includes all essential amenities for Zahara: TV, Kitchen.
- Prioritize adding missing essentials: TV, Kitchen.
- Consider adding popular differentiators like Hangers or Dishes and silverware to increase appeal.
- Highlight unique or less common amenities you offer (e.g., hot tub, dedicated workspace, EV charger) in your listing description and photos.
- Regularly check competitor amenities in Zahara to stay competitive.
Zahara Airbnb Guest Demographics & Profile Analysis (2025)
Guest Profile Summary for Zahara
- The typical guest profile for Airbnb in Zahara consists of predominantly international visitors (66%), with top international origins including France, typically belonging to the Post-2000s (Gen Z/Alpha) group (50%), primarily speaking English or Spanish.
- Domestic travelers account for 34.0% of guests.
- Key international markets include Spain (34%) and France (13.7%).
- Top languages spoken are English (37.4%) followed by Spanish (25.2%).
- A significant demographic segment is the Post-2000s (Gen Z/Alpha) group, representing 50% of guests.
Recommendations for Hosts
- Focus marketing internationally, particularly towards travelers from France.
- Tailor amenities and listing descriptions to appeal to the dominant Post-2000s (Gen Z/Alpha) demographic (e.g., highlight fast WiFi, smart home features, local guides).
- Highlight unique local experiences or amenities relevant to the primary guest profile.
- Consider seasonal promotions aligned with peak travel times for key origin markets.
Nearby Short-Term Rental Market Comparison
How does the Zahara Airbnb market stack up against its neighbors? Compare key performance metrics like average monthly revenue, ADR, and occupancy rates in surrounding areas to understand the broader regional STR landscape.
| Market | Active Properties | Monthly Revenue | Daily Rate | Avg. Occupancy |
|---|---|---|---|---|
| Alhaurín de la Torre | 203 | $3,368 | $287.14 | 47% |
| Gelves | 22 | $3,120 | $185.84 | 53% |
| Benahavís | 492 | $3,047 | $494.00 | 40% |
| Alhaurín el Grande | 281 | $3,026 | $290.27 | 45% |
| Cártama | 56 | $2,829 | $300.39 | 43% |
| Marbella | 4,981 | $2,613 | $321.31 | 43% |
| El Castillo de las Guardas | 13 | $2,500 | $247.20 | 38% |
| Guillena | 34 | $2,397 | $273.55 | 36% |
| Valencina de la Concepción | 33 | $2,230 | $200.81 | 49% |
| Málaga | 7,038 | $2,217 | $162.86 | 54% |