Villanueva de la Concepción Airbnb Market Analysis 2025: Short Term Rental Data & Vacation Rental Statistics in Andalusia, Spain
Is Airbnb profitable in Villanueva de la Concepción in 2025? Explore comprehensive Airbnb analytics for Villanueva de la Concepción, Andalusia, Spain to uncover income potential. This 2025 STR market report for Villanueva de la Concepción, based on AirROI data from April 2024 to March 2025, reveals key trends in the niche market of 30 active listings.
Whether you're considering an Airbnb investment in Villanueva de la Concepción, optimizing your existing vacation rental, or exploring rental arbitrage opportunities, understanding the Villanueva de la Concepción Airbnb data is crucial. Navigating the high regulation landscape is key to maximizing your short term rental income potential. Let's dive into the specifics.
Key Villanueva de la Concepción Airbnb Performance Metrics Overview
Monthly Airbnb Revenue Variations & Income Potential in Villanueva de la Concepción (2025)
Understanding the monthly revenue variations for Airbnb listings in Villanueva de la Concepción is key to maximizing your short term rental income potential. Seasonality significantly impacts earnings. Our analysis, based on data from the past 12 months, shows that the peak revenue month for STRs in Villanueva de la Concepción is typically August, while February often presents the lowest earnings, highlighting opportunities for strategic pricing adjustments during shoulder and low seasons. Explore the typical Airbnb income in Villanueva de la Concepción across different performance tiers:
- Best-in-class properties (Top 10%) achieve $3,898+ monthly, often utilizing dynamic pricing and superior guest experiences.
- Strong performing properties (Top 25%) earn $2,498 or more, indicating effective management and desirable locations/amenities.
- Typical properties (Median) generate around $1,218 per month, representing the average market performance.
- Entry-level properties (Bottom 25%) see earnings around $598, often with potential for optimization.
Average Monthly Airbnb Earnings Trend in Villanueva de la Concepción
Villanueva de la Concepción Airbnb Occupancy Rate Trends (2025)
Maximize your bookings by understanding the Villanueva de la Concepción STR occupancy trends. Seasonal demand shifts significantly influence how often properties are booked. Typically, Augustsees the highest demand (peak season occupancy), while February experiences the lowest (low season). Effective strategies, like adjusting minimum stays or offering promotions, can boost occupancy during slower periods. Here's how different property tiers perform in Villanueva de la Concepción:
- Best-in-class properties (Top 10%) achieve 73%+ occupancy, indicating high desirability and potentially optimized availability.
- Strong performing properties (Top 25%) maintain 54% or higher occupancy, suggesting good market fit and guest satisfaction.
- Typical properties (Median) have an occupancy rate around 37%.
- Entry-level properties (Bottom 25%) average 18% occupancy, potentially facing higher vacancy.
Average Monthly Occupancy Rate Trend in Villanueva de la Concepción
Average Daily Rate (ADR) Airbnb Trends in Villanueva de la Concepción (2025)
Effective short term rental pricing strategy in Villanueva de la Concepción involves understanding monthly ADR fluctuations. The Average Daily Rate (ADR) for Airbnb in Villanueva de la Concepción typically peaks in August and dips lowest during March. Leveraging Airbnb dynamic pricing tools or strategies based on this seasonality can significantly boost revenue. Here's a look at the typical nightly rates achieved:
- Best-in-class properties (Top 10%) command rates of $206+ per night, often due to premium features or locations.
- Strong performing properties (Top 25%) achieve nightly rates of $161 or more.
- Typical properties (Median) charge around $121 per night.
- Entry-level properties (Bottom 25%) earn around $77 per night.
Average Daily Rate (ADR) Trend by Month in Villanueva de la Concepción
Get Live Villanueva de la Concepción Market Intelligence 👇

Explore Real-time Analytics
Airbnb Seasonality Analysis & Trends in Villanueva de la Concepción (2025)
Peak Season (August, July, September)
- Revenue averages $2,614 per month
- Occupancy rates average 56.3%
- Daily rates average $146
Shoulder Season
- Revenue averages $1,572 per month
- Occupancy maintains around 36.0%
- Daily rates hold near $134
Low Season (February, March, November)
- Revenue drops to average $944 per month
- Occupancy decreases to average 26.2%
- Daily rates adjust to average $120
Seasonality Insights for Villanueva de la Concepción
- The Airbnb seasonality in Villanueva de la Concepción shows highly seasonal trends requiring careful strategy. While the sections above show seasonal averages, it's also insightful to look at the extremes:
- During the high season, the absolute peak month showcases Villanueva de la Concepción's highest earning potential, with monthly revenues capable of climbing to $3,143, occupancy reaching a high of 64.7%, and ADRs peaking at $149.
- Conversely, the slowest single month of the year, typically falling within the low season, marks the market's lowest point. In this month, revenue might dip to $781, occupancy could drop to 22.0%, and ADRs may adjust down to $118.
- Understanding both the seasonal averages and these monthly peaks and troughs in revenue, occupancy, and ADR is crucial for maximizing your Airbnb profit potential in Villanueva de la Concepción.
Seasonal Strategies for Maximizing Profit
- Peak Season: Maximize revenue through premium pricing and potentially longer minimum stays. Ensure high availability.
- Low Season: Offer competitive pricing, special promotions (e.g., extended stay discounts), and flexible cancellation policies. Target off-season travelers like remote workers or budget-conscious guests.
- Shoulder Seasons: Implement dynamic pricing that balances peak and low rates. Target weekend travelers or specific events. Offer slightly more flexible terms than peak season.
- Regularly analyze your own performance against these Villanueva de la Concepción seasonality benchmarks and adjust your pricing and availability strategy accordingly.
Best Areas for Airbnb Investment in Villanueva de la Concepción (2025)
Exploring the top neighborhoods for short-term rentals in Villanueva de la Concepción? This section highlights key areas, outlining why they are attractive for hosts and guests, along with notable local attractions. Consider these locations based on your target guest profile and investment strategy.
| Neighborhood / Area | Why Host Here? (Target Guests & Appeal) | Key Attractions & Landmarks |
|---|---|---|
| El Torcal | A UNESCO World Heritage site with stunning limestone formations. It attracts nature lovers and hikers, offering unique landscapes and wildlife observation opportunities. | Torcal de Antequera, Natural Park, Hiking Trails, Visitor Center, Wildlife Viewing |
| Antequera | A historical city with impressive cultural heritage. Popular for its many monuments and museums, it's a hub for tourists exploring Andalusia. | El Alcazaba, Colegiata de Santa María, Dolmens of Antequera, Antequera's Historic Center, Church of San Juan de Dios |
| Villanueva de la Concepción Town Center | A charming small town with local flair and access to surrounding natural attractions. Offers a more authentic Andalusian experience for visitors. | Town Square, Local Markets, Cafés and Tapas Bars, Church of Our Lady of Sorrows, Nearby countryside |
| Natural Park of Sierra de los Antequera | A beautiful park ideal for outdoor activities such as hiking, rock climbing, and birdwatching. Popular among adventure tourists and nature enthusiasts. | Sierra Hiker Trails, Observation Points, Scenic Views, Flora and Fauna Exploration |
| Caminito del Rey | A famous walkway pinned along the steep walls of a narrow gorge. It appeals to adventurous tourists seeking breathtaking views and thrilling walks. | Caminito del Rey path, Gorge Views, Outdoor Activities, Nature Photography |
| Torcal Alto | Known for its unique karst landscape and geological formations. A great spot for educational tourism and geological studies. | Karst Formations, Hiking Trails, Wildlife Sanctuary, Scenic Views |
| El Chorro | A popular destination for climbing and hiking, known for its dramatic cliffs and beautiful landscapes. Attracts thrill-seekers and outdoor lovers. | Climbing Routes, Natural Pools, Hiking Trails, Visitor Center |
| Lago de las Ranas | A tranquil lake surrounded by natural beauty, perfect for relaxation and enjoying nature. It is a lesser-known gem for visitors wishing to escape the tourist spots. | Bird Watching, Picnic Areas, Fishing, Scenic Walkways |
Understanding Airbnb License Requirements & STR Laws in Villanueva de la Concepción (2025)
Yes, Villanueva de la Concepción, Andalusia, Spain enforces high STR regulations. Obtaining a license and ensuring compliance is almost certainly required according to current 2025 STR laws. Always verify the latest short term rental regulations and Airbnb license requirements directly with local government authorities for Villanueva de la Concepción to ensure full compliance before hosting.
(Source: AirROI data, 2025, based on 83% licensed listings)
Top Performing Airbnb Properties in Villanueva de la Concepción (2025)
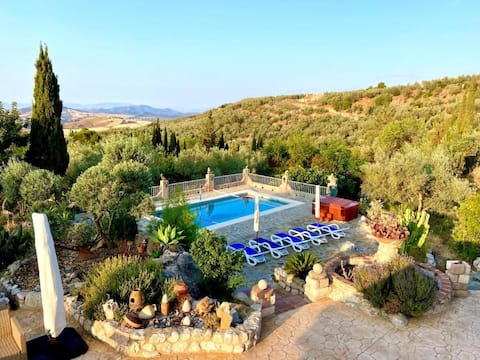
Benchmark your potential! Explore examples of top-performing Airbnb properties in Villanueva de la Concepciónbased on Trailing Twelve Month (TTM) revenue. Analyze their characteristics, revenue, occupancy rate, and ADR to understand what drives success in this market.

Finca Chimeneas Los Callejones
Entire Place • 2 bedrooms
Casa à Pépère By Solymar Holiday
Entire Place • 4 bedrooms

Casa Rubito el Olmo
Entire Place • 3 bedrooms

Finca las Campanas Los Callejones
Entire Place • 2 bedrooms

Cortijo El Alcornocal
Entire Place • 5 bedrooms
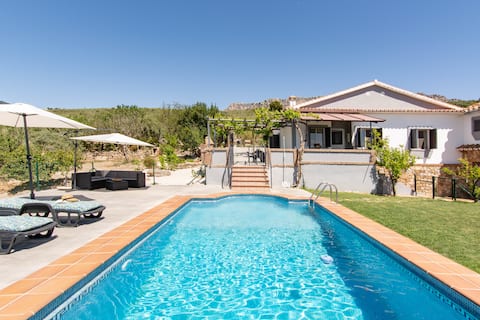
Villa Rural Malaga
Entire Place • 4 bedrooms
Note: Performance varies based on location, size, amenities, seasonality, and management quality. Data reflects the past 12 months.
Top Performing Airbnb Hosts in Villanueva de la Concepción (2025)
Learn from the best! This table showcases top-performing Airbnb hosts in Villanueva de la Concepción based on the number of properties managed and estimated total revenue over the past year. Analyze their scale and performance metrics.
| Host Name | Properties | Grossing Revenue | Stay Reviews | Avg Rating |
|---|---|---|---|---|
| Mike | 3 | $92,576 | 463 | 4.97/5.0 |
| Villa Torcal | 6 | $50,668 | 135 | 4.55/5.0 |
| Solymar Holiday | 1 | $42,706 | 7 | 4.71/5.0 |
| Alfonso | 1 | $41,686 | 10 | 5.00/5.0 |
| Lourdes | 1 | $35,125 | 7 | 5.00/5.0 |
| Jairo | 1 | $34,074 | 22 | 4.86/5.0 |
| Beatrijs | 1 | $33,232 | 88 | 4.93/5.0 |
| Ruralidays | 2 | $22,109 | 11 | 2.50/5.0 |
| Barry | 2 | $17,786 | 36 | 4.40/5.0 |
| Gema | 1 | $14,936 | 42 | 4.50/5.0 |
Analyzing the strategies of top hosts, such as their property selection, pricing, and guest communication, can offer valuable lessons for optimizing your own Airbnb operations in Villanueva de la Concepción.
Dive Deeper: Advanced Villanueva de la Concepción STR Market Data (2025)
Ready to unlock more insights? AirROI provides access to advanced metrics and comprehensive Airbnb data for Villanueva de la Concepción. Explore detailed analytics beyond this report to refine your investment strategy, optimize pricing, and maximize your vacation rental profits.
Explore Advanced MetricsVillanueva de la Concepción Short-Term Rental Market Composition (2025): Property & Room Types
Room Type Distribution
Property Type Distribution
Market Composition Insights for Villanueva de la Concepción
- The Villanueva de la Concepción Airbnb market composition is heavily skewed towards Entire Home/Apt listings, which make up 93.3% of the 30 active rentals. This indicates strong guest preference for privacy and space.
- Looking at the property type distribution in Villanueva de la Concepción, House properties are the most common (60%), reflecting the local real estate landscape.
- Houses represent a significant 60% portion, catering likely to families or larger groups.
- Smaller segments like hotel/boutique (combined 3.3%) offer potential for unique stay experiences.
Villanueva de la Concepción Airbnb Room Capacity Analysis (2025): Bedroom Distribution
Distribution of Listings by Number of Bedrooms
Room Capacity Insights for Villanueva de la Concepción
- The dominant room capacity in Villanueva de la Concepción is 2 bedrooms listings, making up 30% of the market. This suggests a strong demand for properties suitable for couples or solo travelers.
- Together, 2 bedrooms and 1 bedroom properties represent 56.7% of the active Airbnb listings in Villanueva de la Concepción, indicating a high concentration in these sizes.
- A significant 33.3% of listings offer 3+ bedrooms, catering to larger groups and families seeking more space in Villanueva de la Concepción.
Villanueva de la Concepción Vacation Rental Guest Capacity Trends (2025)
Distribution of Listings by Guest Capacity
Guest Capacity Insights for Villanueva de la Concepción
- The most common guest capacity trend in Villanueva de la Concepción vacation rentals is listings accommodating 2 guests (33.3%). This suggests the primary traveler segment is likely couples or solo travelers.
- Properties designed for 2 guests and 4 guests dominate the Villanueva de la Concepción STR market, accounting for 56.6% of listings.
- 30.0% of properties accommodate 6+ guests, serving the market segment for larger families or group travel in Villanueva de la Concepción.
- On average, properties in Villanueva de la Concepción are equipped to host 4.1 guests.
Villanueva de la Concepción Airbnb Booking Patterns (2025): Available vs. Booked Days
Available Days Distribution
Booked Days Distribution
Booking Pattern Insights for Villanueva de la Concepción
- The most common availability pattern in Villanueva de la Concepción falls within the 271-366 days range, representing 40% of listings. This suggests many properties have significant open periods on their calendars.
- Approximately 76.7% of listings show high availability (181+ days open annually), indicating potential for increased bookings or specific owner usage patterns.
- For booked days, the 91-180 days range is most frequent in Villanueva de la Concepción (33.3%), reflecting common guest stay durations or potential owner blocking patterns.
- A notable 26.7% of properties secure long booking periods (181+ days booked per year), highlighting successful long-term rental strategies or significant owner usage.
Villanueva de la Concepción Airbnb Minimum Stay Requirements Analysis
Distribution of Listings by Minimum Night Requirement
1 Night
6 listings
20% of total
2 Nights
3 listings
10% of total
3 Nights
4 listings
13.3% of total
4-6 Nights
5 listings
16.7% of total
7-29 Nights
3 listings
10% of total
30+ Nights
9 listings
30% of total
Key Insights
- The most prevalent minimum stay requirement in Villanueva de la Concepción is 30+ Nights, adopted by 30% of listings. This highlights the market's preference for longer commitments.
- A significant segment (30%) caters to monthly stays (30+ nights) in Villanueva de la Concepción, pointing to opportunities in the extended-stay market.
Recommendations
- Align with the market by considering a 30+ Nights minimum stay, as 30% of Villanueva de la Concepción hosts use this setting.
- If feasible, allowing 1-night stays, especially midweek or during low season, could capture last-minute bookings, as only 20% currently do.
- Explore offering discounts for stays of 30+ nights to attract the 30% of the market seeking extended stays.
- Adjust minimum nights based on seasonality – potentially shorter during low season and longer during peak demand periods in Villanueva de la Concepción.
Villanueva de la Concepción Airbnb Cancellation Policy Trends Analysis (2025)
Flexible
4 listings
15.4% of total
Moderate
8 listings
30.8% of total
Firm
5 listings
19.2% of total
Strict
9 listings
34.6% of total
Cancellation Policy Insights for Villanueva de la Concepción
- The prevailing Airbnb cancellation policy trend in Villanueva de la Concepción is Strict, used by 34.6% of listings.
- A majority (53.8%) of hosts in Villanueva de la Concepción utilize Firm or Strict policies, indicating a market where hosts prioritize booking security.
Recommendations for Hosts
- Consider adopting a Strict policy to align with the 34.6% market standard in Villanueva de la Concepción.
- With 34.6% using Strict terms, this is a viable option in Villanueva de la Concepción, particularly for high-value properties or during peak demand periods.
- Regularly review your cancellation policy against competitors and market demand shifts in Villanueva de la Concepción.
Villanueva de la Concepción STR Booking Lead Time Analysis (2025)
Average Booking Lead Time by Month
Booking Lead Time Insights for Villanueva de la Concepción
- The overall average booking lead time for vacation rentals in Villanueva de la Concepción is 59 days.
- Guests book furthest in advance for stays during June (average 105 days), likely coinciding with peak travel demand or local events.
- The shortest booking windows occur for stays in February (average 28 days), indicating more last-minute travel plans during this time.
- Seasonally, Summer (99 days avg.) sees the longest lead times, while Winter (34 days avg.) has the shortest, reflecting typical travel planning cycles.
Recommendations for Hosts
- Use the overall average lead time (59 days) as a baseline for your pricing and availability strategy in Villanueva de la Concepción.
- For June stays, consider implementing length-of-stay discounts or slightly higher rates for bookings made less than 105 days out to capitalize on advance planning.
- Target marketing efforts for the Summer season well in advance (at least 99 days) to capture early planners.
- Monitor your own booking lead times against these Villanueva de la Concepción averages to identify opportunities for dynamic pricing adjustments.
Popular & Essential Airbnb Amenities in Villanueva de la Concepción (2025)
Amenity Prevalence
Amenity Insights for Villanueva de la Concepción
- Essential amenities in Villanueva de la Concepción that guests expect include: Wifi, TV, Kitchen. Lacking these (any) could significantly impact bookings.
- Popular amenities like Hair dryer, Washer, Air conditioning are common but not universal. Offering these can provide a competitive edge.
Recommendations for Hosts
- Ensure your listing includes all essential amenities for Villanueva de la Concepción: Wifi, TV, Kitchen.
- Prioritize adding missing essentials: Kitchen.
- Consider adding popular differentiators like Hair dryer or Washer to increase appeal.
- Highlight unique or less common amenities you offer (e.g., hot tub, dedicated workspace, EV charger) in your listing description and photos.
- Regularly check competitor amenities in Villanueva de la Concepción to stay competitive.
Villanueva de la Concepción Airbnb Guest Demographics & Profile Analysis (2025)
Guest Profile Summary for Villanueva de la Concepción
- The typical guest profile for Airbnb in Villanueva de la Concepción consists of predominantly international visitors (87%), with top international origins including United Kingdom, typically belonging to the Post-2000s (Gen Z/Alpha) group (50%), primarily speaking English or French.
- Domestic travelers account for 12.9% of guests.
- Key international markets include France (19.4%) and United Kingdom (17.3%).
- Top languages spoken are English (35.8%) followed by French (21.8%).
- A significant demographic segment is the Post-2000s (Gen Z/Alpha) group, representing 50% of guests.
Recommendations for Hosts
- Focus marketing internationally, particularly towards travelers from United Kingdom.
- Tailor amenities and listing descriptions to appeal to the dominant Post-2000s (Gen Z/Alpha) demographic (e.g., highlight fast WiFi, smart home features, local guides).
- Highlight unique local experiences or amenities relevant to the primary guest profile.
- Consider seasonal promotions aligned with peak travel times for key origin markets.
Nearby Short-Term Rental Market Comparison
How does the Villanueva de la Concepción Airbnb market stack up against its neighbors? Compare key performance metrics like average monthly revenue, ADR, and occupancy rates in surrounding areas to understand the broader regional STR landscape.
| Market | Active Properties | Monthly Revenue | Daily Rate | Avg. Occupancy |
|---|---|---|---|---|
| Alhaurín de la Torre | 203 | $3,368 | $287.14 | 47% |
| Benahavís | 492 | $3,047 | $494.00 | 40% |
| Alhaurín el Grande | 281 | $3,026 | $290.27 | 45% |
| Cártama | 56 | $2,829 | $300.39 | 43% |
| Marbella | 4,981 | $2,613 | $321.31 | 43% |
| Málaga | 7,038 | $2,217 | $162.86 | 54% |
| Coín | 113 | $2,208 | $261.43 | 43% |
| San Roque | 334 | $2,207 | $325.49 | 40% |
| Seville | 6,518 | $2,195 | $155.35 | 51% |
| Moclinejo | 10 | $2,155 | $231.35 | 51% |