Tolox Airbnb Market Analysis 2025: Short Term Rental Data & Vacation Rental Statistics in Andalusia, Spain
Is Airbnb profitable in Tolox in 2025? Explore comprehensive Airbnb analytics for Tolox, Andalusia, Spain to uncover income potential. This 2025 STR market report for Tolox, based on AirROI data from April 2024 to March 2025, reveals key trends in the niche market of 28 active listings.
Whether you're considering an Airbnb investment in Tolox, optimizing your existing vacation rental, or exploring rental arbitrage opportunities, understanding the Tolox Airbnb data is crucial. Navigating the high regulation landscape is key to maximizing your short term rental income potential. Let's dive into the specifics.
Key Tolox Airbnb Performance Metrics Overview
Monthly Airbnb Revenue Variations & Income Potential in Tolox (2025)
Understanding the monthly revenue variations for Airbnb listings in Tolox is key to maximizing your short term rental income potential. Seasonality significantly impacts earnings. Our analysis, based on data from the past 12 months, shows that the peak revenue month for STRs in Tolox is typically August, while January often presents the lowest earnings, highlighting opportunities for strategic pricing adjustments during shoulder and low seasons. Explore the typical Airbnb income in Tolox across different performance tiers:
- Best-in-class properties (Top 10%) achieve $2,491+ monthly, often utilizing dynamic pricing and superior guest experiences.
- Strong performing properties (Top 25%) earn $1,472 or more, indicating effective management and desirable locations/amenities.
- Typical properties (Median) generate around $845 per month, representing the average market performance.
- Entry-level properties (Bottom 25%) see earnings around $528, often with potential for optimization.
Average Monthly Airbnb Earnings Trend in Tolox
Tolox Airbnb Occupancy Rate Trends (2025)
Maximize your bookings by understanding the Tolox STR occupancy trends. Seasonal demand shifts significantly influence how often properties are booked. Typically, Augustsees the highest demand (peak season occupancy), while January experiences the lowest (low season). Effective strategies, like adjusting minimum stays or offering promotions, can boost occupancy during slower periods. Here's how different property tiers perform in Tolox:
- Best-in-class properties (Top 10%) achieve 68%+ occupancy, indicating high desirability and potentially optimized availability.
- Strong performing properties (Top 25%) maintain 52% or higher occupancy, suggesting good market fit and guest satisfaction.
- Typical properties (Median) have an occupancy rate around 37%.
- Entry-level properties (Bottom 25%) average 21% occupancy, potentially facing higher vacancy.
Average Monthly Occupancy Rate Trend in Tolox
Average Daily Rate (ADR) Airbnb Trends in Tolox (2025)
Effective short term rental pricing strategy in Tolox involves understanding monthly ADR fluctuations. The Average Daily Rate (ADR) for Airbnb in Tolox typically peaks in July and dips lowest during February. Leveraging Airbnb dynamic pricing tools or strategies based on this seasonality can significantly boost revenue. Here's a look at the typical nightly rates achieved:
- Best-in-class properties (Top 10%) command rates of $184+ per night, often due to premium features or locations.
- Strong performing properties (Top 25%) achieve nightly rates of $130 or more.
- Typical properties (Median) charge around $80 per night.
- Entry-level properties (Bottom 25%) earn around $62 per night.
Average Daily Rate (ADR) Trend by Month in Tolox
Get Live Tolox Market Intelligence 👇

Explore Real-time Analytics
Airbnb Seasonality Analysis & Trends in Tolox (2025)
Peak Season (August, July, June)
- Revenue averages $1,893 per month
- Occupancy rates average 55.6%
- Daily rates average $112
Shoulder Season
- Revenue averages $1,100 per month
- Occupancy maintains around 36.1%
- Daily rates hold near $102
Low Season (January, February, November)
- Revenue drops to average $579 per month
- Occupancy decreases to average 24.9%
- Daily rates adjust to average $94
Seasonality Insights for Tolox
- The Airbnb seasonality in Tolox shows highly seasonal trends requiring careful strategy. While the sections above show seasonal averages, it's also insightful to look at the extremes:
- During the high season, the absolute peak month showcases Tolox's highest earning potential, with monthly revenues capable of climbing to $2,352, occupancy reaching a high of 65.2%, and ADRs peaking at $114.
- Conversely, the slowest single month of the year, typically falling within the low season, marks the market's lowest point. In this month, revenue might dip to $445, occupancy could drop to 21.2%, and ADRs may adjust down to $92.
- Understanding both the seasonal averages and these monthly peaks and troughs in revenue, occupancy, and ADR is crucial for maximizing your Airbnb profit potential in Tolox.
Seasonal Strategies for Maximizing Profit
- Peak Season: Maximize revenue through premium pricing and potentially longer minimum stays. Ensure high availability.
- Low Season: Offer competitive pricing, special promotions (e.g., extended stay discounts), and flexible cancellation policies. Target off-season travelers like remote workers or budget-conscious guests.
- Shoulder Seasons: Implement dynamic pricing that balances peak and low rates. Target weekend travelers or specific events. Offer slightly more flexible terms than peak season.
- Regularly analyze your own performance against these Tolox seasonality benchmarks and adjust your pricing and availability strategy accordingly.
Best Areas for Airbnb Investment in Tolox (2025)
Exploring the top neighborhoods for short-term rentals in Tolox? This section highlights key areas, outlining why they are attractive for hosts and guests, along with notable local attractions. Consider these locations based on your target guest profile and investment strategy.
| Neighborhood / Area | Why Host Here? (Target Guests & Appeal) | Key Attractions & Landmarks |
|---|---|---|
| Centro de Tolox | The historical center of Tolox offers charming narrow streets, traditional Andalusian architecture, and a community vibe. It attracts visitors looking for an authentic Spanish experience and easy access to local attractions. | Iglesia de San Miguel, Mercado Municipal, Tolox Natural Park, Local tapas bars, Cultural events |
| La Sierra | Located just outside Tolox, this mountainous area attracts nature lovers and hikers. It's perfect for those seeking tranquility and stunning views of the Andalusian countryside. | Sierra de las Nieves National Park, Hiking trails, Scenic viewpoints, Wildlife watching, Picnic areas |
| Balneario de Tolox | This spa area is famous for its medicinal hot springs, making it a sought-after destination for wellness tourism. It's attractive for visitors looking to relax and rejuvenate. | Hot springs, Spa facilities, Wellness retreats, Nature trails, Relaxation spots |
| El Jardín de Tolox | A picturesque garden area that offers beautiful landscapes and relaxation spots. Ideal for families and couples looking to enjoy nature and a peaceful environment. | Gardens, Nature walks, Picnic areas, Landscaping features, Botanical diversity |
| Caminito del Rey | Although not in Tolox directly, this famous hike is just a short drive away and attracts adventure seekers and tourists from all over. It offers a unique experience in nature. | Caminito del Rey trail, Gorge views, Adventure activities, Photography opportunities, Visitor center |
| Ronda | The historic town of Ronda is within driving distance from Tolox and offers stunning views, rich history, and cultural attractions, making it a popular day-trip destination for visitors. | Puente Nuevo, Plaza de Toros, Old Town, Scenic viewpoints, Wine tasting |
| Málaga Coast | Accessible from Tolox, the coastal areas of Málaga offer beautiful beaches and a vibrant nightlife, appealing to a different set of tourists seeking sun and sea. | Beaches, Water sports, Restaurants, Nightclubs, Shopping areas |
| Cultural and Festivals | Tolox hosts various cultural events and festivals throughout the year, attracting visitors interested in unique local cultures and traditions. | Feria de Tolox, Traditional music, Local cuisine festivals, Craft fairs, Cultural workshops |
Understanding Airbnb License Requirements & STR Laws in Tolox (2025)
Yes, Tolox, Andalusia, Spain enforces high STR regulations. Obtaining a license and ensuring compliance is almost certainly required according to current 2025 STR laws. Always verify the latest short term rental regulations and Airbnb license requirements directly with local government authorities for Tolox to ensure full compliance before hosting.
(Source: AirROI data, 2025, based on 82% licensed listings)
Top Performing Airbnb Properties in Tolox (2025)
Benchmark your potential! Explore examples of top-performing Airbnb properties in Toloxbased on Trailing Twelve Month (TTM) revenue. Analyze their characteristics, revenue, occupancy rate, and ADR to understand what drives success in this market.
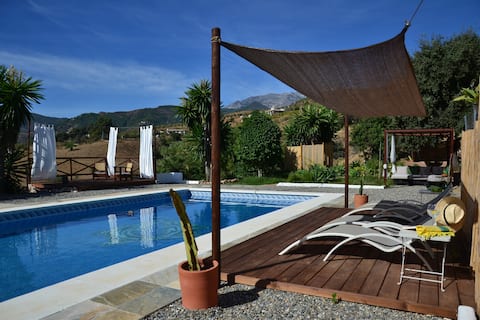
Andalusian Getaway between Ronda and Malaga
Entire Place • 4 bedrooms

Cortijo Rueda Campos Tolox by Ruralidays
Entire Place • 5 bedrooms

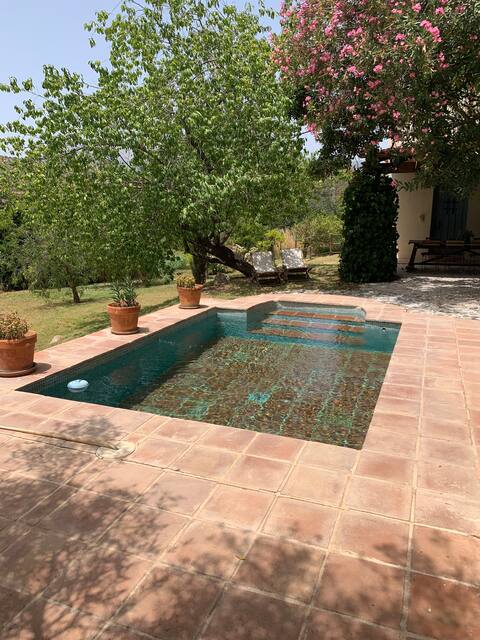
Paradise in Andalusia
Entire Place • 2 bedrooms
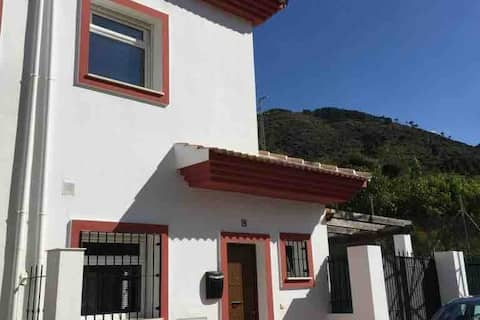
Casa Pueblo Montaña
Entire Place • 3 bedrooms
Charming rural accommodation · Casa Naranjos
Entire Place • 3 bedrooms

Private bungalow with jacuzzi & spectacular views.
Entire Place • 1 bedroom
Note: Performance varies based on location, size, amenities, seasonality, and management quality. Data reflects the past 12 months.
Top Performing Airbnb Hosts in Tolox (2025)
Learn from the best! This table showcases top-performing Airbnb hosts in Tolox based on the number of properties managed and estimated total revenue over the past year. Analyze their scale and performance metrics.
| Host Name | Properties | Grossing Revenue | Stay Reviews | Avg Rating |
|---|---|---|---|---|
| Ruralidays | 3 | $43,175 | 16 | 4.86/5.0 |
| Peter | 4 | $41,345 | 176 | 4.70/5.0 |
| Ana | 1 | $33,147 | 42 | 4.76/5.0 |
| Belén | 2 | $28,629 | 66 | 4.88/5.0 |
| María José | 2 | $19,880 | 21 | 4.78/5.0 |
| Bart | 1 | $19,369 | 48 | 4.92/5.0 |
| Ivan | 1 | $18,358 | 20 | 4.95/5.0 |
| Daniel | 2 | $13,949 | 9 | 2.39/5.0 |
| Marco | 1 | $12,543 | 98 | 4.66/5.0 |
| Ana | 2 | $8,937 | 15 | 4.92/5.0 |
Analyzing the strategies of top hosts, such as their property selection, pricing, and guest communication, can offer valuable lessons for optimizing your own Airbnb operations in Tolox.
Dive Deeper: Advanced Tolox STR Market Data (2025)
Ready to unlock more insights? AirROI provides access to advanced metrics and comprehensive Airbnb data for Tolox. Explore detailed analytics beyond this report to refine your investment strategy, optimize pricing, and maximize your vacation rental profits.
Explore Advanced MetricsTolox Short-Term Rental Market Composition (2025): Property & Room Types
Room Type Distribution
Property Type Distribution
Market Composition Insights for Tolox
- The Tolox Airbnb market composition is heavily skewed towards Entire Home/Apt listings, which make up 100% of the 28 active rentals. This indicates strong guest preference for privacy and space.
- Looking at the property type distribution in Tolox, House properties are the most common (64.3%), reflecting the local real estate landscape.
- Houses represent a significant 64.3% portion, catering likely to families or larger groups.
- Smaller segments like hotel/boutique (combined 3.6%) offer potential for unique stay experiences.
Tolox Airbnb Room Capacity Analysis (2025): Bedroom Distribution
Distribution of Listings by Number of Bedrooms
Room Capacity Insights for Tolox
- The dominant room capacity in Tolox is 1 bedroom listings, making up 42.9% of the market. This suggests a strong demand for properties suitable for couples or solo travelers.
- Together, 1 bedroom and 3 bedrooms properties represent 78.6% of the active Airbnb listings in Tolox, indicating a high concentration in these sizes.
- A significant 42.9% of listings offer 3+ bedrooms, catering to larger groups and families seeking more space in Tolox.
Tolox Vacation Rental Guest Capacity Trends (2025)
Distribution of Listings by Guest Capacity
Guest Capacity Insights for Tolox
- The most common guest capacity trend in Tolox vacation rentals is listings accommodating 4 guests (42.9%). This suggests the primary traveler segment is likely small families or groups.
- Properties designed for 4 guests and 6 guests dominate the Tolox STR market, accounting for 71.5% of listings.
- 42.9% of properties accommodate 6+ guests, serving the market segment for larger families or group travel in Tolox.
- On average, properties in Tolox are equipped to host 4.9 guests.
Tolox Airbnb Booking Patterns (2025): Available vs. Booked Days
Available Days Distribution
Booked Days Distribution
Booking Pattern Insights for Tolox
- The most common availability pattern in Tolox falls within the 271-366 days range, representing 46.4% of listings. This suggests many properties have significant open periods on their calendars.
- Approximately 89.3% of listings show high availability (181+ days open annually), indicating potential for increased bookings or specific owner usage patterns.
- For booked days, the 91-180 days range is most frequent in Tolox (39.3%), reflecting common guest stay durations or potential owner blocking patterns.
- A notable 14.3% of properties secure long booking periods (181+ days booked per year), highlighting successful long-term rental strategies or significant owner usage.
Tolox Airbnb Minimum Stay Requirements Analysis
Distribution of Listings by Minimum Night Requirement
1 Night
7 listings
25.9% of total
2 Nights
15 listings
55.6% of total
3 Nights
4 listings
14.8% of total
4-6 Nights
1 listings
3.7% of total
Key Insights
- The most prevalent minimum stay requirement in Tolox is 2 Nights, adopted by 55.6% of listings. This highlights the market's preference for shorter, flexible bookings.
- A strong majority (81.5%) of the Tolox Airbnb data shows acceptance of very short stays (1-2 nights), indicating a dynamic, high-turnover market.
Recommendations
- Align with the market by considering a 2 Nights minimum stay, as 55.6% of Tolox hosts use this setting.
- If feasible, allowing 1-night stays, especially midweek or during low season, could capture last-minute bookings, as only 25.9% currently do.
- Adjust minimum nights based on seasonality – potentially shorter during low season and longer during peak demand periods in Tolox.
Tolox Airbnb Cancellation Policy Trends Analysis (2025)
Super Strict 60 Days
1 listings
4.2% of total
Flexible
5 listings
20.8% of total
Moderate
6 listings
25% of total
Firm
7 listings
29.2% of total
Strict
5 listings
20.8% of total
Cancellation Policy Insights for Tolox
- The prevailing Airbnb cancellation policy trend in Tolox is Firm, used by 29.2% of listings.
- There's a relatively balanced mix between guest-friendly (45.8%) and stricter (50.0%) policies, offering choices for different guest needs.
Recommendations for Hosts
- Consider adopting a Firm policy to align with the 29.2% market standard in Tolox.
- Regularly review your cancellation policy against competitors and market demand shifts in Tolox.
Tolox STR Booking Lead Time Analysis (2025)
Average Booking Lead Time by Month
Booking Lead Time Insights for Tolox
- The overall average booking lead time for vacation rentals in Tolox is 56 days.
- Guests book furthest in advance for stays during May (average 106 days), likely coinciding with peak travel demand or local events.
- The shortest booking windows occur for stays in February (average 28 days), indicating more last-minute travel plans during this time.
- Seasonally, Summer (81 days avg.) sees the longest lead times, while Winter (39 days avg.) has the shortest, reflecting typical travel planning cycles.
Recommendations for Hosts
- Use the overall average lead time (56 days) as a baseline for your pricing and availability strategy in Tolox.
- For May stays, consider implementing length-of-stay discounts or slightly higher rates for bookings made less than 106 days out to capitalize on advance planning.
- Target marketing efforts for the Summer season well in advance (at least 81 days) to capture early planners.
- Monitor your own booking lead times against these Tolox averages to identify opportunities for dynamic pricing adjustments.
Popular & Essential Airbnb Amenities in Tolox (2025)
Amenity Prevalence
Amenity Insights for Tolox
- Essential amenities in Tolox that guests expect include: Kitchen, Washer, Wifi. Lacking these (any) could significantly impact bookings.
- Popular amenities like TV, Coffee maker, Bed linens are common but not universal. Offering these can provide a competitive edge.
Recommendations for Hosts
- Ensure your listing includes all essential amenities for Tolox: Kitchen, Washer, Wifi.
- Prioritize adding missing essentials: Wifi.
- Consider adding popular differentiators like TV or Coffee maker to increase appeal.
- Highlight unique or less common amenities you offer (e.g., hot tub, dedicated workspace, EV charger) in your listing description and photos.
- Regularly check competitor amenities in Tolox to stay competitive.
Tolox Airbnb Guest Demographics & Profile Analysis (2025)
Guest Profile Summary for Tolox
- The typical guest profile for Airbnb in Tolox consists of predominantly international visitors (69%), with top international origins including United Kingdom, typically belonging to the Post-2000s (Gen Z/Alpha) group (50%), primarily speaking English or Spanish.
- Domestic travelers account for 30.7% of guests.
- Key international markets include Spain (30.7%) and United Kingdom (15.8%).
- Top languages spoken are English (32.4%) followed by Spanish (23%).
- A significant demographic segment is the Post-2000s (Gen Z/Alpha) group, representing 50% of guests.
Recommendations for Hosts
- Focus marketing internationally, particularly towards travelers from United Kingdom.
- Tailor amenities and listing descriptions to appeal to the dominant Post-2000s (Gen Z/Alpha) demographic (e.g., highlight fast WiFi, smart home features, local guides).
- Highlight unique local experiences or amenities relevant to the primary guest profile.
- Consider seasonal promotions aligned with peak travel times for key origin markets.
Nearby Short-Term Rental Market Comparison
How does the Tolox Airbnb market stack up against its neighbors? Compare key performance metrics like average monthly revenue, ADR, and occupancy rates in surrounding areas to understand the broader regional STR landscape.
| Market | Active Properties | Monthly Revenue | Daily Rate | Avg. Occupancy |
|---|---|---|---|---|
| Alhaurín de la Torre | 203 | $3,368 | $287.14 | 47% |
| Benahavís | 492 | $3,047 | $494.00 | 40% |
| Alhaurín el Grande | 281 | $3,026 | $290.27 | 45% |
| Cártama | 56 | $2,829 | $300.39 | 43% |
| Marbella | 4,981 | $2,613 | $321.31 | 43% |
| Málaga | 7,038 | $2,217 | $162.86 | 54% |
| Coín | 113 | $2,208 | $261.43 | 43% |
| San Roque | 334 | $2,207 | $325.49 | 40% |
| Seville | 6,518 | $2,195 | $155.35 | 51% |
| Moclinejo | 10 | $2,155 | $231.35 | 51% |