Sayalonga Airbnb Market Analysis 2025: Short Term Rental Data & Vacation Rental Statistics in Andalusia, Spain
Is Airbnb profitable in Sayalonga in 2025? Explore comprehensive Airbnb analytics for Sayalonga, Andalusia, Spain to uncover income potential. This 2025 STR market report for Sayalonga, based on AirROI data from April 2024 to March 2025, reveals key trends in the niche market of 60 active listings.
Whether you're considering an Airbnb investment in Sayalonga, optimizing your existing vacation rental, or exploring rental arbitrage opportunities, understanding the Sayalonga Airbnb data is crucial. Navigating the high regulation landscape is key to maximizing your short term rental income potential. Let's dive into the specifics.
Key Sayalonga Airbnb Performance Metrics Overview
Monthly Airbnb Revenue Variations & Income Potential in Sayalonga (2025)
Understanding the monthly revenue variations for Airbnb listings in Sayalonga is key to maximizing your short term rental income potential. Seasonality significantly impacts earnings. Our analysis, based on data from the past 12 months, shows that the peak revenue month for STRs in Sayalonga is typically August, while February often presents the lowest earnings, highlighting opportunities for strategic pricing adjustments during shoulder and low seasons. Explore the typical Airbnb income in Sayalonga across different performance tiers:
- Best-in-class properties (Top 10%) achieve $6,059+ monthly, often utilizing dynamic pricing and superior guest experiences.
- Strong performing properties (Top 25%) earn $3,695 or more, indicating effective management and desirable locations/amenities.
- Typical properties (Median) generate around $1,803 per month, representing the average market performance.
- Entry-level properties (Bottom 25%) see earnings around $781, often with potential for optimization.
Average Monthly Airbnb Earnings Trend in Sayalonga
Sayalonga Airbnb Occupancy Rate Trends (2025)
Maximize your bookings by understanding the Sayalonga STR occupancy trends. Seasonal demand shifts significantly influence how often properties are booked. Typically, Augustsees the highest demand (peak season occupancy), while March experiences the lowest (low season). Effective strategies, like adjusting minimum stays or offering promotions, can boost occupancy during slower periods. Here's how different property tiers perform in Sayalonga:
- Best-in-class properties (Top 10%) achieve 77%+ occupancy, indicating high desirability and potentially optimized availability.
- Strong performing properties (Top 25%) maintain 48% or higher occupancy, suggesting good market fit and guest satisfaction.
- Typical properties (Median) have an occupancy rate around 29%.
- Entry-level properties (Bottom 25%) average 15% occupancy, potentially facing higher vacancy.
Average Monthly Occupancy Rate Trend in Sayalonga
Average Daily Rate (ADR) Airbnb Trends in Sayalonga (2025)
Effective short term rental pricing strategy in Sayalonga involves understanding monthly ADR fluctuations. The Average Daily Rate (ADR) for Airbnb in Sayalonga typically peaks in August and dips lowest during April. Leveraging Airbnb dynamic pricing tools or strategies based on this seasonality can significantly boost revenue. Here's a look at the typical nightly rates achieved:
- Best-in-class properties (Top 10%) command rates of $532+ per night, often due to premium features or locations.
- Strong performing properties (Top 25%) achieve nightly rates of $335 or more.
- Typical properties (Median) charge around $174 per night.
- Entry-level properties (Bottom 25%) earn around $109 per night.
Average Daily Rate (ADR) Trend by Month in Sayalonga
Get Live Sayalonga Market Intelligence 👇

Explore Real-time Analytics
Airbnb Seasonality Analysis & Trends in Sayalonga (2025)
Peak Season (August, July, May)
- Revenue averages $4,294 per month
- Occupancy rates average 48.5%
- Daily rates average $285
Shoulder Season
- Revenue averages $2,456 per month
- Occupancy maintains around 31.7%
- Daily rates hold near $274
Low Season (January, February, March)
- Revenue drops to average $1,300 per month
- Occupancy decreases to average 24.9%
- Daily rates adjust to average $273
Seasonality Insights for Sayalonga
- The Airbnb seasonality in Sayalonga shows highly seasonal trends requiring careful strategy. While the sections above show seasonal averages, it's also insightful to look at the extremes:
- During the high season, the absolute peak month showcases Sayalonga's highest earning potential, with monthly revenues capable of climbing to $4,940, occupancy reaching a high of 61.2%, and ADRs peaking at $296.
- Conversely, the slowest single month of the year, typically falling within the low season, marks the market's lowest point. In this month, revenue might dip to $1,118, occupancy could drop to 16.5%, and ADRs may adjust down to $261.
- Understanding both the seasonal averages and these monthly peaks and troughs in revenue, occupancy, and ADR is crucial for maximizing your Airbnb profit potential in Sayalonga.
Seasonal Strategies for Maximizing Profit
- Peak Season: Maximize revenue through premium pricing and potentially longer minimum stays. Ensure high availability.
- Low Season: Offer competitive pricing, special promotions (e.g., extended stay discounts), and flexible cancellation policies. Target off-season travelers like remote workers or budget-conscious guests.
- Shoulder Seasons: Implement dynamic pricing that balances peak and low rates. Target weekend travelers or specific events. Offer slightly more flexible terms than peak season.
- Regularly analyze your own performance against these Sayalonga seasonality benchmarks and adjust your pricing and availability strategy accordingly.
Best Areas for Airbnb Investment in Sayalonga (2025)
Exploring the top neighborhoods for short-term rentals in Sayalonga? This section highlights key areas, outlining why they are attractive for hosts and guests, along with notable local attractions. Consider these locations based on your target guest profile and investment strategy.
| Neighborhood / Area | Why Host Here? (Target Guests & Appeal) | Key Attractions & Landmarks |
|---|---|---|
| Sayalonga Village | A charming white village in the heart of Andalusia, known for its beautiful views, traditional architecture, and authentic Spanish lifestyle. Ideal for travelers seeking tranquility and cultural experiences. | Church of Our Lady of Sorrows, Local restaurants serving traditional tapas, Scenic hiking trails through the countryside, Art galleries showcasing local artists, Wine tasting tours in nearby vineyards |
| Axarquia Coast | This coastal area near Sayalonga offers stunning beaches and a warm climate. Perfect for tourists looking for sun, sea, and relaxation along the Mediterranean. | Burriana Beach, La Herradura Beach, Water sports activities, Dining along the beach, Promenade walks |
| Nerja | A popular tourist destination just a short drive from Sayalonga, Nerja is famous for its picturesque caves and stunning coastline, attracting many visitors each year. | Nerja Caves, Balcony of Europe, Burriana Beach, Old Town with its charming shops and cafes, Buceo diving and snorkeling |
| Frigiliana | Recognized as one of the most beautiful villages in Spain, Frigiliana is renowned for its narrow, winding streets and Moorish heritage, drawing visitors interested in history and photography. | Moorish old quarter, Nature trails, Local artisan shops, Scenic viewpoints, Historical museums |
| Competa | Famous for its wine and local produce, Competa is a vibrant village that attracts visitors for its cultural events and scenic landscapes. | Competa Wine Museum, Annual Fiestas, Stunning mountain views, Local markets, Vineyard tours |
| Malaga City | The bustling capital of the province, Malaga offers a mix of cultural attractions, shopping, and nightlife, making it appealing to a wide range of tourists. | Picasso Museum, Malaga Cathedral, Malagueta Beach, Shopping districts, Nightlife in Soho |
| Torre del Mar | A coastal town with beautiful promenades and excellent amenities, popular among families and sun-seekers looking for a lively beach atmosphere. | Torre del Mar Beach, Water sports facilities, Local restaurants and bars, Annual events and festivals, Shopping centers |
| La Vinuela | A tranquil area surrounding a picturesque lake, great for nature lovers and those looking to escape the hustle and bustle. Offers beautiful views and outdoor activities. | Lake Vinuela, Hiking and biking trails, Local eateries with views, Picnic areas, Water activities like kayaking |
Understanding Airbnb License Requirements & STR Laws in Sayalonga (2025)
Yes, Sayalonga, Andalusia, Spain enforces high STR regulations. Obtaining a license and ensuring compliance is almost certainly required according to current 2025 STR laws. Always verify the latest short term rental regulations and Airbnb license requirements directly with local government authorities for Sayalonga to ensure full compliance before hosting.
(Source: AirROI data, 2025, based on 65% licensed listings)
Top Performing Airbnb Properties in Sayalonga (2025)
Benchmark your potential! Explore examples of top-performing Airbnb properties in Sayalongabased on Trailing Twelve Month (TTM) revenue. Analyze their characteristics, revenue, occupancy rate, and ADR to understand what drives success in this market.
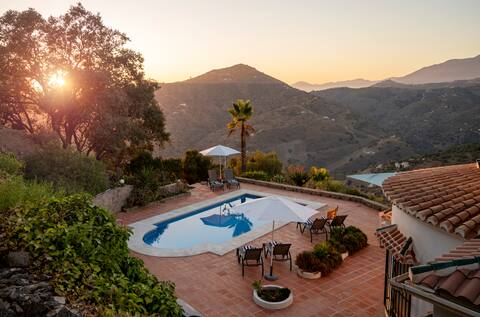
6-Bedroom villa with pool and amazing views
Entire Place • 6 bedrooms
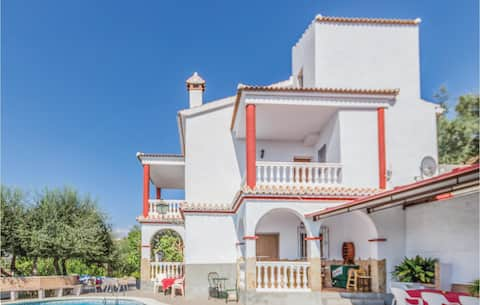
9 bedroom beautiful home in Sayalonga
Entire Place • 9 bedrooms

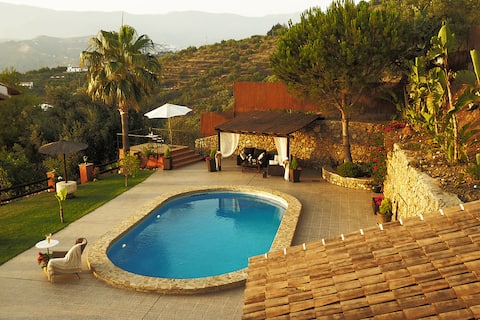
Villa Dajabe
Entire Place • 3 bedrooms
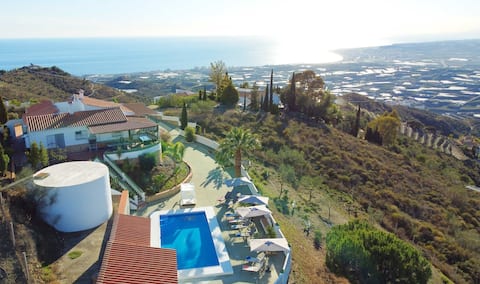
Luxury Villa with Jacuzzi, Pool and Stunning Views
Entire Place • 5 bedrooms
Villa el Pino: with Private Pool
Entire Place • 6 bedrooms

13 bedroom cozy home in Sayalonga
Entire Place • 13 bedrooms
Note: Performance varies based on location, size, amenities, seasonality, and management quality. Data reflects the past 12 months.
Top Performing Airbnb Hosts in Sayalonga (2025)
Learn from the best! This table showcases top-performing Airbnb hosts in Sayalonga based on the number of properties managed and estimated total revenue over the past year. Analyze their scale and performance metrics.
| Host Name | Properties | Grossing Revenue | Stay Reviews | Avg Rating |
|---|---|---|---|---|
| Thomas | 1 | $114,701 | 35 | 4.89/5.0 |
| Novasol | 1 | $86,686 | 4 | 4.75/5.0 |
| Novasol | 2 | $74,911 | 15 | 4.72/5.0 |
| Host #392227252 | 4 | $61,276 | 2 | 0.00/5.0 |
| Mónica | 1 | $58,805 | 41 | 4.93/5.0 |
| Anouk | 3 | $56,192 | 68 | 4.99/5.0 |
| Desi | 1 | $51,673 | 21 | 4.86/5.0 |
| Rafael | 1 | $49,137 | 62 | 4.65/5.0 |
| Mariló | 2 | $46,087 | 15 | 4.96/5.0 |
| Miguel | 2 | $44,205 | 33 | 4.93/5.0 |
Analyzing the strategies of top hosts, such as their property selection, pricing, and guest communication, can offer valuable lessons for optimizing your own Airbnb operations in Sayalonga.
Dive Deeper: Advanced Sayalonga STR Market Data (2025)
Ready to unlock more insights? AirROI provides access to advanced metrics and comprehensive Airbnb data for Sayalonga. Explore detailed analytics beyond this report to refine your investment strategy, optimize pricing, and maximize your vacation rental profits.
Explore Advanced MetricsSayalonga Short-Term Rental Market Composition (2025): Property & Room Types
Room Type Distribution
Property Type Distribution
Market Composition Insights for Sayalonga
- The Sayalonga Airbnb market composition is heavily skewed towards Entire Home/Apt listings, which make up 90% of the 60 active rentals. This indicates strong guest preference for privacy and space.
- Looking at the property type distribution in Sayalonga, House properties are the most common (76.7%), reflecting the local real estate landscape.
- Houses represent a significant 76.7% portion, catering likely to families or larger groups.
- The presence of 10% Hotel/Boutique listings indicates integration with traditional hospitality.
- Smaller segments like outdoor/unique (combined 1.7%) offer potential for unique stay experiences.
Sayalonga Airbnb Room Capacity Analysis (2025): Bedroom Distribution
Distribution of Listings by Number of Bedrooms
Room Capacity Insights for Sayalonga
- The dominant room capacity in Sayalonga is 3 bedrooms listings, making up 26.7% of the market. This suggests a strong demand for properties suitable for families or small groups.
- Together, 3 bedrooms and 5+ bedrooms properties represent 46.7% of the active Airbnb listings in Sayalonga, indicating a high concentration in these sizes.
- A significant 63.4% of listings offer 3+ bedrooms, catering to larger groups and families seeking more space in Sayalonga.
Sayalonga Vacation Rental Guest Capacity Trends (2025)
Distribution of Listings by Guest Capacity
Guest Capacity Insights for Sayalonga
- The most common guest capacity trend in Sayalonga vacation rentals is listings accommodating 8+ guests (36.7%). This suggests the primary traveler segment is likely larger groups.
- Properties designed for 8+ guests and 6 guests dominate the Sayalonga STR market, accounting for 61.7% of listings.
- 66.7% of properties accommodate 6+ guests, serving the market segment for larger families or group travel in Sayalonga.
- On average, properties in Sayalonga are equipped to host 5.8 guests.
Sayalonga Airbnb Booking Patterns (2025): Available vs. Booked Days
Available Days Distribution
Booked Days Distribution
Booking Pattern Insights for Sayalonga
- The most common availability pattern in Sayalonga falls within the 271-366 days range, representing 56.7% of listings. This suggests many properties have significant open periods on their calendars.
- Approximately 90.0% of listings show high availability (181+ days open annually), indicating potential for increased bookings or specific owner usage patterns.
- For booked days, the 91-180 days range is most frequent in Sayalonga (35%), reflecting common guest stay durations or potential owner blocking patterns.
- A notable 10.0% of properties secure long booking periods (181+ days booked per year), highlighting successful long-term rental strategies or significant owner usage.
Sayalonga Airbnb Minimum Stay Requirements Analysis
Distribution of Listings by Minimum Night Requirement
1 Night
13 listings
24.1% of total
2 Nights
10 listings
18.5% of total
3 Nights
8 listings
14.8% of total
4-6 Nights
11 listings
20.4% of total
7-29 Nights
6 listings
11.1% of total
30+ Nights
6 listings
11.1% of total
Key Insights
- The most prevalent minimum stay requirement in Sayalonga is 1 Night, adopted by 24.1% of listings. This highlights the market's preference for shorter, flexible bookings.
- A significant segment (11.1%) caters to monthly stays (30+ nights) in Sayalonga, pointing to opportunities in the extended-stay market.
Recommendations
- Align with the market by considering a 1 Night minimum stay, as 24.1% of Sayalonga hosts use this setting.
- If feasible, allowing 1-night stays, especially midweek or during low season, could capture last-minute bookings, as only 24.1% currently do.
- Explore offering discounts for stays of 30+ nights to attract the 11.1% of the market seeking extended stays.
- Adjust minimum nights based on seasonality – potentially shorter during low season and longer during peak demand periods in Sayalonga.
Sayalonga Airbnb Cancellation Policy Trends Analysis (2025)
Super Strict 60 Days
7 listings
15.9% of total
Super Strict 30 Days
1 listings
2.3% of total
Flexible
14 listings
31.8% of total
Moderate
2 listings
4.5% of total
Firm
9 listings
20.5% of total
Strict
11 listings
25% of total
Cancellation Policy Insights for Sayalonga
- The prevailing Airbnb cancellation policy trend in Sayalonga is Flexible, used by 31.8% of listings.
- There's a relatively balanced mix between guest-friendly (36.3%) and stricter (45.5%) policies, offering choices for different guest needs.
Recommendations for Hosts
- Consider adopting a Flexible policy to align with the 31.8% market standard in Sayalonga.
- Regularly review your cancellation policy against competitors and market demand shifts in Sayalonga.
Sayalonga STR Booking Lead Time Analysis (2025)
Average Booking Lead Time by Month
Booking Lead Time Insights for Sayalonga
- The overall average booking lead time for vacation rentals in Sayalonga is 84 days.
- Guests book furthest in advance for stays during October (average 130 days), likely coinciding with peak travel demand or local events.
- The shortest booking windows occur for stays in March (average 56 days), indicating more last-minute travel plans during this time.
- Seasonally, Summer (111 days avg.) sees the longest lead times, while Winter (77 days avg.) has the shortest, reflecting typical travel planning cycles.
Recommendations for Hosts
- Use the overall average lead time (84 days) as a baseline for your pricing and availability strategy in Sayalonga.
- For October stays, consider implementing length-of-stay discounts or slightly higher rates for bookings made less than 130 days out to capitalize on advance planning.
- Target marketing efforts for the Summer season well in advance (at least 111 days) to capture early planners.
- Monitor your own booking lead times against these Sayalonga averages to identify opportunities for dynamic pricing adjustments.
Popular & Essential Airbnb Amenities in Sayalonga (2025)
Amenity Prevalence
Amenity Insights for Sayalonga
- Essential amenities in Sayalonga that guests expect include: TV, Wifi. Lacking these (any) could significantly impact bookings.
- Popular amenities like Heating, Kitchen, Washer are common but not universal. Offering these can provide a competitive edge.
Recommendations for Hosts
- Ensure your listing includes all essential amenities for Sayalonga: TV, Wifi.
- Prioritize adding missing essentials: TV, Wifi.
- Consider adding popular differentiators like Heating or Kitchen to increase appeal.
- Highlight unique or less common amenities you offer (e.g., hot tub, dedicated workspace, EV charger) in your listing description and photos.
- Regularly check competitor amenities in Sayalonga to stay competitive.
Sayalonga Airbnb Guest Demographics & Profile Analysis (2025)
Guest Profile Summary for Sayalonga
- The typical guest profile for Airbnb in Sayalonga consists of predominantly international visitors (77%), with top international origins including Germany, typically belonging to the Post-2000s (Gen Z/Alpha) group (50%), primarily speaking English or Spanish.
- Domestic travelers account for 22.8% of guests.
- Key international markets include Spain (22.8%) and Germany (19%).
- Top languages spoken are English (39.2%) followed by Spanish (19.9%).
- A significant demographic segment is the Post-2000s (Gen Z/Alpha) group, representing 50% of guests.
Recommendations for Hosts
- Focus marketing internationally, particularly towards travelers from Germany.
- Tailor amenities and listing descriptions to appeal to the dominant Post-2000s (Gen Z/Alpha) demographic (e.g., highlight fast WiFi, smart home features, local guides).
- Highlight unique local experiences or amenities relevant to the primary guest profile.
- Consider seasonal promotions aligned with peak travel times for key origin markets.
Nearby Short-Term Rental Market Comparison
How does the Sayalonga Airbnb market stack up against its neighbors? Compare key performance metrics like average monthly revenue, ADR, and occupancy rates in surrounding areas to understand the broader regional STR landscape.
| Market | Active Properties | Monthly Revenue | Daily Rate | Avg. Occupancy |
|---|---|---|---|---|
| Alhaurín de la Torre | 203 | $3,368 | $287.14 | 47% |
| Benahavís | 492 | $3,047 | $494.00 | 40% |
| Alhaurín el Grande | 281 | $3,026 | $290.27 | 45% |
| Cártama | 56 | $2,829 | $300.39 | 43% |
| Marbella | 4,981 | $2,613 | $321.31 | 43% |
| Málaga | 7,038 | $2,217 | $162.86 | 54% |
| Coín | 113 | $2,208 | $261.43 | 43% |
| San Roque | 334 | $2,207 | $325.49 | 40% |
| Seville | 6,518 | $2,195 | $155.35 | 51% |
| Moclinejo | 10 | $2,155 | $231.35 | 51% |