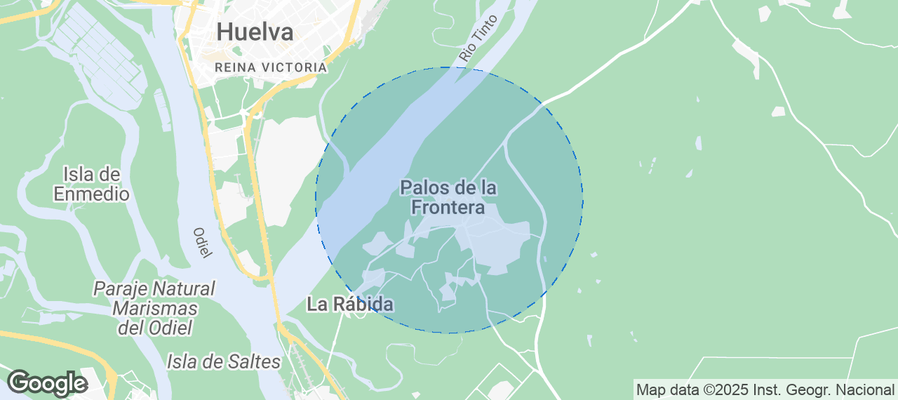
Palos de la Frontera Airbnb Market Analysis 2025: Short Term Rental Data & Vacation Rental Statistics in Andalusia, Spain
Is Airbnb profitable in Palos de la Frontera in 2025? Explore comprehensive Airbnb analytics for Palos de la Frontera, Andalusia, Spain to uncover income potential. This 2025 STR market report for Palos de la Frontera, based on AirROI data from April 2024 to March 2025, reveals key trends in the niche market of 36 active listings.
Whether you're considering an Airbnb investment in Palos de la Frontera, optimizing your existing vacation rental, or exploring rental arbitrage opportunities, understanding the Palos de la Frontera Airbnb data is crucial. Navigating the high regulation landscape is key to maximizing your short term rental income potential. Let's dive into the specifics.
Key Palos de la Frontera Airbnb Performance Metrics Overview
Monthly Airbnb Revenue Variations & Income Potential in Palos de la Frontera (2025)
Understanding the monthly revenue variations for Airbnb listings in Palos de la Frontera is key to maximizing your short term rental income potential. Seasonality significantly impacts earnings. Our analysis, based on data from the past 12 months, shows that the peak revenue month for STRs in Palos de la Frontera is typically August, while January often presents the lowest earnings, highlighting opportunities for strategic pricing adjustments during shoulder and low seasons. Explore the typical Airbnb income in Palos de la Frontera across different performance tiers:
- Best-in-class properties (Top 10%) achieve $4,394+ monthly, often utilizing dynamic pricing and superior guest experiences.
- Strong performing properties (Top 25%) earn $2,678 or more, indicating effective management and desirable locations/amenities.
- Typical properties (Median) generate around $1,438 per month, representing the average market performance.
- Entry-level properties (Bottom 25%) see earnings around $743, often with potential for optimization.
Average Monthly Airbnb Earnings Trend in Palos de la Frontera
Palos de la Frontera Airbnb Occupancy Rate Trends (2025)
Maximize your bookings by understanding the Palos de la Frontera STR occupancy trends. Seasonal demand shifts significantly influence how often properties are booked. Typically, Augustsees the highest demand (peak season occupancy), while January experiences the lowest (low season). Effective strategies, like adjusting minimum stays or offering promotions, can boost occupancy during slower periods. Here's how different property tiers perform in Palos de la Frontera:
- Best-in-class properties (Top 10%) achieve 69%+ occupancy, indicating high desirability and potentially optimized availability.
- Strong performing properties (Top 25%) maintain 52% or higher occupancy, suggesting good market fit and guest satisfaction.
- Typical properties (Median) have an occupancy rate around 29%.
- Entry-level properties (Bottom 25%) average 11% occupancy, potentially facing higher vacancy.
Average Monthly Occupancy Rate Trend in Palos de la Frontera
Average Daily Rate (ADR) Airbnb Trends in Palos de la Frontera (2025)
Effective short term rental pricing strategy in Palos de la Frontera involves understanding monthly ADR fluctuations. The Average Daily Rate (ADR) for Airbnb in Palos de la Frontera typically peaks in August and dips lowest during March. Leveraging Airbnb dynamic pricing tools or strategies based on this seasonality can significantly boost revenue. Here's a look at the typical nightly rates achieved:
- Best-in-class properties (Top 10%) command rates of $317+ per night, often due to premium features or locations.
- Strong performing properties (Top 25%) achieve nightly rates of $178 or more.
- Typical properties (Median) charge around $115 per night.
- Entry-level properties (Bottom 25%) earn around $91 per night.
Average Daily Rate (ADR) Trend by Month in Palos de la Frontera
Get Live Palos de la Frontera Market Intelligence 👇
Explore Real-time Analytics
Airbnb Seasonality Analysis & Trends in Palos de la Frontera (2025)
Peak Season (August, July, June)
- Revenue averages $3,491 per month
- Occupancy rates average 51.1%
- Daily rates average $204
Shoulder Season
- Revenue averages $1,846 per month
- Occupancy maintains around 30.3%
- Daily rates hold near $181
Low Season (January, February, November)
- Revenue drops to average $814 per month
- Occupancy decreases to average 26.4%
- Daily rates adjust to average $166
Seasonality Insights for Palos de la Frontera
- The Airbnb seasonality in Palos de la Frontera shows highly seasonal trends requiring careful strategy. While the sections above show seasonal averages, it's also insightful to look at the extremes:
- During the high season, the absolute peak month showcases Palos de la Frontera's highest earning potential, with monthly revenues capable of climbing to $3,767, occupancy reaching a high of 60.4%, and ADRs peaking at $206.
- Conversely, the slowest single month of the year, typically falling within the low season, marks the market's lowest point. In this month, revenue might dip to $774, occupancy could drop to 21.9%, and ADRs may adjust down to $161.
- Understanding both the seasonal averages and these monthly peaks and troughs in revenue, occupancy, and ADR is crucial for maximizing your Airbnb profit potential in Palos de la Frontera.
Seasonal Strategies for Maximizing Profit
- Peak Season: Maximize revenue through premium pricing and potentially longer minimum stays. Ensure high availability.
- Low Season: Offer competitive pricing, special promotions (e.g., extended stay discounts), and flexible cancellation policies. Target off-season travelers like remote workers or budget-conscious guests.
- Shoulder Seasons: Implement dynamic pricing that balances peak and low rates. Target weekend travelers or specific events. Offer slightly more flexible terms than peak season.
- Regularly analyze your own performance against these Palos de la Frontera seasonality benchmarks and adjust your pricing and availability strategy accordingly.
Best Areas for Airbnb Investment in Palos de la Frontera (2025)
Exploring the top neighborhoods for short-term rentals in Palos de la Frontera? This section highlights key areas, outlining why they are attractive for hosts and guests, along with notable local attractions. Consider these locations based on your target guest profile and investment strategy.
| Neighborhood / Area | Why Host Here? (Target Guests & Appeal) | Key Attractions & Landmarks |
|---|---|---|
| El Rompido | A picturesque fishing village known for its beautiful beaches and natural parks. Ideal for those looking to enjoy nature and aquatic sports. | El Rompido Beach, Santuario de Nuestra Señora de la Merced, Marismas del Río Piedras, Golf Course of El Rompido, Natural Park of Marismas del Odiel |
| Punta Umbría | A lively coastal town famous for its stunning beaches and vibrant nightlife. Perfect for families and young travelers seeking sun and fun. | Punta Umbría Beach, Playa de la Canaleta, Cerro del Trigo, Punta Umbría Marina, Local seafood restaurants |
| Cartaya | Known for its historical charm and close proximity to nature reserves, offering a mix of heritage and outdoor activities for visitors. | Castillo de Cartaya, Parque Natural de las Marismas del Odiel, Beach of Nueva Umbría, Golf Course of El Rompido, Cartaya's old town |
| Huelva City | The capital of the province with its rich history and vibrant culture. Offers access to various attractions and is a hub for travelers exploring the region. | Museo de Huelva, Casa Colón, Plaza de las Monjas, Catedral de la Merced, Colombian cultural sites |
| Isla Cristina | A charming coastal town known for its fishing industry and beautiful beaches. Great for those looking to explore authentic Andalusian culture. | Isla Cristina Beach, Natural Park of Marismas del Odiel, Marina of Isla Cristina, Local fish markets, Cultural events and festivals |
| La Antilla | A popular holiday spot with sandy beaches and family-friendly accommodations. Ideal for those seeking a relaxed beach vacation. | La Antilla Beach, Pine forest walking trails, Water sports activities, Nearby golf courses, Charming promenades |
| Matalascañas | Famous for its proximity to Doñana National Park, offering both beach and nature experiences. Attracts eco-tourists and beach lovers. | Matalascañas Beach, Doñana Natural Park, Historic site of the Dunes, Water sports, Beachfront bars and restaurants |
| Bollullos par del Condado | A town known for its wine production and picturesque landscapes. Appeals to visitors interested in gastronomy and wine tourism. | Wine cellars, Local vineyards, Culinary tours, Historical architecture, Traditional Andalusian culture |
Understanding Airbnb License Requirements & STR Laws in Palos de la Frontera (2025)
Yes, Palos de la Frontera, Andalusia, Spain enforces high STR regulations. Obtaining a license and ensuring compliance is almost certainly required according to current 2025 STR laws. Always verify the latest short term rental regulations and Airbnb license requirements directly with local government authorities for Palos de la Frontera to ensure full compliance before hosting.
(Source: AirROI data, 2025, based on 81% licensed listings)
Top Performing Airbnb Properties in Palos de la Frontera (2025)
Benchmark your potential! Explore examples of top-performing Airbnb properties in Palos de la Fronterabased on Trailing Twelve Month (TTM) revenue. Analyze their characteristics, revenue, occupancy rate, and ADR to understand what drives success in this market.
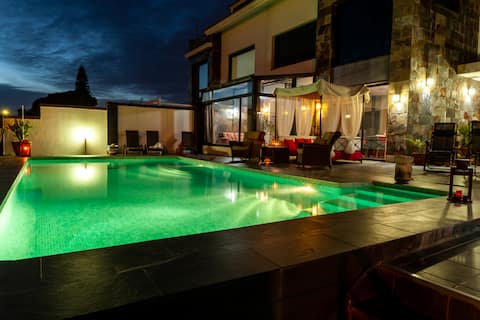
CHALET WITH PRIVATE POOL IN MAZAGON
Entire Place • 4 bedrooms
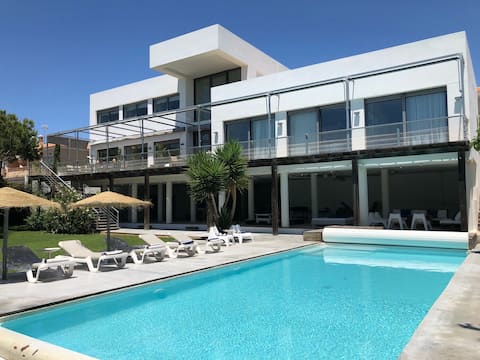
Amazing villa on the beach.
Entire Place • 8 bedrooms

TWO HOUSES IN ONE, WITH COMMON PATIO 25M FROM THE BEACH
Entire Place • 6 bedrooms
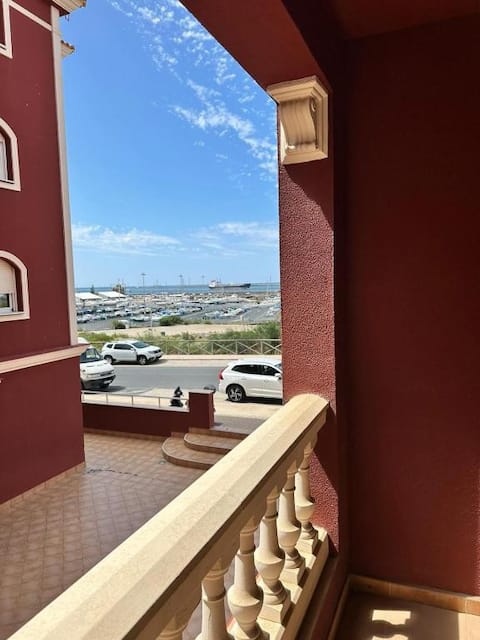
Apartment Puerto III Playa
Entire Place • 1 bedroom
Cortijo Andaluz el Rincón de la Rábida
Entire Place • 6 bedrooms

Chalet Playa de Mazagón
Entire Place • 3 bedrooms
Note: Performance varies based on location, size, amenities, seasonality, and management quality. Data reflects the past 12 months.
Top Performing Airbnb Hosts in Palos de la Frontera (2025)
Learn from the best! This table showcases top-performing Airbnb hosts in Palos de la Frontera based on the number of properties managed and estimated total revenue over the past year. Analyze their scale and performance metrics.
| Host Name | Properties | Grossing Revenue | Stay Reviews | Avg Rating |
|---|---|---|---|---|
| Paco | 1 | $69,187 | 17 | 5.00/5.0 |
| Begoña | 4 | $63,541 | 63 | 3.56/5.0 |
| Gonzalo | 1 | $61,925 | 12 | 4.92/5.0 |
| Daniel | 2 | $39,584 | 30 | 4.79/5.0 |
| Hispalis Home | 3 | $36,208 | 19 | 3.23/5.0 |
| Alberto | 3 | $24,900 | 14 | 1.56/5.0 |
| Emilia | 1 | $24,225 | 55 | 4.69/5.0 |
| Plácido | 1 | $23,456 | 8 | 4.50/5.0 |
| Maria | 1 | $22,150 | 23 | 5.00/5.0 |
| Maria Eutimia | 1 | $20,530 | 6 | 4.67/5.0 |
Analyzing the strategies of top hosts, such as their property selection, pricing, and guest communication, can offer valuable lessons for optimizing your own Airbnb operations in Palos de la Frontera.
Dive Deeper: Advanced Palos de la Frontera STR Market Data (2025)
Ready to unlock more insights? AirROI provides access to advanced metrics and comprehensive Airbnb data for Palos de la Frontera. Explore detailed analytics beyond this report to refine your investment strategy, optimize pricing, and maximize your vacation rental profits.
Explore Advanced MetricsPalos de la Frontera Short-Term Rental Market Composition (2025): Property & Room Types
Room Type Distribution
Property Type Distribution
Market Composition Insights for Palos de la Frontera
- The Palos de la Frontera Airbnb market composition is heavily skewed towards Entire Home/Apt listings, which make up 94.4% of the 36 active rentals. This indicates strong guest preference for privacy and space.
- Looking at the property type distribution in Palos de la Frontera, House properties are the most common (52.8%), reflecting the local real estate landscape.
- Houses represent a significant 52.8% portion, catering likely to families or larger groups.
- Smaller segments like hotel/boutique (combined 2.8%) offer potential for unique stay experiences.
Palos de la Frontera Airbnb Room Capacity Analysis (2025): Bedroom Distribution
Distribution of Listings by Number of Bedrooms
Room Capacity Insights for Palos de la Frontera
- The dominant room capacity in Palos de la Frontera is 2 bedrooms listings, making up 30.6% of the market. This suggests a strong demand for properties suitable for couples or solo travelers.
- Together, 2 bedrooms and 1 bedroom properties represent 58.4% of the active Airbnb listings in Palos de la Frontera, indicating a high concentration in these sizes.
- A significant 41.7% of listings offer 3+ bedrooms, catering to larger groups and families seeking more space in Palos de la Frontera.
Palos de la Frontera Vacation Rental Guest Capacity Trends (2025)
Distribution of Listings by Guest Capacity
Guest Capacity Insights for Palos de la Frontera
- The most common guest capacity trend in Palos de la Frontera vacation rentals is listings accommodating 4 guests (36.1%). This suggests the primary traveler segment is likely small families or groups.
- Properties designed for 4 guests and 8+ guests dominate the Palos de la Frontera STR market, accounting for 55.5% of listings.
- 36.1% of properties accommodate 6+ guests, serving the market segment for larger families or group travel in Palos de la Frontera.
- On average, properties in Palos de la Frontera are equipped to host 4.8 guests.
Palos de la Frontera Airbnb Booking Patterns (2025): Available vs. Booked Days
Available Days Distribution
Booked Days Distribution
Booking Pattern Insights for Palos de la Frontera
- The most common availability pattern in Palos de la Frontera falls within the 271-366 days range, representing 58.3% of listings. This suggests many properties have significant open periods on their calendars.
- Approximately 91.6% of listings show high availability (181+ days open annually), indicating potential for increased bookings or specific owner usage patterns.
- For booked days, the 91-180 days range is most frequent in Palos de la Frontera (36.1%), reflecting common guest stay durations or potential owner blocking patterns.
- A notable 11.1% of properties secure long booking periods (181+ days booked per year), highlighting successful long-term rental strategies or significant owner usage.
Palos de la Frontera Airbnb Minimum Stay Requirements Analysis
Distribution of Listings by Minimum Night Requirement
1 Night
7 listings
20.6% of total
2 Nights
11 listings
32.4% of total
3 Nights
3 listings
8.8% of total
4-6 Nights
5 listings
14.7% of total
7-29 Nights
2 listings
5.9% of total
30+ Nights
6 listings
17.6% of total
Key Insights
- The most prevalent minimum stay requirement in Palos de la Frontera is 2 Nights, adopted by 32.4% of listings. This highlights the market's preference for shorter, flexible bookings.
- A significant segment (17.6%) caters to monthly stays (30+ nights) in Palos de la Frontera, pointing to opportunities in the extended-stay market.
Recommendations
- Align with the market by considering a 2 Nights minimum stay, as 32.4% of Palos de la Frontera hosts use this setting.
- If feasible, allowing 1-night stays, especially midweek or during low season, could capture last-minute bookings, as only 20.6% currently do.
- Explore offering discounts for stays of 30+ nights to attract the 17.6% of the market seeking extended stays.
- Adjust minimum nights based on seasonality – potentially shorter during low season and longer during peak demand periods in Palos de la Frontera.
Palos de la Frontera Airbnb Cancellation Policy Trends Analysis (2025)
Flexible
10 listings
32.3% of total
Moderate
5 listings
16.1% of total
Firm
9 listings
29% of total
Strict
7 listings
22.6% of total
Cancellation Policy Insights for Palos de la Frontera
- The prevailing Airbnb cancellation policy trend in Palos de la Frontera is Flexible, used by 32.3% of listings.
- A majority (51.6%) of hosts in Palos de la Frontera utilize Firm or Strict policies, indicating a market where hosts prioritize booking security.
Recommendations for Hosts
- Consider adopting a Flexible policy to align with the 32.3% market standard in Palos de la Frontera.
- Regularly review your cancellation policy against competitors and market demand shifts in Palos de la Frontera.
Palos de la Frontera STR Booking Lead Time Analysis (2025)
Average Booking Lead Time by Month
Booking Lead Time Insights for Palos de la Frontera
- The overall average booking lead time for vacation rentals in Palos de la Frontera is 54 days.
- Guests book furthest in advance for stays during August (average 85 days), likely coinciding with peak travel demand or local events.
- The shortest booking windows occur for stays in October (average 28 days), indicating more last-minute travel plans during this time.
- Seasonally, Summer (75 days avg.) sees the longest lead times, while Fall (39 days avg.) has the shortest, reflecting typical travel planning cycles.
Recommendations for Hosts
- Use the overall average lead time (54 days) as a baseline for your pricing and availability strategy in Palos de la Frontera.
- For August stays, consider implementing length-of-stay discounts or slightly higher rates for bookings made less than 85 days out to capitalize on advance planning.
- Target marketing efforts for the Summer season well in advance (at least 75 days) to capture early planners.
- Monitor your own booking lead times against these Palos de la Frontera averages to identify opportunities for dynamic pricing adjustments.
Popular & Essential Airbnb Amenities in Palos de la Frontera (2025)
Amenity Prevalence
Amenity Insights for Palos de la Frontera
- Essential amenities in Palos de la Frontera that guests expect include: TV, Kitchen, Wifi, Washer. Lacking these (any) could significantly impact bookings.
- Popular amenities like Heating, Essentials, Hot water are common but not universal. Offering these can provide a competitive edge.
Recommendations for Hosts
- Ensure your listing includes all essential amenities for Palos de la Frontera: TV, Kitchen, Wifi, Washer.
- Prioritize adding missing essentials: Wifi, Washer.
- Consider adding popular differentiators like Heating or Essentials to increase appeal.
- Highlight unique or less common amenities you offer (e.g., hot tub, dedicated workspace, EV charger) in your listing description and photos.
- Regularly check competitor amenities in Palos de la Frontera to stay competitive.
Palos de la Frontera Airbnb Guest Demographics & Profile Analysis (2025)
Guest Profile Summary for Palos de la Frontera
- The typical guest profile for Airbnb in Palos de la Frontera consists of a mix of domestic (45%) and international guests, with top international origins including France, typically belonging to the Post-2000s (Gen Z/Alpha) group (50%), primarily speaking English or Spanish.
- Domestic travelers account for 44.6% of guests.
- Key international markets include Spain (44.6%) and France (8.1%).
- Top languages spoken are English (32.9%) followed by Spanish (30%).
- A significant demographic segment is the Post-2000s (Gen Z/Alpha) group, representing 50% of guests.
Recommendations for Hosts
- Balance marketing efforts between domestic and international channels based on the guest mix.
- Tailor amenities and listing descriptions to appeal to the dominant Post-2000s (Gen Z/Alpha) demographic (e.g., highlight fast WiFi, smart home features, local guides).
- Highlight unique local experiences or amenities relevant to the primary guest profile.
- Consider seasonal promotions aligned with peak travel times for key origin markets.
Nearby Short-Term Rental Market Comparison
How does the Palos de la Frontera Airbnb market stack up against its neighbors? Compare key performance metrics like average monthly revenue, ADR, and occupancy rates in surrounding areas to understand the broader regional STR landscape.
| Market | Active Properties | Monthly Revenue | Daily Rate | Avg. Occupancy |
|---|---|---|---|---|
| Gelves | 22 | $3,120 | $185.84 | 53% |
| Benahavís | 492 | $3,047 | $494.00 | 40% |
| Monesterio | 18 | $2,729 | $248.38 | 35% |
| El Castillo de las Guardas | 13 | $2,500 | $247.20 | 38% |
| Guillena | 34 | $2,397 | $273.55 | 36% |
| São Brás de Alportel | 109 | $2,302 | $257.04 | 46% |
| Valencina de la Concepción | 33 | $2,230 | $200.81 | 49% |
| San Roque | 334 | $2,207 | $325.49 | 40% |
| Seville | 6,518 | $2,195 | $155.35 | 51% |
| Benadalid | 14 | $2,084 | $307.70 | 41% |