Oria Airbnb Market Analysis 2025: Short Term Rental Data & Vacation Rental Statistics in Andalusia, Spain
Is Airbnb profitable in Oria in 2025? Explore comprehensive Airbnb analytics for Oria, Andalusia, Spain to uncover income potential. This 2025 STR market report for Oria, based on AirROI data from April 2024 to March 2025, reveals key trends in the niche market of 17 active listings.
Whether you're considering an Airbnb investment in Oria, optimizing your existing vacation rental, or exploring rental arbitrage opportunities, understanding the Oria Airbnb data is crucial. Navigating the high regulation landscape is key to maximizing your short term rental income potential. Let's dive into the specifics.
Key Oria Airbnb Performance Metrics Overview
Monthly Airbnb Revenue Variations & Income Potential in Oria (2025)
Understanding the monthly revenue variations for Airbnb listings in Oria is key to maximizing your short term rental income potential. Seasonality significantly impacts earnings. Our analysis, based on data from the past 12 months, shows that the peak revenue month for STRs in Oria is typically June, while January often presents the lowest earnings, highlighting opportunities for strategic pricing adjustments during shoulder and low seasons. Explore the typical Airbnb income in Oria across different performance tiers:
- Best-in-class properties (Top 10%) achieve $2,303+ monthly, often utilizing dynamic pricing and superior guest experiences.
- Strong performing properties (Top 25%) earn $1,455 or more, indicating effective management and desirable locations/amenities.
- Typical properties (Median) generate around $782 per month, representing the average market performance.
- Entry-level properties (Bottom 25%) see earnings around $250, often with potential for optimization.
Average Monthly Airbnb Earnings Trend in Oria
Oria Airbnb Occupancy Rate Trends (2025)
Maximize your bookings by understanding the Oria STR occupancy trends. Seasonal demand shifts significantly influence how often properties are booked. Typically, Augustsees the highest demand (peak season occupancy), while January experiences the lowest (low season). Effective strategies, like adjusting minimum stays or offering promotions, can boost occupancy during slower periods. Here's how different property tiers perform in Oria:
- Best-in-class properties (Top 10%) achieve 53%+ occupancy, indicating high desirability and potentially optimized availability.
- Strong performing properties (Top 25%) maintain 38% or higher occupancy, suggesting good market fit and guest satisfaction.
- Typical properties (Median) have an occupancy rate around 20%.
- Entry-level properties (Bottom 25%) average 9% occupancy, potentially facing higher vacancy.
Average Monthly Occupancy Rate Trend in Oria
Average Daily Rate (ADR) Airbnb Trends in Oria (2025)
Effective short term rental pricing strategy in Oria involves understanding monthly ADR fluctuations. The Average Daily Rate (ADR) for Airbnb in Oria typically peaks in July and dips lowest during March. Leveraging Airbnb dynamic pricing tools or strategies based on this seasonality can significantly boost revenue. Here's a look at the typical nightly rates achieved:
- Best-in-class properties (Top 10%) command rates of $168+ per night, often due to premium features or locations.
- Strong performing properties (Top 25%) achieve nightly rates of $126 or more.
- Typical properties (Median) charge around $84 per night.
- Entry-level properties (Bottom 25%) earn around $78 per night.
Average Daily Rate (ADR) Trend by Month in Oria
Get Live Oria Market Intelligence 👇

Explore Real-time Analytics
Airbnb Seasonality Analysis & Trends in Oria (2025)
Peak Season (June, August, July)
- Revenue averages $1,655 per month
- Occupancy rates average 37.8%
- Daily rates average $119
Shoulder Season
- Revenue averages $954 per month
- Occupancy maintains around 24.2%
- Daily rates hold near $113
Low Season (January, February, October)
- Revenue drops to average $530 per month
- Occupancy decreases to average 16.7%
- Daily rates adjust to average $112
Seasonality Insights for Oria
- The Airbnb seasonality in Oria shows highly seasonal trends requiring careful strategy. While the sections above show seasonal averages, it's also insightful to look at the extremes:
- During the high season, the absolute peak month showcases Oria's highest earning potential, with monthly revenues capable of climbing to $1,834, occupancy reaching a high of 52.4%, and ADRs peaking at $119.
- Conversely, the slowest single month of the year, typically falling within the low season, marks the market's lowest point. In this month, revenue might dip to $383, occupancy could drop to 10.1%, and ADRs may adjust down to $107.
- Understanding both the seasonal averages and these monthly peaks and troughs in revenue, occupancy, and ADR is crucial for maximizing your Airbnb profit potential in Oria.
Seasonal Strategies for Maximizing Profit
- Peak Season: Maximize revenue through premium pricing and potentially longer minimum stays. Ensure high availability.
- Low Season: Offer competitive pricing, special promotions (e.g., extended stay discounts), and flexible cancellation policies. Target off-season travelers like remote workers or budget-conscious guests.
- Shoulder Seasons: Implement dynamic pricing that balances peak and low rates. Target weekend travelers or specific events. Offer slightly more flexible terms than peak season.
- Regularly analyze your own performance against these Oria seasonality benchmarks and adjust your pricing and availability strategy accordingly.
Best Areas for Airbnb Investment in Oria (2025)
Exploring the top neighborhoods for short-term rentals in Oria? This section highlights key areas, outlining why they are attractive for hosts and guests, along with notable local attractions. Consider these locations based on your target guest profile and investment strategy.
| Neighborhood / Area | Why Host Here? (Target Guests & Appeal) | Key Attractions & Landmarks |
|---|---|---|
| Historic Center | The heart of Oria, with charming narrow streets, historic buildings, and a picturesque atmosphere. Ideal for tourists interested in history and culture. | Church of Santa Maria, Plaza de la Constitución, Castillo de Oria, Calle Real, Local artisan shops |
| Sierra de Oria | A natural area offering beautiful landscapes, hiking opportunities, and outdoor activities. Perfect for nature lovers and those seeking tranquility. | Hiking trails, Natural parks, Wildlife watching, Picnic areas, Stargazing spots |
| Oria Castle | A historical site that attracts visitors interested in medieval architecture and history. Offers stunning views and a glimpse into the past. | Oria Castle ruins, Historical reenactments, Guided tours, Photography opportunities |
| Local Markets | Vibrant markets where locals sell fresh produce and crafts. Attracts visitors looking for authentic local experiences and tastes. | Weekly farmers' market, Artisan food stalls, Local crafts, Cultural events, Live music |
| Nearby Beaches | Proximity to the coast and beaches, offering sun, sea, and sand for those wanting a beach getaway while enjoying the charm of Oria. | Beach activities, Water sports, Beachfront restaurants, Scenic coastline, Sunbathing spots |
| Cultural Festivals | Oria hosts various festivals throughout the year, attracting tourists and providing a rich cultural experience unrivaled in the region. | Annual fairs, Local culinary festivals, Cultural parades, Live performances, Traditional music |
| Cerro de los Santos | An archaeological site nearby that offers insights into ancient cultures. Great for history buffs and those interested in archaeology. | Archaeological tours, Historical significance, Scenic viewpoints, Educational programs, Guided visits |
| Gastronomy Tours | Oria is known for its authentic Andalusian cuisine, making it a prime location for food lovers looking to explore local flavors. | Tapas tasting, Cooking classes, Wine tasting tours, Traditional restaurants, Food festivals |
Understanding Airbnb License Requirements & STR Laws in Oria (2025)
Yes, Oria, Andalusia, Spain enforces high STR regulations. Obtaining a license and ensuring compliance is almost certainly required according to current 2025 STR laws. Always verify the latest short term rental regulations and Airbnb license requirements directly with local government authorities for Oria to ensure full compliance before hosting.
(Source: AirROI data, 2025, based on 47% licensed listings)
Top Performing Airbnb Properties in Oria (2025)
Benchmark your potential! Explore examples of top-performing Airbnb properties in Oriabased on Trailing Twelve Month (TTM) revenue. Analyze their characteristics, revenue, occupancy rate, and ADR to understand what drives success in this market.

Cortijo aldamuz, peace and tranquility
Entire Place • 2 bedrooms
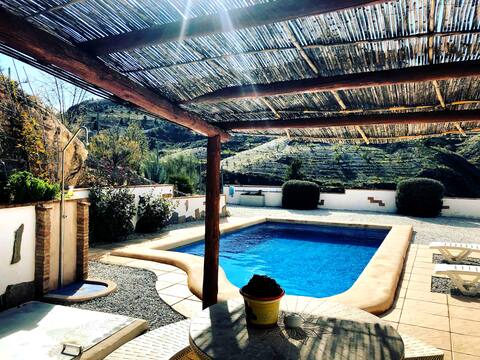
Remote & isolated mountain villa with private pool
Entire Place • 3 bedrooms
cottage sun peace nature bucolic
Entire Place • 2 bedrooms

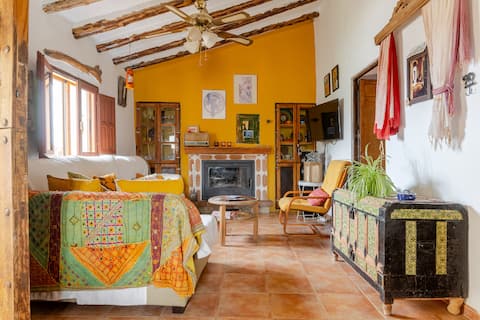
A tranquil mountain escape casa particular & pool
Entire Place • 1 bedroom

Apartment in Oria. Hot tub, pool & stunning views
Entire Place • 1 bedroom
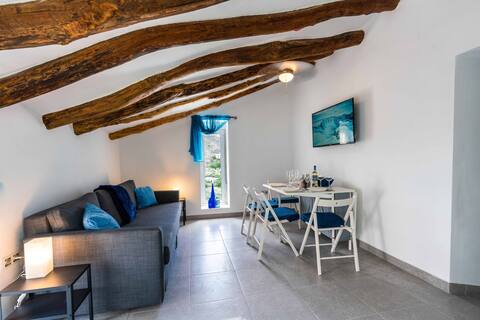
Apartment in Oria with pool and amazing views
Entire Place • 1 bedroom
Note: Performance varies based on location, size, amenities, seasonality, and management quality. Data reflects the past 12 months.
Top Performing Airbnb Hosts in Oria (2025)
Learn from the best! This table showcases top-performing Airbnb hosts in Oria based on the number of properties managed and estimated total revenue over the past year. Analyze their scale and performance metrics.
| Host Name | Properties | Grossing Revenue | Stay Reviews | Avg Rating |
|---|---|---|---|---|
| Marianne | 5 | $23,701 | 18 | 1.90/5.0 |
| Pedro | 1 | $20,414 | 62 | 4.92/5.0 |
| Ben | 1 | $17,182 | 34 | 4.56/5.0 |
| Jose | 1 | $13,934 | 88 | 4.95/5.0 |
| Caroline | 1 | $12,462 | 9 | 5.00/5.0 |
| Host #13611048 | 2 | $5,503 | 1 | 0.00/5.0 |
| Jorge Martínez | 1 | $5,090 | 4 | 4.00/5.0 |
| Andrew | 1 | $2,014 | 4 | 4.75/5.0 |
| Joel | 1 | $995 | 3 | 4.33/5.0 |
| Host #439074505 | 1 | $545 | 2 | 0.00/5.0 |
Analyzing the strategies of top hosts, such as their property selection, pricing, and guest communication, can offer valuable lessons for optimizing your own Airbnb operations in Oria.
Dive Deeper: Advanced Oria STR Market Data (2025)
Ready to unlock more insights? AirROI provides access to advanced metrics and comprehensive Airbnb data for Oria. Explore detailed analytics beyond this report to refine your investment strategy, optimize pricing, and maximize your vacation rental profits.
Explore Advanced MetricsOria Short-Term Rental Market Composition (2025): Property & Room Types
Room Type Distribution
Property Type Distribution
Market Composition Insights for Oria
- The Oria Airbnb market composition is heavily skewed towards Entire Home/Apt listings, which make up 94.1% of the 17 active rentals. This indicates strong guest preference for privacy and space.
- Looking at the property type distribution in Oria, Apartment/Condo properties are the most common (52.9%), reflecting the local real estate landscape.
- Houses represent a significant 41.2% portion, catering likely to families or larger groups.
Oria Airbnb Room Capacity Analysis (2025): Bedroom Distribution
Distribution of Listings by Number of Bedrooms
Room Capacity Insights for Oria
- The dominant room capacity in Oria is 2 bedrooms listings, making up 41.2% of the market. This suggests a strong demand for properties suitable for couples or solo travelers.
- Together, 2 bedrooms and 1 bedroom properties represent 82.4% of the active Airbnb listings in Oria, indicating a high concentration in these sizes.
Oria Vacation Rental Guest Capacity Trends (2025)
Distribution of Listings by Guest Capacity
Guest Capacity Insights for Oria
- The most common guest capacity trend in Oria vacation rentals is listings accommodating 4 guests (35.3%). This suggests the primary traveler segment is likely small families or groups.
- Properties designed for 4 guests and 2 guests dominate the Oria STR market, accounting for 58.8% of listings.
- 23.5% of properties accommodate 6+ guests, serving the market segment for larger families or group travel in Oria.
- On average, properties in Oria are equipped to host 4.5 guests.
Oria Airbnb Booking Patterns (2025): Available vs. Booked Days
Available Days Distribution
Booked Days Distribution
Booking Pattern Insights for Oria
- The most common availability pattern in Oria falls within the 271-366 days range, representing 76.5% of listings. This suggests many properties have significant open periods on their calendars.
- Approximately 100.0% of listings show high availability (181+ days open annually), indicating potential for increased bookings or specific owner usage patterns.
- For booked days, the 1-30 days range is most frequent in Oria (58.8%), reflecting common guest stay durations or potential owner blocking patterns.
- A notable 5.9% of properties secure long booking periods (181+ days booked per year), highlighting successful long-term rental strategies or significant owner usage.
Oria Airbnb Minimum Stay Requirements Analysis
Distribution of Listings by Minimum Night Requirement
1 Night
1 listings
6.7% of total
2 Nights
10 listings
66.7% of total
3 Nights
1 listings
6.7% of total
4-6 Nights
3 listings
20% of total
Key Insights
- The most prevalent minimum stay requirement in Oria is 2 Nights, adopted by 66.7% of listings. This highlights the market's preference for shorter, flexible bookings.
- A strong majority (73.4%) of the Oria Airbnb data shows acceptance of very short stays (1-2 nights), indicating a dynamic, high-turnover market.
Recommendations
- Align with the market by considering a 2 Nights minimum stay, as 66.7% of Oria hosts use this setting.
- If feasible, allowing 1-night stays, especially midweek or during low season, could capture last-minute bookings, as only 6.7% currently do.
- A 2-night minimum appears standard (66.7%). Consider this for weekends or peak periods.
- Adjust minimum nights based on seasonality – potentially shorter during low season and longer during peak demand periods in Oria.
Oria Airbnb Cancellation Policy Trends Analysis (2025)
Super Strict 60 Days
1 listings
11.1% of total
Moderate
3 listings
33.3% of total
Firm
3 listings
33.3% of total
Strict
2 listings
22.2% of total
Cancellation Policy Insights for Oria
- The prevailing Airbnb cancellation policy trend in Oria is Moderate, used by 33.3% of listings.
- A majority (55.5%) of hosts in Oria utilize Firm or Strict policies, indicating a market where hosts prioritize booking security.
Recommendations for Hosts
- Consider adopting a Moderate policy to align with the 33.3% market standard in Oria.
- Regularly review your cancellation policy against competitors and market demand shifts in Oria.
Oria STR Booking Lead Time Analysis (2025)
Average Booking Lead Time by Month
Booking Lead Time Insights for Oria
- The overall average booking lead time for vacation rentals in Oria is 46 days.
- Guests book furthest in advance for stays during October (average 125 days), likely coinciding with peak travel demand or local events.
- The shortest booking windows occur for stays in February (average 10 days), indicating more last-minute travel plans during this time.
- Seasonally, Summer (97 days avg.) sees the longest lead times, while Winter (35 days avg.) has the shortest, reflecting typical travel planning cycles.
Recommendations for Hosts
- Use the overall average lead time (46 days) as a baseline for your pricing and availability strategy in Oria.
- For October stays, consider implementing length-of-stay discounts or slightly higher rates for bookings made less than 125 days out to capitalize on advance planning.
- During February, focus on last-minute booking availability and promotions, as guests book with very short notice (10 days avg.).
- Target marketing efforts for the Summer season well in advance (at least 97 days) to capture early planners.
- Monitor your own booking lead times against these Oria averages to identify opportunities for dynamic pricing adjustments.
Popular & Essential Airbnb Amenities in Oria (2025)
Amenity Prevalence
Amenity Insights for Oria
- Essential amenities in Oria that guests expect include: Kitchen, Wifi, Heating. Lacking these (any) could significantly impact bookings.
- Popular amenities like TV, Essentials, Stove are common but not universal. Offering these can provide a competitive edge.
Recommendations for Hosts
- Ensure your listing includes all essential amenities for Oria: Kitchen, Wifi, Heating.
- Consider adding popular differentiators like TV or Essentials to increase appeal.
- Highlight unique or less common amenities you offer (e.g., hot tub, dedicated workspace, EV charger) in your listing description and photos.
- Regularly check competitor amenities in Oria to stay competitive.
Oria Airbnb Guest Demographics & Profile Analysis (2025)
Guest Profile Summary for Oria
- The typical guest profile for Airbnb in Oria consists of a mix of domestic (56%) and international guests, often arriving from nearby Murcia, typically belonging to the Post-2000s (Gen Z/Alpha) group (50%), primarily speaking English or Spanish.
- Domestic travelers account for 56.3% of guests.
- Key international markets include Spain (56.3%) and United Kingdom (12.5%).
- Top languages spoken are English (35%) followed by Spanish (27.5%).
- A significant demographic segment is the Post-2000s (Gen Z/Alpha) group, representing 50% of guests.
Recommendations for Hosts
- Balance marketing efforts between domestic and international channels based on the guest mix.
- Tailor amenities and listing descriptions to appeal to the dominant Post-2000s (Gen Z/Alpha) demographic (e.g., highlight fast WiFi, smart home features, local guides).
- Highlight unique local experiences or amenities relevant to the primary guest profile.
- Consider seasonal promotions aligned with peak travel times for key origin markets.
Nearby Short-Term Rental Market Comparison
How does the Oria Airbnb market stack up against its neighbors? Compare key performance metrics like average monthly revenue, ADR, and occupancy rates in surrounding areas to understand the broader regional STR landscape.
| Market | Active Properties | Monthly Revenue | Daily Rate | Avg. Occupancy |
|---|---|---|---|---|
| Villa de Otura | 18 | $2,141 | $299.92 | 34% |
| Salobreña | 239 | $1,811 | $209.08 | 41% |
| Gójar | 12 | $1,797 | $196.27 | 35% |
| Frigiliana | 368 | $1,773 | $208.10 | 47% |
| Albuñuelas | 16 | $1,722 | $194.29 | 34% |
| Árchez | 22 | $1,672 | $247.88 | 40% |
| Canillas de Albaida | 31 | $1,633 | $268.78 | 38% |
| La Zubia | 54 | $1,621 | $191.33 | 34% |
| El Valle | 30 | $1,608 | $281.81 | 42% |
| Nerja | 1,884 | $1,603 | $173.41 | 46% |