Marbella Airbnb Market Analysis 2025: Short Term Rental Data & Vacation Rental Statistics in Andalusia, Spain
Is Airbnb profitable in Marbella in 2025? Explore comprehensive Airbnb analytics for Marbella, Andalusia, Spain to uncover income potential. This 2025 STR market report for Marbella, based on AirROI data from April 2024 to March 2025, reveals key trends in the bustling market of 4,981 active listings.
Whether you're considering an Airbnb investment in Marbella, optimizing your existing vacation rental, or exploring rental arbitrage opportunities, understanding the Marbella Airbnb data is crucial. Navigating the high regulation landscape is key to maximizing your short term rental income potential. Let's dive into the specifics.
Key Marbella Airbnb Performance Metrics Overview
Monthly Airbnb Revenue Variations & Income Potential in Marbella (2025)
Understanding the monthly revenue variations for Airbnb listings in Marbella is key to maximizing your short term rental income potential. Seasonality significantly impacts earnings. Our analysis, based on data from the past 12 months, shows that the peak revenue month for STRs in Marbella is typically August, while February often presents the lowest earnings, highlighting opportunities for strategic pricing adjustments during shoulder and low seasons. Explore the typical Airbnb income in Marbella across different performance tiers:
- Best-in-class properties (Top 10%) achieve $8,345+ monthly, often utilizing dynamic pricing and superior guest experiences.
- Strong performing properties (Top 25%) earn $4,812 or more, indicating effective management and desirable locations/amenities.
- Typical properties (Median) generate around $2,718 per month, representing the average market performance.
- Entry-level properties (Bottom 25%) see earnings around $1,383, often with potential for optimization.
Average Monthly Airbnb Earnings Trend in Marbella
Marbella Airbnb Occupancy Rate Trends (2025)
Maximize your bookings by understanding the Marbella STR occupancy trends. Seasonal demand shifts significantly influence how often properties are booked. Typically, Augustsees the highest demand (peak season occupancy), while December experiences the lowest (low season). Effective strategies, like adjusting minimum stays or offering promotions, can boost occupancy during slower periods. Here's how different property tiers perform in Marbella:
- Best-in-class properties (Top 10%) achieve 81%+ occupancy, indicating high desirability and potentially optimized availability.
- Strong performing properties (Top 25%) maintain 63% or higher occupancy, suggesting good market fit and guest satisfaction.
- Typical properties (Median) have an occupancy rate around 40%.
- Entry-level properties (Bottom 25%) average 20% occupancy, potentially facing higher vacancy.
Average Monthly Occupancy Rate Trend in Marbella
Average Daily Rate (ADR) Airbnb Trends in Marbella (2025)
Effective short term rental pricing strategy in Marbella involves understanding monthly ADR fluctuations. The Average Daily Rate (ADR) for Airbnb in Marbella typically peaks in August and dips lowest during February. Leveraging Airbnb dynamic pricing tools or strategies based on this seasonality can significantly boost revenue. Here's a look at the typical nightly rates achieved:
- Best-in-class properties (Top 10%) command rates of $688+ per night, often due to premium features or locations.
- Strong performing properties (Top 25%) achieve nightly rates of $339 or more.
- Typical properties (Median) charge around $205 per night.
- Entry-level properties (Bottom 25%) earn around $140 per night.
Average Daily Rate (ADR) Trend by Month in Marbella
Get Live Marbella Market Intelligence 👇

Explore Real-time Analytics
Airbnb Seasonality Analysis & Trends in Marbella (2025)
Peak Season (August, July, June)
- Revenue averages $6,357 per month
- Occupancy rates average 54.8%
- Daily rates average $394
Shoulder Season
- Revenue averages $3,769 per month
- Occupancy maintains around 40.7%
- Daily rates hold near $334
Low Season (January, February, March)
- Revenue drops to average $2,206 per month
- Occupancy decreases to average 34.0%
- Daily rates adjust to average $278
Seasonality Insights for Marbella
- The Airbnb seasonality in Marbella shows highly seasonal trends requiring careful strategy. While the sections above show seasonal averages, it's also insightful to look at the extremes:
- During the high season, the absolute peak month showcases Marbella's highest earning potential, with monthly revenues capable of climbing to $7,094, occupancy reaching a high of 63.8%, and ADRs peaking at $403.
- Conversely, the slowest single month of the year, typically falling within the low season, marks the market's lowest point. In this month, revenue might dip to $2,181, occupancy could drop to 31.3%, and ADRs may adjust down to $275.
- Understanding both the seasonal averages and these monthly peaks and troughs in revenue, occupancy, and ADR is crucial for maximizing your Airbnb profit potential in Marbella.
Seasonal Strategies for Maximizing Profit
- Peak Season: Maximize revenue through premium pricing and potentially longer minimum stays. Ensure high availability.
- Low Season: Offer competitive pricing, special promotions (e.g., extended stay discounts), and flexible cancellation policies. Target off-season travelers like remote workers or budget-conscious guests.
- Shoulder Seasons: Implement dynamic pricing that balances peak and low rates. Target weekend travelers or specific events. Offer slightly more flexible terms than peak season.
- Regularly analyze your own performance against these Marbella seasonality benchmarks and adjust your pricing and availability strategy accordingly.
Best Areas for Airbnb Investment in Marbella (2025)
Exploring the top neighborhoods for short-term rentals in Marbella? This section highlights key areas, outlining why they are attractive for hosts and guests, along with notable local attractions. Consider these locations based on your target guest profile and investment strategy.
| Neighborhood / Area | Why Host Here? (Target Guests & Appeal) | Key Attractions & Landmarks |
|---|---|---|
| Old Town | Charming historic area with narrow streets and vibrant squares, perfect for tourists seeking culture and history. Offers a mix of traditional Andalusian architecture and modern amenities. | Plaza de los Naranjos, Marbella Castle, Museo del Grabado Español Contemporáneo, Iglesia de la Encarnación, Historic San Bernando Monastery |
| Golden Mile | Exclusive beachfront area known for luxury resorts and prestigious properties. Ideal for high-end travelers looking for comfort, privacy, and stunning ocean views. | Marbella Casino, Puerto Banús, Beach Clubs, Chiringuitos, Luxury Boutiques |
| Puerto Banús | Famous marina filled with luxury yachts, shopping, and nightlife. Popular among affluent tourists and those looking to experience the glamorous side of Marbella. | Luxury boutiques, Nightclubs, Fine dining restaurants, Café del Mar, Ocean Club Marbella |
| San Pedro de Alcántara | Authentic Andalusian town with beautiful beaches and a relaxed atmosphere. Attracts families and tourists seeking a more local experience without losing access to amenities. | San Pedro Beach, Boulevard San Pedro, Church of San Pedro, Local tapas bars, La Salida Beach Club |
| East Marbella | Quieter beaches with a laid-back vibe, featuring residential areas and natural beauty. Perfect for families and those looking to escape the hustle and bustle. | La Cabane Beach Club, Marbella Golf & Country Club, Funny Beach, Cabo Pino Marina, Elviria |
| La Alberta | A scenic residential neighborhood close to essential services. Offers tranquility with proximity to the beach, great for family-friendly vacations. | Playa de la Alberta, Local parks, Supermarkets, Restaurants, Nearby golf courses |
| Las Chapas | Known for its luxury villas and proximity to the beach. Attractive for tourists seeking a semi-rural lifestyle with modern conveniences. | Playa de Las Chapas, Villas with ocean views, Local beach bars, Golf courses, Wildlife nature reserves |
| Centro Comercial La Cañada | Commercial center with shopping, dining, and entertainment options. Convenient for tourists who want easy access to amenities during their stay. | La Cañada Shopping Center, Cinemas, Family entertainment areas, Nearby restaurants, Shopping outlets |
Understanding Airbnb License Requirements & STR Laws in Marbella (2025)
Yes, Marbella, Andalusia, Spain enforces high STR regulations. Obtaining a license and ensuring compliance is almost certainly required according to current 2025 STR laws. Always verify the latest short term rental regulations and Airbnb license requirements directly with local government authorities for Marbella to ensure full compliance before hosting.
(Source: AirROI data, 2025, based on 74% licensed listings)
Top Performing Airbnb Properties in Marbella (2025)
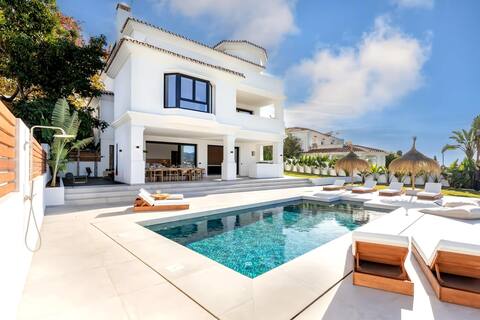
Benchmark your potential! Explore examples of top-performing Airbnb properties in Marbellabased on Trailing Twelve Month (TTM) revenue. Analyze their characteristics, revenue, occupancy rate, and ADR to understand what drives success in this market.

Vacation Marbella Villa I Heated Pool I Luxury Gem
Entire Place • 5 bedrooms
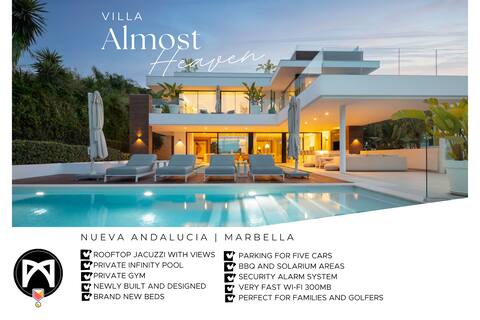
Villa Vega | Luxury Living Premium Features Gym Ja
Entire Place • 7 bedrooms
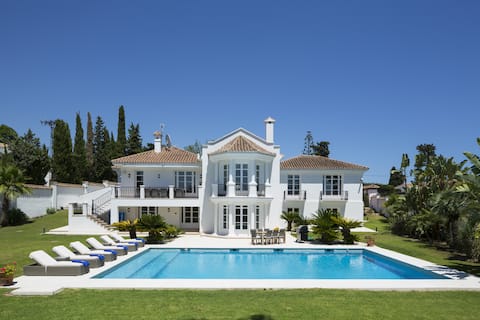
Vacation Marbella Villa I Luxury, Golf, Edge Pool,
Entire Place • 5 bedrooms

Superb Large Apartment on the Beach
Entire Place • 4 bedrooms
Marbella's Finest
Entire Place • 6 bedrooms

Luxury Sea View Villa in Marbella
Entire Place • 7 bedrooms
Note: Performance varies based on location, size, amenities, seasonality, and management quality. Data reflects the past 12 months.
Top Performing Airbnb Hosts in Marbella (2025)
Learn from the best! This table showcases top-performing Airbnb hosts in Marbella based on the number of properties managed and estimated total revenue over the past year. Analyze their scale and performance metrics.
| Host Name | Properties | Grossing Revenue | Stay Reviews | Avg Rating |
|---|---|---|---|---|
| Vacation Marbella | 44 | $3,798,514 | 587 | 4.38/5.0 |
| Finest Rentals | 34 | $2,937,032 | 722 | 4.29/5.0 |
| Banus | 60 | $2,324,757 | 605 | 4.09/5.0 |
| RNTLS Marbella | 31 | $2,133,938 | 882 | 4.24/5.0 |
| Marbella Banus Suites | 38 | $2,077,384 | 600 | 4.78/5.0 |
| JustRent Marbella | 56 | $2,027,175 | 280 | 2.84/5.0 |
| Eva From Lirios Village | 7 | $1,634,323 | 339 | 4.75/5.0 |
| Stayhost | 58 | $1,545,193 | 652 | 3.38/5.0 |
| Oliver - Interhome | 54 | $1,516,964 | 514 | 3.27/5.0 |
| Roomservices Holiday Homes | 58 | $1,503,202 | 545 | 3.20/5.0 |
Analyzing the strategies of top hosts, such as their property selection, pricing, and guest communication, can offer valuable lessons for optimizing your own Airbnb operations in Marbella.
Dive Deeper: Advanced Marbella STR Market Data (2025)
Ready to unlock more insights? AirROI provides access to advanced metrics and comprehensive Airbnb data for Marbella. Explore detailed analytics beyond this report to refine your investment strategy, optimize pricing, and maximize your vacation rental profits.
Explore Advanced MetricsMarbella Short-Term Rental Market Composition (2025): Property & Room Types
Room Type Distribution
Property Type Distribution
Market Composition Insights for Marbella
- The Marbella Airbnb market composition is heavily skewed towards Entire Home/Apt listings, which make up 96.5% of the 4,981 active rentals. This indicates strong guest preference for privacy and space.
- Looking at the property type distribution in Marbella, Apartment/Condo properties are the most common (74.9%), reflecting the local real estate landscape.
- Houses represent a significant 23.6% portion, catering likely to families or larger groups.
- Smaller segments like hotel/boutique, others, outdoor/unique, unique stays (combined 1.6%) offer potential for unique stay experiences.
Marbella Airbnb Room Capacity Analysis (2025): Bedroom Distribution
Distribution of Listings by Number of Bedrooms
Room Capacity Insights for Marbella
- The dominant room capacity in Marbella is 2 bedrooms listings, making up 38.2% of the market. This suggests a strong demand for properties suitable for couples or solo travelers.
- Together, 2 bedrooms and 3 bedrooms properties represent 60.3% of the active Airbnb listings in Marbella, indicating a high concentration in these sizes.
- A significant 37.5% of listings offer 3+ bedrooms, catering to larger groups and families seeking more space in Marbella.
Marbella Vacation Rental Guest Capacity Trends (2025)
Distribution of Listings by Guest Capacity
Guest Capacity Insights for Marbella
- The most common guest capacity trend in Marbella vacation rentals is listings accommodating 4 guests (35.3%). This suggests the primary traveler segment is likely small families or groups.
- Properties designed for 4 guests and 6 guests dominate the Marbella STR market, accounting for 58.5% of listings.
- 41.1% of properties accommodate 6+ guests, serving the market segment for larger families or group travel in Marbella.
- On average, properties in Marbella are equipped to host 4.9 guests.
Marbella Airbnb Booking Patterns (2025): Available vs. Booked Days
Available Days Distribution
Booked Days Distribution
Booking Pattern Insights for Marbella
- The most common availability pattern in Marbella falls within the 271-366 days range, representing 50.4% of listings. This suggests many properties have significant open periods on their calendars.
- Approximately 80.6% of listings show high availability (181+ days open annually), indicating potential for increased bookings or specific owner usage patterns.
- For booked days, the 91-180 days range is most frequent in Marbella (30.6%), reflecting common guest stay durations or potential owner blocking patterns.
- A notable 20.4% of properties secure long booking periods (181+ days booked per year), highlighting successful long-term rental strategies or significant owner usage.
Marbella Airbnb Minimum Stay Requirements Analysis
Distribution of Listings by Minimum Night Requirement
1 Night
395 listings
8.5% of total
2 Nights
544 listings
11.7% of total
3 Nights
812 listings
17.5% of total
4-6 Nights
1550 listings
33.3% of total
7-29 Nights
464 listings
10% of total
30+ Nights
884 listings
19% of total
Key Insights
- The most prevalent minimum stay requirement in Marbella is 4-6 Nights, adopted by 33.3% of listings. This highlights the market's preference for longer commitments.
- A significant segment (19%) caters to monthly stays (30+ nights) in Marbella, pointing to opportunities in the extended-stay market.
Recommendations
- Align with the market by considering a 4-6 Nights minimum stay, as 33.3% of Marbella hosts use this setting.
- If feasible, allowing 1-night stays, especially midweek or during low season, could capture last-minute bookings, as only 8.5% currently do.
- Explore offering discounts for stays of 30+ nights to attract the 19% of the market seeking extended stays.
- Adjust minimum nights based on seasonality – potentially shorter during low season and longer during peak demand periods in Marbella.
Marbella Airbnb Cancellation Policy Trends Analysis (2025)
Super Strict 60 Days
114 listings
3% of total
Super Strict 30 Days
230 listings
6.1% of total
Refundable
2 listings
0.1% of total
Flexible
362 listings
9.5% of total
Moderate
764 listings
20.1% of total
Firm
1031 listings
27.1% of total
Strict
1298 listings
34.1% of total
Cancellation Policy Insights for Marbella
- The prevailing Airbnb cancellation policy trend in Marbella is Strict, used by 34.1% of listings.
- A majority (61.2%) of hosts in Marbella utilize Firm or Strict policies, indicating a market where hosts prioritize booking security.
Recommendations for Hosts
- Consider adopting a Strict policy to align with the 34.1% market standard in Marbella.
- With 34.1% using Strict terms, this is a viable option in Marbella, particularly for high-value properties or during peak demand periods.
- Regularly review your cancellation policy against competitors and market demand shifts in Marbella.
Marbella STR Booking Lead Time Analysis (2025)
Average Booking Lead Time by Month
Booking Lead Time Insights for Marbella
- The overall average booking lead time for vacation rentals in Marbella is 62 days.
- Guests book furthest in advance for stays during July (average 96 days), likely coinciding with peak travel demand or local events.
- The shortest booking windows occur for stays in March (average 51 days), indicating more last-minute travel plans during this time.
- Seasonally, Summer (88 days avg.) sees the longest lead times, while Winter (55 days avg.) has the shortest, reflecting typical travel planning cycles.
Recommendations for Hosts
- Use the overall average lead time (62 days) as a baseline for your pricing and availability strategy in Marbella.
- For July stays, consider implementing length-of-stay discounts or slightly higher rates for bookings made less than 96 days out to capitalize on advance planning.
- Target marketing efforts for the Summer season well in advance (at least 88 days) to capture early planners.
- Monitor your own booking lead times against these Marbella averages to identify opportunities for dynamic pricing adjustments.
Popular & Essential Airbnb Amenities in Marbella (2025)
Amenity Prevalence
Amenity Insights for Marbella
- Essential amenities in Marbella that guests expect include: Wifi, TV, Kitchen, Washer, Air conditioning. Lacking these (any) could significantly impact bookings.
- Popular amenities like Heating, Hot water, Essentials are common but not universal. Offering these can provide a competitive edge.
Recommendations for Hosts
- Ensure your listing includes all essential amenities for Marbella: Wifi, TV, Kitchen, Washer, Air conditioning.
- Prioritize adding missing essentials: Wifi, TV, Kitchen, Washer, Air conditioning.
- Consider adding popular differentiators like Heating or Hot water to increase appeal.
- Highlight unique or less common amenities you offer (e.g., hot tub, dedicated workspace, EV charger) in your listing description and photos.
- Regularly check competitor amenities in Marbella to stay competitive.
Marbella Airbnb Guest Demographics & Profile Analysis (2025)
Guest Profile Summary for Marbella
- The typical guest profile for Airbnb in Marbella consists of predominantly international visitors (90%), with top international origins including Spain, typically belonging to the Post-2000s (Gen Z/Alpha) group (50%), primarily speaking English or Spanish.
- Domestic travelers account for 9.9% of guests.
- Key international markets include United Kingdom (25.4%) and Spain (9.9%).
- Top languages spoken are English (41.8%) followed by Spanish (13.6%).
- A significant demographic segment is the Post-2000s (Gen Z/Alpha) group, representing 50% of guests.
Recommendations for Hosts
- Focus marketing internationally, particularly towards travelers from Spain.
- Tailor amenities and listing descriptions to appeal to the dominant Post-2000s (Gen Z/Alpha) demographic (e.g., highlight fast WiFi, smart home features, local guides).
- Highlight unique local experiences or amenities relevant to the primary guest profile.
- Consider seasonal promotions aligned with peak travel times for key origin markets.
Nearby Short-Term Rental Market Comparison
How does the Marbella Airbnb market stack up against its neighbors? Compare key performance metrics like average monthly revenue, ADR, and occupancy rates in surrounding areas to understand the broader regional STR landscape.
| Market | Active Properties | Monthly Revenue | Daily Rate | Avg. Occupancy |
|---|---|---|---|---|
| Alhaurín de la Torre | 203 | $3,368 | $287.14 | 47% |
| Benahavís | 492 | $3,047 | $494.00 | 40% |
| Alhaurín el Grande | 281 | $3,026 | $290.27 | 45% |
| Cártama | 56 | $2,829 | $300.39 | 43% |
| Málaga | 7,038 | $2,217 | $162.86 | 54% |
| Coín | 113 | $2,208 | $261.43 | 43% |
| San Roque | 334 | $2,207 | $325.49 | 40% |
| Seville | 6,518 | $2,195 | $155.35 | 51% |
| Moclinejo | 10 | $2,155 | $231.35 | 51% |
| Villa de Otura | 18 | $2,141 | $299.92 | 34% |