Lucena Airbnb Market Analysis 2025: Short Term Rental Data & Vacation Rental Statistics in Andalusia, Spain
Is Airbnb profitable in Lucena in 2025? Explore comprehensive Airbnb analytics for Lucena, Andalusia, Spain to uncover income potential. This 2025 STR market report for Lucena, based on AirROI data from April 2024 to March 2025, reveals key trends in the niche market of 36 active listings.
Whether you're considering an Airbnb investment in Lucena, optimizing your existing vacation rental, or exploring rental arbitrage opportunities, understanding the Lucena Airbnb data is crucial. Navigating the high regulation landscape is key to maximizing your short term rental income potential. Let's dive into the specifics.
Key Lucena Airbnb Performance Metrics Overview
Monthly Airbnb Revenue Variations & Income Potential in Lucena (2025)
Understanding the monthly revenue variations for Airbnb listings in Lucena is key to maximizing your short term rental income potential. Seasonality significantly impacts earnings. Our analysis, based on data from the past 12 months, shows that the peak revenue month for STRs in Lucena is typically August, while February often presents the lowest earnings, highlighting opportunities for strategic pricing adjustments during shoulder and low seasons. Explore the typical Airbnb income in Lucena across different performance tiers:
- Best-in-class properties (Top 10%) achieve $2,308+ monthly, often utilizing dynamic pricing and superior guest experiences.
- Strong performing properties (Top 25%) earn $1,653 or more, indicating effective management and desirable locations/amenities.
- Typical properties (Median) generate around $940 per month, representing the average market performance.
- Entry-level properties (Bottom 25%) see earnings around $465, often with potential for optimization.
Average Monthly Airbnb Earnings Trend in Lucena
Lucena Airbnb Occupancy Rate Trends (2025)
Maximize your bookings by understanding the Lucena STR occupancy trends. Seasonal demand shifts significantly influence how often properties are booked. Typically, Augustsees the highest demand (peak season occupancy), while January experiences the lowest (low season). Effective strategies, like adjusting minimum stays or offering promotions, can boost occupancy during slower periods. Here's how different property tiers perform in Lucena:
- Best-in-class properties (Top 10%) achieve 65%+ occupancy, indicating high desirability and potentially optimized availability.
- Strong performing properties (Top 25%) maintain 51% or higher occupancy, suggesting good market fit and guest satisfaction.
- Typical properties (Median) have an occupancy rate around 33%.
- Entry-level properties (Bottom 25%) average 16% occupancy, potentially facing higher vacancy.
Average Monthly Occupancy Rate Trend in Lucena
Average Daily Rate (ADR) Airbnb Trends in Lucena (2025)
Effective short term rental pricing strategy in Lucena involves understanding monthly ADR fluctuations. The Average Daily Rate (ADR) for Airbnb in Lucena typically peaks in December and dips lowest during August. Leveraging Airbnb dynamic pricing tools or strategies based on this seasonality can significantly boost revenue. Here's a look at the typical nightly rates achieved:
- Best-in-class properties (Top 10%) command rates of $211+ per night, often due to premium features or locations.
- Strong performing properties (Top 25%) achieve nightly rates of $106 or more.
- Typical properties (Median) charge around $81 per night.
- Entry-level properties (Bottom 25%) earn around $64 per night.
Average Daily Rate (ADR) Trend by Month in Lucena
Get Live Lucena Market Intelligence 👇

Explore Real-time Analytics
Airbnb Seasonality Analysis & Trends in Lucena (2025)
Peak Season (August, July, September)
- Revenue averages $1,525 per month
- Occupancy rates average 45.4%
- Daily rates average $108
Shoulder Season
- Revenue averages $1,230 per month
- Occupancy maintains around 35.1%
- Daily rates hold near $110
Low Season (January, February, March)
- Revenue drops to average $795 per month
- Occupancy decreases to average 26.9%
- Daily rates adjust to average $107
Seasonality Insights for Lucena
- The Airbnb seasonality in Lucena shows highly seasonal trends requiring careful strategy. While the sections above show seasonal averages, it's also insightful to look at the extremes:
- During the high season, the absolute peak month showcases Lucena's highest earning potential, with monthly revenues capable of climbing to $1,634, occupancy reaching a high of 52.2%, and ADRs peaking at $113.
- Conversely, the slowest single month of the year, typically falling within the low season, marks the market's lowest point. In this month, revenue might dip to $754, occupancy could drop to 25.7%, and ADRs may adjust down to $106.
- Understanding both the seasonal averages and these monthly peaks and troughs in revenue, occupancy, and ADR is crucial for maximizing your Airbnb profit potential in Lucena.
Seasonal Strategies for Maximizing Profit
- Peak Season: Maximize revenue through premium pricing and potentially longer minimum stays. Ensure high availability.
- Low Season: Offer competitive pricing, special promotions (e.g., extended stay discounts), and flexible cancellation policies. Target off-season travelers like remote workers or budget-conscious guests.
- Shoulder Seasons: Implement dynamic pricing that balances peak and low rates. Target weekend travelers or specific events. Offer slightly more flexible terms than peak season.
- Regularly analyze your own performance against these Lucena seasonality benchmarks and adjust your pricing and availability strategy accordingly.
Best Areas for Airbnb Investment in Lucena (2025)
Exploring the top neighborhoods for short-term rentals in Lucena? This section highlights key areas, outlining why they are attractive for hosts and guests, along with notable local attractions. Consider these locations based on your target guest profile and investment strategy.
| Neighborhood / Area | Why Host Here? (Target Guests & Appeal) | Key Attractions & Landmarks |
|---|---|---|
| Historic Center | Lucena's historic center features beautiful architecture and a rich cultural heritage. It's a magnet for tourists looking to explore local history and cuisine. | Iglesia de San Juan Bautista, Castillo del Moral, Palacio de los Condes de Santa Ana, Plaza Nueva, Museum of Sacred Art |
| Parque de la Fuentenueva | A scenic park area that provides a relaxing atmosphere with nature and open spaces, attracting families and tourists seeking leisure activities. | Fuentenueva Park, playgrounds, picnic areas, walking paths, local festivals |
| El Mercado | This vibrant marketplace area hosts numerous shops, restaurants, and local food vendors, appealing to foodies and shoppers. | Mercado de Abastos, local delicacies, cultural events, artisan goods, souvenirs |
| Cerro de las Campanas | This area offers breathtaking views of the city and surrounding countryside, popular for hiking and outdoor activities. | Hiking trails, viewpoints, natural parks, scenic lookout, outdoor events |
| San Miguel | A lively neighborhood with a mix of residential and tourist-friendly amenities, perfect for visitors wanting a more local experience. | local bars, restaurants, community events, art galleries, shopping options |
| La Loma | A quiet residential area that is increasingly popular for vacation rentals due to its affordability and proximity to other attractions. | local eateries, parks, family-friendly atmosphere, art shops, community centers |
| El Gilo | Known for its modern conveniences and local charm, this area appeals to a younger crowd seeking a trendy atmosphere. | cafes, boutique shops, nightlife, cultural gatherings, public transport connections |
| Avenida de la Libertad | A major thoroughfare with various entertainment options, shopping, and dining, making it a prime area for short-term rentals. | shopping centers, restaurants, cinemas, cultural sites, accessible transport |
Understanding Airbnb License Requirements & STR Laws in Lucena (2025)
Yes, Lucena, Andalusia, Spain enforces high STR regulations. Obtaining a license and ensuring compliance is almost certainly required according to current 2025 STR laws. Always verify the latest short term rental regulations and Airbnb license requirements directly with local government authorities for Lucena to ensure full compliance before hosting.
(Source: AirROI data, 2025, based on 81% licensed listings)
Top Performing Airbnb Properties in Lucena (2025)
Benchmark your potential! Explore examples of top-performing Airbnb properties in Lucenabased on Trailing Twelve Month (TTM) revenue. Analyze their characteristics, revenue, occupancy rate, and ADR to understand what drives success in this market.
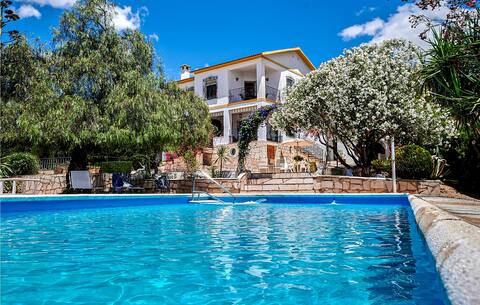
Amazing home in Lucena with outdoor swimming pool
Entire Place • 6 bedrooms

Apartment Quintana Center
Entire Place • 3 bedrooms

Casa la perla de sefarad
Entire Place • 4 bedrooms

Apartment El Llano Center
Entire Place • 3 bedrooms

Apartment Palacio De Los Vibora
Entire Place • 3 bedrooms

Pet friendly home in Lucena with kitchenette
Entire Place • 7 bedrooms
Note: Performance varies based on location, size, amenities, seasonality, and management quality. Data reflects the past 12 months.
Top Performing Airbnb Hosts in Lucena (2025)
Learn from the best! This table showcases top-performing Airbnb hosts in Lucena based on the number of properties managed and estimated total revenue over the past year. Analyze their scale and performance metrics.
| Host Name | Properties | Grossing Revenue | Stay Reviews | Avg Rating |
|---|---|---|---|---|
| Susana Calzado Perez | 7 | $128,200 | 255 | 4.80/5.0 |
| Novasol | 1 | $43,882 | 9 | 4.44/5.0 |
| Inma | 1 | $22,082 | 10 | 4.90/5.0 |
| Novasol | 1 | $19,152 | 4 | 4.75/5.0 |
| José Carlos | 1 | $17,696 | 6 | 5.00/5.0 |
| Fuensanta | 1 | $17,204 | 50 | 4.98/5.0 |
| Miguel | 2 | $16,572 | 27 | 4.68/5.0 |
| Host #128743322 | 1 | $15,662 | 0 | 0.00/5.0 |
| Host #9823628 | 1 | $15,465 | 0 | 0.00/5.0 |
| Aurora | 2 | $13,994 | 148 | 4.79/5.0 |
Analyzing the strategies of top hosts, such as their property selection, pricing, and guest communication, can offer valuable lessons for optimizing your own Airbnb operations in Lucena.
Dive Deeper: Advanced Lucena STR Market Data (2025)
Ready to unlock more insights? AirROI provides access to advanced metrics and comprehensive Airbnb data for Lucena. Explore detailed analytics beyond this report to refine your investment strategy, optimize pricing, and maximize your vacation rental profits.
Explore Advanced MetricsLucena Short-Term Rental Market Composition (2025): Property & Room Types
Room Type Distribution
Property Type Distribution
Market Composition Insights for Lucena
- The Lucena Airbnb market composition is heavily skewed towards Entire Home/Apt listings, which make up 88.9% of the 36 active rentals. This indicates strong guest preference for privacy and space.
- Looking at the property type distribution in Lucena, Apartment/Condo properties are the most common (66.7%), reflecting the local real estate landscape.
- Houses represent a significant 30.6% portion, catering likely to families or larger groups.
- Smaller segments like hotel/boutique (combined 2.8%) offer potential for unique stay experiences.
Lucena Airbnb Room Capacity Analysis (2025): Bedroom Distribution
Distribution of Listings by Number of Bedrooms
Room Capacity Insights for Lucena
- The dominant room capacity in Lucena is 2 bedrooms listings, making up 30.6% of the market. This suggests a strong demand for properties suitable for couples or solo travelers.
- Together, 2 bedrooms and 3 bedrooms properties represent 58.4% of the active Airbnb listings in Lucena, indicating a high concentration in these sizes.
- A significant 44.5% of listings offer 3+ bedrooms, catering to larger groups and families seeking more space in Lucena.
Lucena Vacation Rental Guest Capacity Trends (2025)
Distribution of Listings by Guest Capacity
Guest Capacity Insights for Lucena
- The most common guest capacity trend in Lucena vacation rentals is listings accommodating 5 guests (25%). This suggests the primary traveler segment is likely larger groups.
- Properties designed for 5 guests and 8+ guests dominate the Lucena STR market, accounting for 44.4% of listings.
- 33.3% of properties accommodate 6+ guests, serving the market segment for larger families or group travel in Lucena.
- On average, properties in Lucena are equipped to host 4.7 guests.
Lucena Airbnb Booking Patterns (2025): Available vs. Booked Days
Available Days Distribution
Booked Days Distribution
Booking Pattern Insights for Lucena
- The most common availability pattern in Lucena falls within the 271-366 days range, representing 44.4% of listings. This suggests many properties have significant open periods on their calendars.
- Approximately 80.5% of listings show high availability (181+ days open annually), indicating potential for increased bookings or specific owner usage patterns.
- For booked days, the 91-180 days range is most frequent in Lucena (36.1%), reflecting common guest stay durations or potential owner blocking patterns.
- A notable 22.2% of properties secure long booking periods (181+ days booked per year), highlighting successful long-term rental strategies or significant owner usage.
Lucena Airbnb Minimum Stay Requirements Analysis
Distribution of Listings by Minimum Night Requirement
1 Night
16 listings
45.7% of total
2 Nights
12 listings
34.3% of total
3 Nights
1 listings
2.9% of total
30+ Nights
6 listings
17.1% of total
Key Insights
- The most prevalent minimum stay requirement in Lucena is 1 Night, adopted by 45.7% of listings. This highlights the market's preference for shorter, flexible bookings.
- A strong majority (80.0%) of the Lucena Airbnb data shows acceptance of very short stays (1-2 nights), indicating a dynamic, high-turnover market.
- A significant segment (17.1%) caters to monthly stays (30+ nights) in Lucena, pointing to opportunities in the extended-stay market.
Recommendations
- Align with the market by considering a 1 Night minimum stay, as 45.7% of Lucena hosts use this setting.
- Explore offering discounts for stays of 30+ nights to attract the 17.1% of the market seeking extended stays.
- Adjust minimum nights based on seasonality – potentially shorter during low season and longer during peak demand periods in Lucena.
Lucena Airbnb Cancellation Policy Trends Analysis (2025)
Super Strict 60 Days
2 listings
6.9% of total
Flexible
9 listings
31% of total
Moderate
7 listings
24.1% of total
Firm
8 listings
27.6% of total
Strict
3 listings
10.3% of total
Cancellation Policy Insights for Lucena
- The prevailing Airbnb cancellation policy trend in Lucena is Flexible, used by 31% of listings.
- There's a relatively balanced mix between guest-friendly (55.1%) and stricter (37.9%) policies, offering choices for different guest needs.
Recommendations for Hosts
- Consider adopting a Flexible policy to align with the 31% market standard in Lucena.
- Using a Strict policy might deter some guests, as only 10.3% of listings use it. Evaluate if potential revenue protection outweighs possible lower booking rates.
- Regularly review your cancellation policy against competitors and market demand shifts in Lucena.
Lucena STR Booking Lead Time Analysis (2025)
Average Booking Lead Time by Month
Booking Lead Time Insights for Lucena
- The overall average booking lead time for vacation rentals in Lucena is 46 days.
- Guests book furthest in advance for stays during October (average 70 days), likely coinciding with peak travel demand or local events.
- The shortest booking windows occur for stays in February (average 26 days), indicating more last-minute travel plans during this time.
- Seasonally, Summer (62 days avg.) sees the longest lead times, while Winter (29 days avg.) has the shortest, reflecting typical travel planning cycles.
Recommendations for Hosts
- Use the overall average lead time (46 days) as a baseline for your pricing and availability strategy in Lucena.
- For October stays, consider implementing length-of-stay discounts or slightly higher rates for bookings made less than 70 days out to capitalize on advance planning.
- Target marketing efforts for the Summer season well in advance (at least 62 days) to capture early planners.
- Monitor your own booking lead times against these Lucena averages to identify opportunities for dynamic pricing adjustments.
Popular & Essential Airbnb Amenities in Lucena (2025)
Amenity Prevalence
Amenity Insights for Lucena
- Essential amenities in Lucena that guests expect include: TV. Lacking these (this) could significantly impact bookings.
- Popular amenities like Washer, Kitchen, Air conditioning are common but not universal. Offering these can provide a competitive edge.
- Warning: Wifi is not universally provided but is considered essential globally. Ensure reliable Wifi is offered.
Recommendations for Hosts
- Ensure your listing includes all essential amenities for Lucena: TV.
- Prioritize adding missing essentials: TV.
- Consider adding popular differentiators like Washer or Kitchen to increase appeal.
- Highlight unique or less common amenities you offer (e.g., hot tub, dedicated workspace, EV charger) in your listing description and photos.
- Regularly check competitor amenities in Lucena to stay competitive.
Lucena Airbnb Guest Demographics & Profile Analysis (2025)
Guest Profile Summary for Lucena
- The typical guest profile for Airbnb in Lucena consists of a mix of domestic (54%) and international guests, often arriving from nearby Seville, typically belonging to the Post-2000s (Gen Z/Alpha) group (50%), primarily speaking English or Spanish.
- Domestic travelers account for 53.7% of guests.
- Key international markets include Spain (53.7%) and France (15.2%).
- Top languages spoken are English (29.2%) followed by Spanish (27.6%).
- A significant demographic segment is the Post-2000s (Gen Z/Alpha) group, representing 50% of guests.
Recommendations for Hosts
- Balance marketing efforts between domestic and international channels based on the guest mix.
- Tailor amenities and listing descriptions to appeal to the dominant Post-2000s (Gen Z/Alpha) demographic (e.g., highlight fast WiFi, smart home features, local guides).
- Highlight unique local experiences or amenities relevant to the primary guest profile.
- Consider seasonal promotions aligned with peak travel times for key origin markets.
Nearby Short-Term Rental Market Comparison
How does the Lucena Airbnb market stack up against its neighbors? Compare key performance metrics like average monthly revenue, ADR, and occupancy rates in surrounding areas to understand the broader regional STR landscape.
| Market | Active Properties | Monthly Revenue | Daily Rate | Avg. Occupancy |
|---|---|---|---|---|
| Alhaurín de la Torre | 203 | $3,368 | $287.14 | 47% |
| Benahavís | 492 | $3,047 | $494.00 | 40% |
| Alhaurín el Grande | 281 | $3,026 | $290.27 | 45% |
| Cártama | 56 | $2,829 | $300.39 | 43% |
| Marbella | 4,981 | $2,613 | $321.31 | 43% |
| Málaga | 7,038 | $2,217 | $162.86 | 54% |
| Coín | 113 | $2,208 | $261.43 | 43% |
| San Roque | 334 | $2,207 | $325.49 | 40% |
| Seville | 6,518 | $2,195 | $155.35 | 51% |
| Moclinejo | 10 | $2,155 | $231.35 | 51% |