El Pinar Airbnb Market Analysis 2025: Short Term Rental Data & Vacation Rental Statistics in Andalusia, Spain
Is Airbnb profitable in El Pinar in 2025? Explore comprehensive Airbnb analytics for El Pinar, Andalusia, Spain to uncover income potential. This 2025 STR market report for El Pinar, based on AirROI data from April 2024 to March 2025, reveals key trends in the niche market of 30 active listings.
Whether you're considering an Airbnb investment in El Pinar, optimizing your existing vacation rental, or exploring rental arbitrage opportunities, understanding the El Pinar Airbnb data is crucial. Navigating the high regulation landscape is key to maximizing your short term rental income potential. Let's dive into the specifics.
Key El Pinar Airbnb Performance Metrics Overview
Monthly Airbnb Revenue Variations & Income Potential in El Pinar (2025)
Understanding the monthly revenue variations for Airbnb listings in El Pinar is key to maximizing your short term rental income potential. Seasonality significantly impacts earnings. Our analysis, based on data from the past 12 months, shows that the peak revenue month for STRs in El Pinar is typically July, while February often presents the lowest earnings, highlighting opportunities for strategic pricing adjustments during shoulder and low seasons. Explore the typical Airbnb income in El Pinar across different performance tiers:
- Best-in-class properties (Top 10%) achieve $3,455+ monthly, often utilizing dynamic pricing and superior guest experiences.
- Strong performing properties (Top 25%) earn $1,942 or more, indicating effective management and desirable locations/amenities.
- Typical properties (Median) generate around $1,024 per month, representing the average market performance.
- Entry-level properties (Bottom 25%) see earnings around $495, often with potential for optimization.
Average Monthly Airbnb Earnings Trend in El Pinar
El Pinar Airbnb Occupancy Rate Trends (2025)
Maximize your bookings by understanding the El Pinar STR occupancy trends. Seasonal demand shifts significantly influence how often properties are booked. Typically, Augustsees the highest demand (peak season occupancy), while March experiences the lowest (low season). Effective strategies, like adjusting minimum stays or offering promotions, can boost occupancy during slower periods. Here's how different property tiers perform in El Pinar:
- Best-in-class properties (Top 10%) achieve 64%+ occupancy, indicating high desirability and potentially optimized availability.
- Strong performing properties (Top 25%) maintain 44% or higher occupancy, suggesting good market fit and guest satisfaction.
- Typical properties (Median) have an occupancy rate around 26%.
- Entry-level properties (Bottom 25%) average 13% occupancy, potentially facing higher vacancy.
Average Monthly Occupancy Rate Trend in El Pinar
Average Daily Rate (ADR) Airbnb Trends in El Pinar (2025)
Effective short term rental pricing strategy in El Pinar involves understanding monthly ADR fluctuations. The Average Daily Rate (ADR) for Airbnb in El Pinar typically peaks in July and dips lowest during March. Leveraging Airbnb dynamic pricing tools or strategies based on this seasonality can significantly boost revenue. Here's a look at the typical nightly rates achieved:
- Best-in-class properties (Top 10%) command rates of $274+ per night, often due to premium features or locations.
- Strong performing properties (Top 25%) achieve nightly rates of $174 or more.
- Typical properties (Median) charge around $100 per night.
- Entry-level properties (Bottom 25%) earn around $77 per night.
Average Daily Rate (ADR) Trend by Month in El Pinar
Get Live El Pinar Market Intelligence 👇

Explore Real-time Analytics
Airbnb Seasonality Analysis & Trends in El Pinar (2025)
Peak Season (July, May, August)
- Revenue averages $3,524 per month
- Occupancy rates average 42.8%
- Daily rates average $190
Shoulder Season
- Revenue averages $2,100 per month
- Occupancy maintains around 28.7%
- Daily rates hold near $178
Low Season (January, February, November)
- Revenue drops to average $1,214 per month
- Occupancy decreases to average 25.1%
- Daily rates adjust to average $165
Seasonality Insights for El Pinar
- The Airbnb seasonality in El Pinar shows highly seasonal trends requiring careful strategy. While the sections above show seasonal averages, it's also insightful to look at the extremes:
- During the high season, the absolute peak month showcases El Pinar's highest earning potential, with monthly revenues capable of climbing to $3,744, occupancy reaching a high of 49.5%, and ADRs peaking at $195.
- Conversely, the slowest single month of the year, typically falling within the low season, marks the market's lowest point. In this month, revenue might dip to $974, occupancy could drop to 21.9%, and ADRs may adjust down to $159.
- Understanding both the seasonal averages and these monthly peaks and troughs in revenue, occupancy, and ADR is crucial for maximizing your Airbnb profit potential in El Pinar.
Seasonal Strategies for Maximizing Profit
- Peak Season: Maximize revenue through premium pricing and potentially longer minimum stays. Ensure high availability.
- Low Season: Offer competitive pricing, special promotions (e.g., extended stay discounts), and flexible cancellation policies. Target off-season travelers like remote workers or budget-conscious guests.
- Shoulder Seasons: Implement dynamic pricing that balances peak and low rates. Target weekend travelers or specific events. Offer slightly more flexible terms than peak season.
- Regularly analyze your own performance against these El Pinar seasonality benchmarks and adjust your pricing and availability strategy accordingly.
Best Areas for Airbnb Investment in El Pinar (2025)
Exploring the top neighborhoods for short-term rentals in El Pinar? This section highlights key areas, outlining why they are attractive for hosts and guests, along with notable local attractions. Consider these locations based on your target guest profile and investment strategy.
| Neighborhood / Area | Why Host Here? (Target Guests & Appeal) | Key Attractions & Landmarks |
|---|---|---|
| El Pinar Beach | A beautiful coastal area with stunning sea views and close proximity to key attractions. Ideal for tourists looking for beaches and relaxation, along with activities like water sports and dining. | El Pinar Beach, Chiringuito Beach Bar, Scenic Coastal Walks, Water Sports Activities, Local Seafood Restaurants |
| Natural Park of Sierra de Lijar | Perfect for nature lovers and hikers, this area offers breathtaking landscapes and a range of outdoor activities. Attracts tourists looking for eco-tourism experiences away from the busy city. | Sierra de Lijar Trails, Wildlife Watching, Picnic Areas, Natural Springs, Mountain Scenery |
| Antequera | A historical town with rich cultural heritage and architectural landmarks. Draws visitors interested in history and culture, making it a potentially lucrative area for Airbnb rentals. | Alcazaba of Antequera, Dolmens of Antequera, Historic Town Centre, Arco de los Gigantes, Museum of Antequera |
| Málaga City | A vibrant city with a blend of beach, culture, and lifestyle. Attracts a wide range of tourists from beach-goers to art lovers, perfect for year-round investments. | Picasso Museum, Catedral de Málaga, Málaga Port, Malagueta Beach, Tivoli World |
| Nerja | Charming coastal town known for its stunning beaches and caves. Popular among tourists for relaxation and scenic beauty, making it a high-demand location for Airbnb hosting. | Nerja Caves, Burriana Beach, Balcony of Europe, Frigiliana, Aqueduct of El Águila |
| Ronda | Famous for its dramatic cliffside location and historic landmarks. Attracts tourists seeking unique experiences, making it an enticing option for Airbnb investments. | Puente Nuevo, Plaza de Toros, Mondragon Palace, Ronda's Old Town, Tajo Gorge |
| Marbella | Renowned for its luxurious lifestyle, beaches, and nightlife. A prime location for affluent tourists and holidaymakers, ensuring high occupancy rates for rentals. | Puerto Banús, Marbella Old Town, Marbella Beaches, Avenida del Mar, Sierra Blanca |
| Caminito del Rey | A famous walkway through a stunning gorge that draws adventure seekers from all over. Ideal for attracting tourists looking for unique outdoor experiences and adventure. | Caminito del Rey Walkway, El Chorro Gorge, Hiking Trails, Scenic Views, Adventure Activities |
Understanding Airbnb License Requirements & STR Laws in El Pinar (2025)
Yes, El Pinar, Andalusia, Spain enforces high STR regulations. Obtaining a license and ensuring compliance is almost certainly required according to current 2025 STR laws. Always verify the latest short term rental regulations and Airbnb license requirements directly with local government authorities for El Pinar to ensure full compliance before hosting.
(Source: AirROI data, 2025, based on 70% licensed listings)
Top Performing Airbnb Properties in El Pinar (2025)
Benchmark your potential! Explore examples of top-performing Airbnb properties in El Pinarbased on Trailing Twelve Month (TTM) revenue. Analyze their characteristics, revenue, occupancy rate, and ADR to understand what drives success in this market.

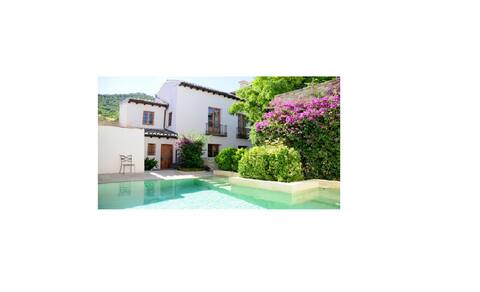
Luxury villa with hotel services in Granada
Entire Place • 10 bedrooms
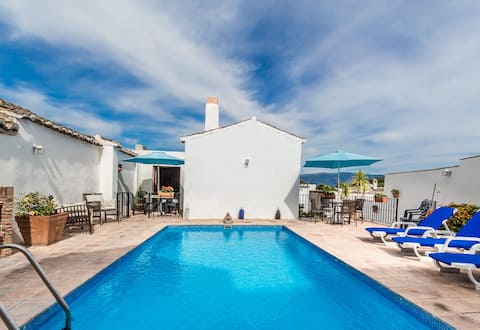
5 Bedroom Villa with pool in Andalucia
Entire Place • 5 bedrooms

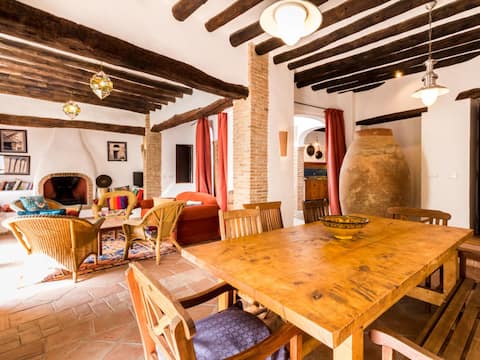
Casa Sol🌞charming house with view📸pool 🏊wifi AC
Entire Place • 2 bedrooms

Petfriendly house with terrace ,views and fireplace
Entire Place • 2 bedrooms
Casa Mundo🌍 16th century house 🏊pool wifi washer
Entire Place • 3 bedrooms
Beautiful Andalusian House with barbecue pool
Entire Place • 5 bedrooms
Note: Performance varies based on location, size, amenities, seasonality, and management quality. Data reflects the past 12 months.
Top Performing Airbnb Hosts in El Pinar (2025)
Learn from the best! This table showcases top-performing Airbnb hosts in El Pinar based on the number of properties managed and estimated total revenue over the past year. Analyze their scale and performance metrics.
| Host Name | Properties | Grossing Revenue | Stay Reviews | Avg Rating |
|---|---|---|---|---|
| Moma | 1 | $269,362 | 14 | 5.00/5.0 |
| Nico | 3 | $55,083 | 231 | 4.86/5.0 |
| Emilie | 1 | $35,077 | 5 | 5.00/5.0 |
| Ciona | 3 | $33,331 | 56 | 4.88/5.0 |
| Anne | 4 | $25,472 | 30 | 2.48/5.0 |
| Reme | 1 | $23,927 | 19 | 5.00/5.0 |
| Antonio | 2 | $20,870 | 24 | 4.95/5.0 |
| Linda | 1 | $17,347 | 7 | 4.86/5.0 |
| Host #139033302 | 1 | $15,198 | 0 | 0.00/5.0 |
| Arantxa | 1 | $11,595 | 3 | 4.67/5.0 |
Analyzing the strategies of top hosts, such as their property selection, pricing, and guest communication, can offer valuable lessons for optimizing your own Airbnb operations in El Pinar.
Dive Deeper: Advanced El Pinar STR Market Data (2025)
Ready to unlock more insights? AirROI provides access to advanced metrics and comprehensive Airbnb data for El Pinar. Explore detailed analytics beyond this report to refine your investment strategy, optimize pricing, and maximize your vacation rental profits.
Explore Advanced MetricsEl Pinar Short-Term Rental Market Composition (2025): Property & Room Types
Room Type Distribution
Property Type Distribution
Market Composition Insights for El Pinar
- The El Pinar Airbnb market composition is heavily skewed towards Entire Home/Apt listings, which make up 83.3% of the 30 active rentals. This indicates strong guest preference for privacy and space.
- Looking at the property type distribution in El Pinar, House properties are the most common (73.3%), reflecting the local real estate landscape.
- Houses represent a significant 73.3% portion, catering likely to families or larger groups.
- The presence of 16.7% Hotel/Boutique listings indicates integration with traditional hospitality.
El Pinar Airbnb Room Capacity Analysis (2025): Bedroom Distribution
Distribution of Listings by Number of Bedrooms
Room Capacity Insights for El Pinar
- The dominant room capacity in El Pinar is 2 bedrooms listings, making up 33.3% of the market. This suggests a strong demand for properties suitable for couples or solo travelers.
- Together, 2 bedrooms and 3 bedrooms properties represent 50.0% of the active Airbnb listings in El Pinar, indicating a high concentration in these sizes.
- A significant 40.1% of listings offer 3+ bedrooms, catering to larger groups and families seeking more space in El Pinar.
El Pinar Vacation Rental Guest Capacity Trends (2025)
Distribution of Listings by Guest Capacity
Guest Capacity Insights for El Pinar
- The most common guest capacity trend in El Pinar vacation rentals is listings accommodating 4 guests (26.7%). This suggests the primary traveler segment is likely small families or groups.
- Properties designed for 4 guests and 8+ guests dominate the El Pinar STR market, accounting for 50.0% of listings.
- 40.0% of properties accommodate 6+ guests, serving the market segment for larger families or group travel in El Pinar.
- On average, properties in El Pinar are equipped to host 4.5 guests.
El Pinar Airbnb Booking Patterns (2025): Available vs. Booked Days
Available Days Distribution
Booked Days Distribution
Booking Pattern Insights for El Pinar
- The most common availability pattern in El Pinar falls within the 271-366 days range, representing 66.7% of listings. This suggests many properties have significant open periods on their calendars.
- Approximately 93.4% of listings show high availability (181+ days open annually), indicating potential for increased bookings or specific owner usage patterns.
- For booked days, the 31-90 days range is most frequent in El Pinar (43.3%), reflecting common guest stay durations or potential owner blocking patterns.
- A notable 10.0% of properties secure long booking periods (181+ days booked per year), highlighting successful long-term rental strategies or significant owner usage.
El Pinar Airbnb Minimum Stay Requirements Analysis
Distribution of Listings by Minimum Night Requirement
1 Night
5 listings
18.5% of total
2 Nights
14 listings
51.9% of total
3 Nights
1 listings
3.7% of total
4-6 Nights
3 listings
11.1% of total
7-29 Nights
1 listings
3.7% of total
30+ Nights
3 listings
11.1% of total
Key Insights
- The most prevalent minimum stay requirement in El Pinar is 2 Nights, adopted by 51.9% of listings. This highlights the market's preference for shorter, flexible bookings.
- A strong majority (70.4%) of the El Pinar Airbnb data shows acceptance of very short stays (1-2 nights), indicating a dynamic, high-turnover market.
- A significant segment (11.1%) caters to monthly stays (30+ nights) in El Pinar, pointing to opportunities in the extended-stay market.
Recommendations
- Align with the market by considering a 2 Nights minimum stay, as 51.9% of El Pinar hosts use this setting.
- If feasible, allowing 1-night stays, especially midweek or during low season, could capture last-minute bookings, as only 18.5% currently do.
- A 2-night minimum appears standard (51.9%). Consider this for weekends or peak periods.
- Explore offering discounts for stays of 30+ nights to attract the 11.1% of the market seeking extended stays.
- Adjust minimum nights based on seasonality – potentially shorter during low season and longer during peak demand periods in El Pinar.
El Pinar Airbnb Cancellation Policy Trends Analysis (2025)
Super Strict 60 Days
1 listings
4.8% of total
Flexible
4 listings
19% of total
Moderate
3 listings
14.3% of total
Firm
8 listings
38.1% of total
Strict
5 listings
23.8% of total
Cancellation Policy Insights for El Pinar
- The prevailing Airbnb cancellation policy trend in El Pinar is Firm, used by 38.1% of listings.
- A majority (61.9%) of hosts in El Pinar utilize Firm or Strict policies, indicating a market where hosts prioritize booking security.
Recommendations for Hosts
- Consider adopting a Firm policy to align with the 38.1% market standard in El Pinar.
- Regularly review your cancellation policy against competitors and market demand shifts in El Pinar.
El Pinar STR Booking Lead Time Analysis (2025)
Average Booking Lead Time by Month
Booking Lead Time Insights for El Pinar
- The overall average booking lead time for vacation rentals in El Pinar is 46 days.
- Guests book furthest in advance for stays during June (average 92 days), likely coinciding with peak travel demand or local events.
- The shortest booking windows occur for stays in February (average 26 days), indicating more last-minute travel plans during this time.
- Seasonally, Summer (71 days avg.) sees the longest lead times, while Winter (43 days avg.) has the shortest, reflecting typical travel planning cycles.
Recommendations for Hosts
- Use the overall average lead time (46 days) as a baseline for your pricing and availability strategy in El Pinar.
- For June stays, consider implementing length-of-stay discounts or slightly higher rates for bookings made less than 92 days out to capitalize on advance planning.
- Target marketing efforts for the Summer season well in advance (at least 71 days) to capture early planners.
- Monitor your own booking lead times against these El Pinar averages to identify opportunities for dynamic pricing adjustments.
Popular & Essential Airbnb Amenities in El Pinar (2025)
Amenity Prevalence
Amenity Insights for El Pinar
- Essential amenities in El Pinar that guests expect include: Wifi. Lacking these (this) could significantly impact bookings.
- Popular amenities like TV, Washer, Essentials are common but not universal. Offering these can provide a competitive edge.
Recommendations for Hosts
- Ensure your listing includes all essential amenities for El Pinar: Wifi.
- Prioritize adding missing essentials: Wifi.
- Consider adding popular differentiators like TV or Washer to increase appeal.
- Highlight unique or less common amenities you offer (e.g., hot tub, dedicated workspace, EV charger) in your listing description and photos.
- Regularly check competitor amenities in El Pinar to stay competitive.
El Pinar Airbnb Guest Demographics & Profile Analysis (2025)
Guest Profile Summary for El Pinar
- The typical guest profile for Airbnb in El Pinar consists of predominantly international visitors (73%), with top international origins including United Kingdom, typically belonging to the Post-2000s (Gen Z/Alpha) group (50%), primarily speaking English or Spanish.
- Domestic travelers account for 26.7% of guests.
- Key international markets include Spain (26.7%) and United Kingdom (18.7%).
- Top languages spoken are English (44.9%) followed by Spanish (24.6%).
- A significant demographic segment is the Post-2000s (Gen Z/Alpha) group, representing 50% of guests.
Recommendations for Hosts
- Focus marketing internationally, particularly towards travelers from United Kingdom.
- Tailor amenities and listing descriptions to appeal to the dominant Post-2000s (Gen Z/Alpha) demographic (e.g., highlight fast WiFi, smart home features, local guides).
- Highlight unique local experiences or amenities relevant to the primary guest profile.
- Consider seasonal promotions aligned with peak travel times for key origin markets.
Nearby Short-Term Rental Market Comparison
How does the El Pinar Airbnb market stack up against its neighbors? Compare key performance metrics like average monthly revenue, ADR, and occupancy rates in surrounding areas to understand the broader regional STR landscape.
| Market | Active Properties | Monthly Revenue | Daily Rate | Avg. Occupancy |
|---|---|---|---|---|
| Alhaurín de la Torre | 203 | $3,368 | $287.14 | 47% |
| Alhaurín el Grande | 281 | $3,026 | $290.27 | 45% |
| Cártama | 56 | $2,829 | $300.39 | 43% |
| Marbella | 4,981 | $2,613 | $321.31 | 43% |
| Málaga | 7,038 | $2,217 | $162.86 | 54% |
| Coín | 113 | $2,208 | $261.43 | 43% |
| Moclinejo | 10 | $2,155 | $231.35 | 51% |
| Villa de Otura | 18 | $2,141 | $299.92 | 34% |
| Carcabuey | 30 | $2,139 | $215.30 | 32% |
| Almogía | 47 | $2,115 | $261.12 | 38% |