El Bosque Airbnb Market Analysis 2025: Short Term Rental Data & Vacation Rental Statistics in Andalusia, Spain
Is Airbnb profitable in El Bosque in 2025? Explore comprehensive Airbnb analytics for El Bosque, Andalusia, Spain to uncover income potential. This 2025 STR market report for El Bosque, based on AirROI data from April 2024 to March 2025, reveals key trends in the niche market of 50 active listings.
Whether you're considering an Airbnb investment in El Bosque, optimizing your existing vacation rental, or exploring rental arbitrage opportunities, understanding the El Bosque Airbnb data is crucial. Navigating the high regulation landscape is key to maximizing your short term rental income potential. Let's dive into the specifics.
Key El Bosque Airbnb Performance Metrics Overview
Monthly Airbnb Revenue Variations & Income Potential in El Bosque (2025)
Understanding the monthly revenue variations for Airbnb listings in El Bosque is key to maximizing your short term rental income potential. Seasonality significantly impacts earnings. Our analysis, based on data from the past 12 months, shows that the peak revenue month for STRs in El Bosque is typically August, while January often presents the lowest earnings, highlighting opportunities for strategic pricing adjustments during shoulder and low seasons. Explore the typical Airbnb income in El Bosque across different performance tiers:
- Best-in-class properties (Top 10%) achieve $2,388+ monthly, often utilizing dynamic pricing and superior guest experiences.
- Strong performing properties (Top 25%) earn $1,381 or more, indicating effective management and desirable locations/amenities.
- Typical properties (Median) generate around $714 per month, representing the average market performance.
- Entry-level properties (Bottom 25%) see earnings around $361, often with potential for optimization.
Average Monthly Airbnb Earnings Trend in El Bosque
El Bosque Airbnb Occupancy Rate Trends (2025)
Maximize your bookings by understanding the El Bosque STR occupancy trends. Seasonal demand shifts significantly influence how often properties are booked. Typically, Augustsees the highest demand (peak season occupancy), while January experiences the lowest (low season). Effective strategies, like adjusting minimum stays or offering promotions, can boost occupancy during slower periods. Here's how different property tiers perform in El Bosque:
- Best-in-class properties (Top 10%) achieve 55%+ occupancy, indicating high desirability and potentially optimized availability.
- Strong performing properties (Top 25%) maintain 41% or higher occupancy, suggesting good market fit and guest satisfaction.
- Typical properties (Median) have an occupancy rate around 22%.
- Entry-level properties (Bottom 25%) average 12% occupancy, potentially facing higher vacancy.
Average Monthly Occupancy Rate Trend in El Bosque
Average Daily Rate (ADR) Airbnb Trends in El Bosque (2025)
Effective short term rental pricing strategy in El Bosque involves understanding monthly ADR fluctuations. The Average Daily Rate (ADR) for Airbnb in El Bosque typically peaks in August and dips lowest during March. Leveraging Airbnb dynamic pricing tools or strategies based on this seasonality can significantly boost revenue. Here's a look at the typical nightly rates achieved:
- Best-in-class properties (Top 10%) command rates of $215+ per night, often due to premium features or locations.
- Strong performing properties (Top 25%) achieve nightly rates of $158 or more.
- Typical properties (Median) charge around $119 per night.
- Entry-level properties (Bottom 25%) earn around $77 per night.
Average Daily Rate (ADR) Trend by Month in El Bosque
Get Live El Bosque Market Intelligence 👇

Explore Real-time Analytics
Airbnb Seasonality Analysis & Trends in El Bosque (2025)
Peak Season (August, July, December)
- Revenue averages $1,482 per month
- Occupancy rates average 36.0%
- Daily rates average $137
Shoulder Season
- Revenue averages $997 per month
- Occupancy maintains around 25.8%
- Daily rates hold near $135
Low Season (January, February, May)
- Revenue drops to average $808 per month
- Occupancy decreases to average 22.9%
- Daily rates adjust to average $133
Seasonality Insights for El Bosque
- The Airbnb seasonality in El Bosque shows highly seasonal trends requiring careful strategy. While the sections above show seasonal averages, it's also insightful to look at the extremes:
- During the high season, the absolute peak month showcases El Bosque's highest earning potential, with monthly revenues capable of climbing to $1,756, occupancy reaching a high of 42.5%, and ADRs peaking at $140.
- Conversely, the slowest single month of the year, typically falling within the low season, marks the market's lowest point. In this month, revenue might dip to $662, occupancy could drop to 18.3%, and ADRs may adjust down to $129.
- Understanding both the seasonal averages and these monthly peaks and troughs in revenue, occupancy, and ADR is crucial for maximizing your Airbnb profit potential in El Bosque.
Seasonal Strategies for Maximizing Profit
- Peak Season: Maximize revenue through premium pricing and potentially longer minimum stays. Ensure high availability.
- Low Season: Offer competitive pricing, special promotions (e.g., extended stay discounts), and flexible cancellation policies. Target off-season travelers like remote workers or budget-conscious guests.
- Shoulder Seasons: Implement dynamic pricing that balances peak and low rates. Target weekend travelers or specific events. Offer slightly more flexible terms than peak season.
- Regularly analyze your own performance against these El Bosque seasonality benchmarks and adjust your pricing and availability strategy accordingly.
Best Areas for Airbnb Investment in El Bosque (2025)
Exploring the top neighborhoods for short-term rentals in El Bosque? This section highlights key areas, outlining why they are attractive for hosts and guests, along with notable local attractions. Consider these locations based on your target guest profile and investment strategy.
| Neighborhood / Area | Why Host Here? (Target Guests & Appeal) | Key Attractions & Landmarks |
|---|---|---|
| El Bosque town center | Charming town center known for its whitewashed buildings and rich history. Attracts visitors interested in local culture and Andalusian architecture. | Church of Our Lady of the Incarnation, Plaza de las Flores, El Bosque Natural Park, Local tapas bars, Traditional craft shops |
| El Bosque Natural Park | A natural retreat ideal for nature lovers and outdoor enthusiasts. Provides opportunities for hiking, bird watching, and enjoying picturesque landscapes. | Hiking trails, Birdwatching spots, Flora and fauna observation, Picnic areas, Scenic viewpoints |
| Villaluenga del Rosario | A nearby village known for its stunning surroundings and cheese production. Great for tourists looking for a peaceful getaway amidst nature. | Caves of Villaluenga, Traditional cheese shops, Hiking paths, Natural beauty, Authentic local gastronomy |
| Grazalema | Famous for its picturesque streets and beautiful nature. Attracts tourists who enjoy hiking and cultural experiences. | Grazalema Natural Park, Local artisan shops, Historic center, Mirador de Grazalema, Hiking trails |
| Zahara de la Sierra | A stunning village located by a lake with incredible views. Popular for guests looking for scenic beauty and tranquility. | Zahara El Gastor Lake, Castle of Zahara, Local hiking routes, Café with lake views, Cultural festivals |
| Setenil de las Bodegas | Unique white village built into rock formations, offering a one-of-a-kind experience to visitors. Great for tourists interested in architecture and unique landscapes. | Cave houses, Natural rock formations, Historic sites, Local cuisine, Scenic walks |
| Ronda | A historic town famous for its dramatic cliffs and the Puente Nuevo bridge. Attracts visitors looking for culture, history, and adventure activities. | Puente Nuevo, Plaza de Toros, Banos Arabes, Historic old town, Wine tasting |
| Arcos de la Frontera | Known for its dramatic cliffside location and historical architecture. It attracts visitors interested in exploring Andalusian history and culture. | Castle of Arcos, Basilica of Santa Maria, Historic narrow streets, Local artisan crafts, Panoramic views |
Understanding Airbnb License Requirements & STR Laws in El Bosque (2025)
Yes, El Bosque, Andalusia, Spain enforces high STR regulations. Obtaining a license and ensuring compliance is almost certainly required according to current 2025 STR laws. Always verify the latest short term rental regulations and Airbnb license requirements directly with local government authorities for El Bosque to ensure full compliance before hosting.
(Source: AirROI data, 2025, based on 74% licensed listings)
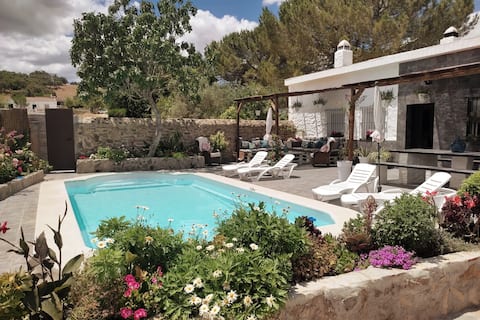
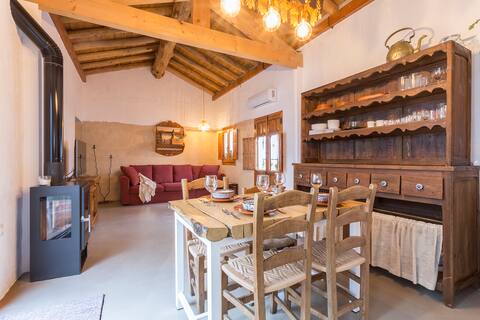
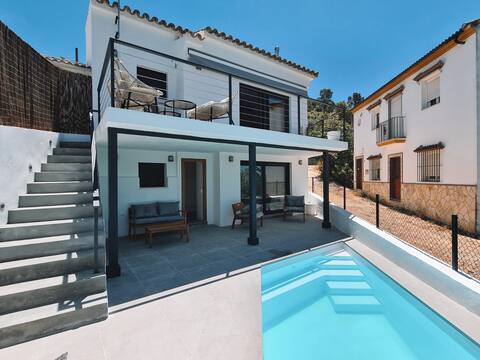
Top Performing Airbnb Properties in El Bosque (2025)
Benchmark your potential! Explore examples of top-performing Airbnb properties in El Bosquebased on Trailing Twelve Month (TTM) revenue. Analyze their characteristics, revenue, occupancy rate, and ADR to understand what drives success in this market.
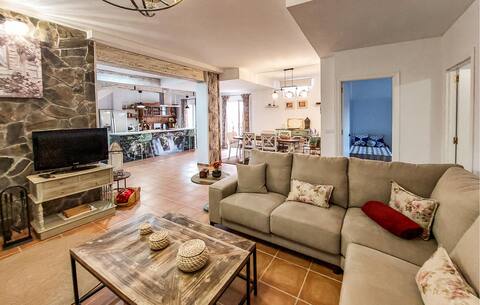
3 bedroom lovely home in El Bosque
Entire Place • 3 bedrooms
Sierra de Cádiz-Vivienda Rural Cabeza del Rey
Entire Place • 3 bedrooms
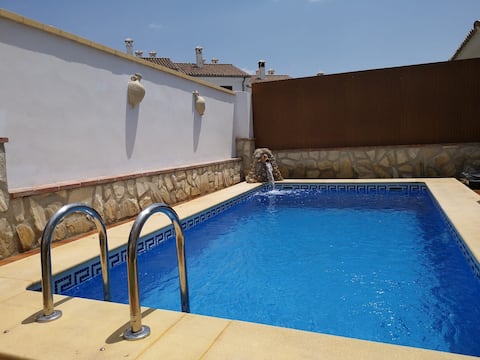
Charming cottage with pool " Con Alma" pool
Entire Place • 1 bedroom
Modern cottage with pool and view - elbosque
Entire Place • 3 bedrooms
El Pinsapar
Entire Place • 5 bedrooms

charming house on the mountain foot.
Entire Place • 3 bedrooms
Note: Performance varies based on location, size, amenities, seasonality, and management quality. Data reflects the past 12 months.
Top Performing Airbnb Hosts in El Bosque (2025)
Learn from the best! This table showcases top-performing Airbnb hosts in El Bosque based on the number of properties managed and estimated total revenue over the past year. Analyze their scale and performance metrics.
| Host Name | Properties | Grossing Revenue | Stay Reviews | Avg Rating |
|---|---|---|---|---|
| Host #154015948 | 1 | $34,731 | 0 | 0.00/5.0 |
| Maribel | 1 | $29,285 | 39 | 4.92/5.0 |
| Francisco | 3 | $28,740 | 38 | 4.89/5.0 |
| Jose Rafael | 2 | $27,534 | 65 | 4.96/5.0 |
| Alicia Maria | 1 | $27,378 | 46 | 4.98/5.0 |
| Ignacio | 1 | $26,877 | 42 | 4.93/5.0 |
| Host #117147570 | 1 | $23,138 | 0 | 0.00/5.0 |
| Antonio | 1 | $21,197 | 41 | 4.90/5.0 |
| Fran | 1 | $17,603 | 10 | 4.80/5.0 |
| Alberto | 2 | $17,342 | 98 | 4.77/5.0 |
Analyzing the strategies of top hosts, such as their property selection, pricing, and guest communication, can offer valuable lessons for optimizing your own Airbnb operations in El Bosque.
Dive Deeper: Advanced El Bosque STR Market Data (2025)
Ready to unlock more insights? AirROI provides access to advanced metrics and comprehensive Airbnb data for El Bosque. Explore detailed analytics beyond this report to refine your investment strategy, optimize pricing, and maximize your vacation rental profits.
Explore Advanced MetricsEl Bosque Short-Term Rental Market Composition (2025): Property & Room Types
Room Type Distribution
Property Type Distribution
Market Composition Insights for El Bosque
- The El Bosque Airbnb market composition is heavily skewed towards Entire Home/Apt listings, which make up 96% of the 50 active rentals. This indicates strong guest preference for privacy and space.
- Looking at the property type distribution in El Bosque, House properties are the most common (68%), reflecting the local real estate landscape.
- Houses represent a significant 68% portion, catering likely to families or larger groups.
- Smaller segments like hotel/boutique (combined 4.0%) offer potential for unique stay experiences.
El Bosque Airbnb Room Capacity Analysis (2025): Bedroom Distribution
Distribution of Listings by Number of Bedrooms
Room Capacity Insights for El Bosque
- The dominant room capacity in El Bosque is 3 bedrooms listings, making up 38% of the market. This suggests a strong demand for properties suitable for families or small groups.
- Together, 3 bedrooms and 2 bedrooms properties represent 66.0% of the active Airbnb listings in El Bosque, indicating a high concentration in these sizes.
- A significant 56.0% of listings offer 3+ bedrooms, catering to larger groups and families seeking more space in El Bosque.
El Bosque Vacation Rental Guest Capacity Trends (2025)
Distribution of Listings by Guest Capacity
Guest Capacity Insights for El Bosque
- The most common guest capacity trend in El Bosque vacation rentals is listings accommodating 8+ guests (32%). This suggests the primary traveler segment is likely larger groups.
- Properties designed for 8+ guests and 6 guests dominate the El Bosque STR market, accounting for 60.0% of listings.
- 68.0% of properties accommodate 6+ guests, serving the market segment for larger families or group travel in El Bosque.
- On average, properties in El Bosque are equipped to host 5.9 guests.
El Bosque Airbnb Booking Patterns (2025): Available vs. Booked Days
Available Days Distribution
Booked Days Distribution
Booking Pattern Insights for El Bosque
- The most common availability pattern in El Bosque falls within the 271-366 days range, representing 70% of listings. This suggests many properties have significant open periods on their calendars.
- Approximately 94.0% of listings show high availability (181+ days open annually), indicating potential for increased bookings or specific owner usage patterns.
- For booked days, the 31-90 days range is most frequent in El Bosque (38%), reflecting common guest stay durations or potential owner blocking patterns.
- A notable 6.0% of properties secure long booking periods (181+ days booked per year), highlighting successful long-term rental strategies or significant owner usage.
El Bosque Airbnb Minimum Stay Requirements Analysis
Distribution of Listings by Minimum Night Requirement
1 Night
8 listings
17% of total
2 Nights
32 listings
68.1% of total
3 Nights
1 listings
2.1% of total
4-6 Nights
1 listings
2.1% of total
30+ Nights
5 listings
10.6% of total
Key Insights
- The most prevalent minimum stay requirement in El Bosque is 2 Nights, adopted by 68.1% of listings. This highlights the market's preference for shorter, flexible bookings.
- A strong majority (85.1%) of the El Bosque Airbnb data shows acceptance of very short stays (1-2 nights), indicating a dynamic, high-turnover market.
- A significant segment (10.6%) caters to monthly stays (30+ nights) in El Bosque, pointing to opportunities in the extended-stay market.
Recommendations
- Align with the market by considering a 2 Nights minimum stay, as 68.1% of El Bosque hosts use this setting.
- If feasible, allowing 1-night stays, especially midweek or during low season, could capture last-minute bookings, as only 17% currently do.
- A 2-night minimum appears standard (68.1%). Consider this for weekends or peak periods.
- Explore offering discounts for stays of 30+ nights to attract the 10.6% of the market seeking extended stays.
- Adjust minimum nights based on seasonality – potentially shorter during low season and longer during peak demand periods in El Bosque.
El Bosque Airbnb Cancellation Policy Trends Analysis (2025)
Super Strict 60 Days
1 listings
2.5% of total
Flexible
11 listings
27.5% of total
Moderate
14 listings
35% of total
Firm
3 listings
7.5% of total
Strict
11 listings
27.5% of total
Cancellation Policy Insights for El Bosque
- The prevailing Airbnb cancellation policy trend in El Bosque is Moderate, used by 35% of listings.
- There's a relatively balanced mix between guest-friendly (62.5%) and stricter (35.0%) policies, offering choices for different guest needs.
Recommendations for Hosts
- Consider adopting a Moderate policy to align with the 35% market standard in El Bosque.
- Regularly review your cancellation policy against competitors and market demand shifts in El Bosque.
El Bosque STR Booking Lead Time Analysis (2025)
Average Booking Lead Time by Month
Booking Lead Time Insights for El Bosque
- The overall average booking lead time for vacation rentals in El Bosque is 36 days.
- Guests book furthest in advance for stays during April (average 61 days), likely coinciding with peak travel demand or local events.
- The shortest booking windows occur for stays in February (average 22 days), indicating more last-minute travel plans during this time.
- Seasonally, Spring (51 days avg.) sees the longest lead times, while Winter (32 days avg.) has the shortest, reflecting typical travel planning cycles.
Recommendations for Hosts
- Use the overall average lead time (36 days) as a baseline for your pricing and availability strategy in El Bosque.
- For April stays, consider implementing length-of-stay discounts or slightly higher rates for bookings made less than 61 days out to capitalize on advance planning.
- Target marketing efforts for the Spring season well in advance (at least 51 days) to capture early planners.
- Monitor your own booking lead times against these El Bosque averages to identify opportunities for dynamic pricing adjustments.
Popular & Essential Airbnb Amenities in El Bosque (2025)
Amenity Prevalence
Amenity Insights for El Bosque
- Essential amenities in El Bosque that guests expect include: Washer, Kitchen, TV, Refrigerator. Lacking these (any) could significantly impact bookings.
- Popular amenities like Hot water, Coffee maker, Hangers are common but not universal. Offering these can provide a competitive edge.
Recommendations for Hosts
- Ensure your listing includes all essential amenities for El Bosque: Washer, Kitchen, TV, Refrigerator.
- Prioritize adding missing essentials: TV, Refrigerator.
- Consider adding popular differentiators like Hot water or Coffee maker to increase appeal.
- Highlight unique or less common amenities you offer (e.g., hot tub, dedicated workspace, EV charger) in your listing description and photos.
- Regularly check competitor amenities in El Bosque to stay competitive.
El Bosque Airbnb Guest Demographics & Profile Analysis (2025)
Guest Profile Summary for El Bosque
- The typical guest profile for Airbnb in El Bosque consists of primarily domestic travelers (73%), often arriving from nearby Seville, typically belonging to the Post-2000s (Gen Z/Alpha) group (50%), primarily speaking Spanish or English.
- Domestic travelers account for 73.0% of guests.
- Key international markets include Spain (73%) and France (9%).
- Top languages spoken are Spanish (34.1%) followed by English (31%).
- A significant demographic segment is the Post-2000s (Gen Z/Alpha) group, representing 50% of guests.
Recommendations for Hosts
- Target domestic marketing efforts towards travelers from Seville and Cádiz.
- Tailor amenities and listing descriptions to appeal to the dominant Post-2000s (Gen Z/Alpha) demographic (e.g., highlight fast WiFi, smart home features, local guides).
- Highlight unique local experiences or amenities relevant to the primary guest profile.
- Consider seasonal promotions aligned with peak travel times for key origin markets.
Nearby Short-Term Rental Market Comparison
How does the El Bosque Airbnb market stack up against its neighbors? Compare key performance metrics like average monthly revenue, ADR, and occupancy rates in surrounding areas to understand the broader regional STR landscape.
| Market | Active Properties | Monthly Revenue | Daily Rate | Avg. Occupancy |
|---|---|---|---|---|
| Alhaurín de la Torre | 203 | $3,368 | $287.14 | 47% |
| Gelves | 22 | $3,120 | $185.84 | 53% |
| Benahavís | 492 | $3,047 | $494.00 | 40% |
| Alhaurín el Grande | 281 | $3,026 | $290.27 | 45% |
| Cártama | 56 | $2,829 | $300.39 | 43% |
| Marbella | 4,981 | $2,613 | $321.31 | 43% |
| El Castillo de las Guardas | 13 | $2,500 | $247.20 | 38% |
| Guillena | 34 | $2,397 | $273.55 | 36% |
| Valencina de la Concepción | 33 | $2,230 | $200.81 | 49% |
| Málaga | 7,038 | $2,217 | $162.86 | 54% |