Cuevas del Almanzora Airbnb Market Analysis 2025: Short Term Rental Data & Vacation Rental Statistics in Andalusia, Spain
Is Airbnb profitable in Cuevas del Almanzora in 2025? Explore comprehensive Airbnb analytics for Cuevas del Almanzora, Andalusia, Spain to uncover income potential. This 2025 STR market report for Cuevas del Almanzora, based on AirROI data from April 2024 to March 2025, reveals key trends in the niche market of 117 active listings.
Whether you're considering an Airbnb investment in Cuevas del Almanzora, optimizing your existing vacation rental, or exploring rental arbitrage opportunities, understanding the Cuevas del Almanzora Airbnb data is crucial. Navigating the high regulation landscape is key to maximizing your short term rental income potential. Let's dive into the specifics.
Key Cuevas del Almanzora Airbnb Performance Metrics Overview
Monthly Airbnb Revenue Variations & Income Potential in Cuevas del Almanzora (2025)
Understanding the monthly revenue variations for Airbnb listings in Cuevas del Almanzora is key to maximizing your short term rental income potential. Seasonality significantly impacts earnings. Our analysis, based on data from the past 12 months, shows that the peak revenue month for STRs in Cuevas del Almanzora is typically August, while November often presents the lowest earnings, highlighting opportunities for strategic pricing adjustments during shoulder and low seasons. Explore the typical Airbnb income in Cuevas del Almanzora across different performance tiers:
- Best-in-class properties (Top 10%) achieve $2,727+ monthly, often utilizing dynamic pricing and superior guest experiences.
- Strong performing properties (Top 25%) earn $1,577 or more, indicating effective management and desirable locations/amenities.
- Typical properties (Median) generate around $917 per month, representing the average market performance.
- Entry-level properties (Bottom 25%) see earnings around $511, often with potential for optimization.
Average Monthly Airbnb Earnings Trend in Cuevas del Almanzora
Cuevas del Almanzora Airbnb Occupancy Rate Trends (2025)
Maximize your bookings by understanding the Cuevas del Almanzora STR occupancy trends. Seasonal demand shifts significantly influence how often properties are booked. Typically, Augustsees the highest demand (peak season occupancy), while January experiences the lowest (low season). Effective strategies, like adjusting minimum stays or offering promotions, can boost occupancy during slower periods. Here's how different property tiers perform in Cuevas del Almanzora:
- Best-in-class properties (Top 10%) achieve 57%+ occupancy, indicating high desirability and potentially optimized availability.
- Strong performing properties (Top 25%) maintain 42% or higher occupancy, suggesting good market fit and guest satisfaction.
- Typical properties (Median) have an occupancy rate around 26%.
- Entry-level properties (Bottom 25%) average 15% occupancy, potentially facing higher vacancy.
Average Monthly Occupancy Rate Trend in Cuevas del Almanzora
Average Daily Rate (ADR) Airbnb Trends in Cuevas del Almanzora (2025)
Effective short term rental pricing strategy in Cuevas del Almanzora involves understanding monthly ADR fluctuations. The Average Daily Rate (ADR) for Airbnb in Cuevas del Almanzora typically peaks in August and dips lowest during October. Leveraging Airbnb dynamic pricing tools or strategies based on this seasonality can significantly boost revenue. Here's a look at the typical nightly rates achieved:
- Best-in-class properties (Top 10%) command rates of $284+ per night, often due to premium features or locations.
- Strong performing properties (Top 25%) achieve nightly rates of $151 or more.
- Typical properties (Median) charge around $106 per night.
- Entry-level properties (Bottom 25%) earn around $77 per night.
Average Daily Rate (ADR) Trend by Month in Cuevas del Almanzora
Get Live Cuevas del Almanzora Market Intelligence 👇

Explore Real-time Analytics
Airbnb Seasonality Analysis & Trends in Cuevas del Almanzora (2025)
Peak Season (August, July, September)
- Revenue averages $2,249 per month
- Occupancy rates average 44.9%
- Daily rates average $152
Shoulder Season
- Revenue averages $1,134 per month
- Occupancy maintains around 25.3%
- Daily rates hold near $144
Low Season (January, February, November)
- Revenue drops to average $712 per month
- Occupancy decreases to average 22.1%
- Daily rates adjust to average $144
Seasonality Insights for Cuevas del Almanzora
- The Airbnb seasonality in Cuevas del Almanzora shows highly seasonal trends requiring careful strategy. While the sections above show seasonal averages, it's also insightful to look at the extremes:
- During the high season, the absolute peak month showcases Cuevas del Almanzora's highest earning potential, with monthly revenues capable of climbing to $2,985, occupancy reaching a high of 55.4%, and ADRs peaking at $156.
- Conversely, the slowest single month of the year, typically falling within the low season, marks the market's lowest point. In this month, revenue might dip to $648, occupancy could drop to 18.0%, and ADRs may adjust down to $141.
- Understanding both the seasonal averages and these monthly peaks and troughs in revenue, occupancy, and ADR is crucial for maximizing your Airbnb profit potential in Cuevas del Almanzora.
Seasonal Strategies for Maximizing Profit
- Peak Season: Maximize revenue through premium pricing and potentially longer minimum stays. Ensure high availability.
- Low Season: Offer competitive pricing, special promotions (e.g., extended stay discounts), and flexible cancellation policies. Target off-season travelers like remote workers or budget-conscious guests.
- Shoulder Seasons: Implement dynamic pricing that balances peak and low rates. Target weekend travelers or specific events. Offer slightly more flexible terms than peak season.
- Regularly analyze your own performance against these Cuevas del Almanzora seasonality benchmarks and adjust your pricing and availability strategy accordingly.
Best Areas for Airbnb Investment in Cuevas del Almanzora (2025)
Exploring the top neighborhoods for short-term rentals in Cuevas del Almanzora? This section highlights key areas, outlining why they are attractive for hosts and guests, along with notable local attractions. Consider these locations based on your target guest profile and investment strategy.
| Neighborhood / Area | Why Host Here? (Target Guests & Appeal) | Key Attractions & Landmarks |
|---|---|---|
| Cerro de la Sal | A stunning natural area known for its scenic views and hiking trails. Ideal for nature lovers seeking a peaceful retreat close to the coast. | Sierra de Alhamilla, Almanzora River, Hiking trails, Natural parks, Scenic viewpoints |
| La Alcazaba | Rich in history with its ancient castle and cultural heritage. Attracts tourists interested in history and architecture. | Cerro de la Almirez, Historic streets, Cultural festivals, Archaeological sites |
| Desierto de Tabernas | Famous for its unique desert landscape and film history. Great for tourists interested in western films and unique photography. | Tabernas Desert, Mini Hollywood, Western movie sets, Natural park tours |
| Las Maravillas Beach | A beautiful beach destination attracting sun-seekers and water sports enthusiasts. Popular for its family-friendly atmosphere. | Beach activities, Water sports, Beachside restaurants, Sunbathing areas |
| Cuevas de Almanzora Town Center | Central hub with local culture, shops, and amenities. Provides an authentic Andalusian experience with access to local cuisine and life. | Old town charm, Local markets, Andalusian cuisine, Historic buildings |
| Mojacar Playa | Close to Cuevas del Almanzora, a lively beach town known for its nightlife and beautiful beaches. Great for younger crowds and vacationers. | Vibrant nightlife, Beach bars, Water sports, Art galleries, Local festivals |
| Pueblo Indalo | A modern yet traditional area with beautiful architecture, ideal for those looking for a blend of old and new. | Indalo symbol, Local artisan shops, Cultural exhibitions, Beautiful plazas |
| Cuevas del Almanzora Cultural Center | A focal point for arts and events, attracting those interested in local culture and performances. | Art exhibits, Concerts, Theatrical performances, Cultural workshops |
Understanding Airbnb License Requirements & STR Laws in Cuevas del Almanzora (2025)
Yes, Cuevas del Almanzora, Andalusia, Spain enforces high STR regulations. Obtaining a license and ensuring compliance is almost certainly required according to current 2025 STR laws. Always verify the latest short term rental regulations and Airbnb license requirements directly with local government authorities for Cuevas del Almanzora to ensure full compliance before hosting.
(Source: AirROI data, 2025, based on 58% licensed listings)
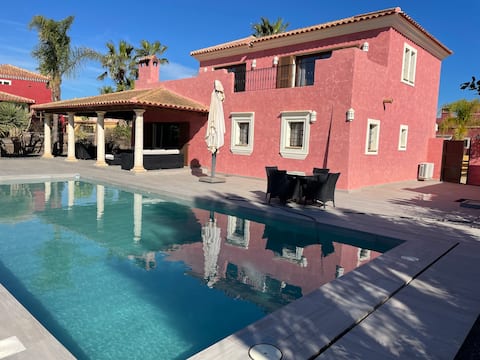
Top Performing Airbnb Properties in Cuevas del Almanzora (2025)
Benchmark your potential! Explore examples of top-performing Airbnb properties in Cuevas del Almanzorabased on Trailing Twelve Month (TTM) revenue. Analyze their characteristics, revenue, occupancy rate, and ADR to understand what drives success in this market.
Casa del Canto, Calapanizo
Entire Place • 4 bedrooms

Lovely apartment with a pool and garage.
Entire Place • 1 bedroom
Beautiful Apartment II
Entire Place • 1 bedroom
Modern Villa on Golf Course with Large Pool
Entire Place • 3 bedrooms
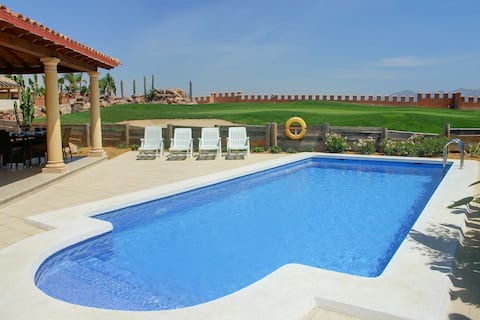
Casa con Piscina, 4 Dormitorios
Entire Place • 4 bedrooms
Los Jazmines Luxury Spanish Villa
Entire Place • 4 bedrooms
Note: Performance varies based on location, size, amenities, seasonality, and management quality. Data reflects the past 12 months.
Top Performing Airbnb Hosts in Cuevas del Almanzora (2025)
Learn from the best! This table showcases top-performing Airbnb hosts in Cuevas del Almanzora based on the number of properties managed and estimated total revenue over the past year. Analyze their scale and performance metrics.
| Host Name | Properties | Grossing Revenue | Stay Reviews | Avg Rating |
|---|---|---|---|---|
| Desert Springs Resort | 6 | $80,648 | 4 | 0.78/5.0 |
| Ramses | 2 | $72,695 | 6 | 4.83/5.0 |
| Ellie | 9 | $61,936 | 6 | 0.56/5.0 |
| Francisco Javier | 1 | $57,406 | 7 | 5.00/5.0 |
| Host #9823628 | 3 | $49,851 | 2 | 0.00/5.0 |
| Host #355534761 | 3 | $34,790 | 37 | 4.90/5.0 |
| Host #486346757 | 1 | $31,635 | 1 | 0.00/5.0 |
| Elaine | 1 | $22,950 | 6 | 4.83/5.0 |
| Núria | 4 | $21,387 | 18 | 2.33/5.0 |
| Novasol | 1 | $21,000 | 3 | 4.67/5.0 |
Analyzing the strategies of top hosts, such as their property selection, pricing, and guest communication, can offer valuable lessons for optimizing your own Airbnb operations in Cuevas del Almanzora.
Dive Deeper: Advanced Cuevas del Almanzora STR Market Data (2025)
Ready to unlock more insights? AirROI provides access to advanced metrics and comprehensive Airbnb data for Cuevas del Almanzora. Explore detailed analytics beyond this report to refine your investment strategy, optimize pricing, and maximize your vacation rental profits.
Explore Advanced MetricsCuevas del Almanzora Short-Term Rental Market Composition (2025): Property & Room Types
Room Type Distribution
Property Type Distribution
Market Composition Insights for Cuevas del Almanzora
- The Cuevas del Almanzora Airbnb market composition is heavily skewed towards Entire Home/Apt listings, which make up 89.7% of the 117 active rentals. This indicates strong guest preference for privacy and space.
- Looking at the property type distribution in Cuevas del Almanzora, Apartment/Condo properties are the most common (65%), reflecting the local real estate landscape.
- Houses represent a significant 31.6% portion, catering likely to families or larger groups.
- Smaller segments like unique stays, others, hotel/boutique (combined 3.5%) offer potential for unique stay experiences.
Cuevas del Almanzora Airbnb Room Capacity Analysis (2025): Bedroom Distribution
Distribution of Listings by Number of Bedrooms
Room Capacity Insights for Cuevas del Almanzora
- The dominant room capacity in Cuevas del Almanzora is 2 bedrooms listings, making up 47.9% of the market. This suggests a strong demand for properties suitable for couples or solo travelers.
- Together, 2 bedrooms and 1 bedroom properties represent 71.0% of the active Airbnb listings in Cuevas del Almanzora, indicating a high concentration in these sizes.
- A significant 26.5% of listings offer 3+ bedrooms, catering to larger groups and families seeking more space in Cuevas del Almanzora.
Cuevas del Almanzora Vacation Rental Guest Capacity Trends (2025)
Distribution of Listings by Guest Capacity
Guest Capacity Insights for Cuevas del Almanzora
- The most common guest capacity trend in Cuevas del Almanzora vacation rentals is listings accommodating 4 guests (35%). This suggests the primary traveler segment is likely small families or groups.
- Properties designed for 4 guests and 6 guests dominate the Cuevas del Almanzora STR market, accounting for 56.4% of listings.
- 34.3% of properties accommodate 6+ guests, serving the market segment for larger families or group travel in Cuevas del Almanzora.
- On average, properties in Cuevas del Almanzora are equipped to host 4.6 guests.
Cuevas del Almanzora Airbnb Booking Patterns (2025): Available vs. Booked Days
Available Days Distribution
Booked Days Distribution
Booking Pattern Insights for Cuevas del Almanzora
- The most common availability pattern in Cuevas del Almanzora falls within the 271-366 days range, representing 79.5% of listings. This suggests many properties have significant open periods on their calendars.
- Approximately 99.2% of listings show high availability (181+ days open annually), indicating potential for increased bookings or specific owner usage patterns.
- For booked days, the 31-90 days range is most frequent in Cuevas del Almanzora (49.6%), reflecting common guest stay durations or potential owner blocking patterns.
- A notable 0.9% of properties secure long booking periods (181+ days booked per year), highlighting successful long-term rental strategies or significant owner usage.
Cuevas del Almanzora Airbnb Minimum Stay Requirements Analysis
Distribution of Listings by Minimum Night Requirement
1 Night
27 listings
26.2% of total
2 Nights
17 listings
16.5% of total
3 Nights
18 listings
17.5% of total
4-6 Nights
20 listings
19.4% of total
7-29 Nights
12 listings
11.7% of total
30+ Nights
9 listings
8.7% of total
Key Insights
- The most prevalent minimum stay requirement in Cuevas del Almanzora is 1 Night, adopted by 26.2% of listings. This highlights the market's preference for shorter, flexible bookings.
Recommendations
- Align with the market by considering a 1 Night minimum stay, as 26.2% of Cuevas del Almanzora hosts use this setting.
- If feasible, allowing 1-night stays, especially midweek or during low season, could capture last-minute bookings, as only 26.2% currently do.
- Explore offering discounts for stays of 30+ nights to attract the 8.7% of the market seeking extended stays.
- Adjust minimum nights based on seasonality – potentially shorter during low season and longer during peak demand periods in Cuevas del Almanzora.
Cuevas del Almanzora Airbnb Cancellation Policy Trends Analysis (2025)
Super Strict 30 Days
2 listings
2.9% of total
Super Strict 60 Days
2 listings
2.9% of total
Flexible
16 listings
23.2% of total
Moderate
15 listings
21.7% of total
Firm
21 listings
30.4% of total
Strict
13 listings
18.8% of total
Cancellation Policy Insights for Cuevas del Almanzora
- The prevailing Airbnb cancellation policy trend in Cuevas del Almanzora is Firm, used by 30.4% of listings.
- There's a relatively balanced mix between guest-friendly (44.9%) and stricter (49.2%) policies, offering choices for different guest needs.
Recommendations for Hosts
- Consider adopting a Firm policy to align with the 30.4% market standard in Cuevas del Almanzora.
- Regularly review your cancellation policy against competitors and market demand shifts in Cuevas del Almanzora.
Cuevas del Almanzora STR Booking Lead Time Analysis (2025)
Average Booking Lead Time by Month
Booking Lead Time Insights for Cuevas del Almanzora
- The overall average booking lead time for vacation rentals in Cuevas del Almanzora is 43 days.
- Guests book furthest in advance for stays during April (average 87 days), likely coinciding with peak travel demand or local events.
- The shortest booking windows occur for stays in March (average 35 days), indicating more last-minute travel plans during this time.
- Seasonally, Summer (67 days avg.) sees the longest lead times, while Fall (53 days avg.) has the shortest, reflecting typical travel planning cycles.
Recommendations for Hosts
- Use the overall average lead time (43 days) as a baseline for your pricing and availability strategy in Cuevas del Almanzora.
- For April stays, consider implementing length-of-stay discounts or slightly higher rates for bookings made less than 87 days out to capitalize on advance planning.
- Target marketing efforts for the Summer season well in advance (at least 67 days) to capture early planners.
- Monitor your own booking lead times against these Cuevas del Almanzora averages to identify opportunities for dynamic pricing adjustments.
Popular & Essential Airbnb Amenities in Cuevas del Almanzora (2025)
Amenity Prevalence
Amenity Insights for Cuevas del Almanzora
- Essential amenities in Cuevas del Almanzora that guests expect include: Washer. Lacking these (this) could significantly impact bookings.
- Popular amenities like Kitchen, TV, Essentials are common but not universal. Offering these can provide a competitive edge.
- A pool is a highly desired but not standard amenity, making it a key feature for attracting guests seeking leisure in Cuevas del Almanzora.
- Warning: Wifi is not universally provided but is considered essential globally. Ensure reliable Wifi is offered.
Recommendations for Hosts
- Ensure your listing includes all essential amenities for Cuevas del Almanzora: Washer.
- Prioritize adding missing essentials: Washer.
- Consider adding popular differentiators like Kitchen or TV to increase appeal.
- Highlight unique or less common amenities you offer (e.g., hot tub, dedicated workspace, EV charger) in your listing description and photos.
- Regularly check competitor amenities in Cuevas del Almanzora to stay competitive.
Cuevas del Almanzora Airbnb Guest Demographics & Profile Analysis (2025)
Guest Profile Summary for Cuevas del Almanzora
- The typical guest profile for Airbnb in Cuevas del Almanzora consists of primarily domestic travelers (66%), often arriving from nearby Madrid, typically belonging to the Post-2000s (Gen Z/Alpha) group (50%), primarily speaking Spanish or English.
- Domestic travelers account for 66.0% of guests.
- Key international markets include Spain (66%) and United Kingdom (9.1%).
- Top languages spoken are Spanish (33.6%) followed by English (31%).
- A significant demographic segment is the Post-2000s (Gen Z/Alpha) group, representing 50% of guests.
Recommendations for Hosts
- Target domestic marketing efforts towards travelers from Madrid and Granada.
- Tailor amenities and listing descriptions to appeal to the dominant Post-2000s (Gen Z/Alpha) demographic (e.g., highlight fast WiFi, smart home features, local guides).
- Highlight unique local experiences or amenities relevant to the primary guest profile.
- Consider seasonal promotions aligned with peak travel times for key origin markets.
Nearby Short-Term Rental Market Comparison
How does the Cuevas del Almanzora Airbnb market stack up against its neighbors? Compare key performance metrics like average monthly revenue, ADR, and occupancy rates in surrounding areas to understand the broader regional STR landscape.
| Market | Active Properties | Monthly Revenue | Daily Rate | Avg. Occupancy |
|---|---|---|---|---|
| Sella | 13 | $2,052 | $191.28 | 43% |
| Mutxamel | 91 | $1,899 | $190.33 | 43% |
| Agost | 11 | $1,887 | $169.85 | 34% |
| el Campello | 911 | $1,719 | $168.00 | 49% |
| Polop | 55 | $1,713 | $238.59 | 40% |
| Callosa d'en Sarrià | 30 | $1,692 | $225.31 | 38% |
| Altea | 894 | $1,657 | $185.18 | 44% |
| Benijófar | 24 | $1,647 | $165.65 | 50% |
| Monforte del Cid | 12 | $1,614 | $204.73 | 38% |
| l'Atzúbia | 17 | $1,591 | $234.43 | 47% |