Comares Airbnb Market Analysis 2025: Short Term Rental Data & Vacation Rental Statistics in Andalusia, Spain
Is Airbnb profitable in Comares in 2025? Explore comprehensive Airbnb analytics for Comares, Andalusia, Spain to uncover income potential. This 2025 STR market report for Comares, based on AirROI data from April 2024 to March 2025, reveals key trends in the niche market of 62 active listings.
Whether you're considering an Airbnb investment in Comares, optimizing your existing vacation rental, or exploring rental arbitrage opportunities, understanding the Comares Airbnb data is crucial. Navigating the high regulation landscape is key to maximizing your short term rental income potential. Let's dive into the specifics.
Key Comares Airbnb Performance Metrics Overview
Monthly Airbnb Revenue Variations & Income Potential in Comares (2025)
Understanding the monthly revenue variations for Airbnb listings in Comares is key to maximizing your short term rental income potential. Seasonality significantly impacts earnings. Our analysis, based on data from the past 12 months, shows that the peak revenue month for STRs in Comares is typically July, while February often presents the lowest earnings, highlighting opportunities for strategic pricing adjustments during shoulder and low seasons. Explore the typical Airbnb income in Comares across different performance tiers:
- Best-in-class properties (Top 10%) achieve $4,585+ monthly, often utilizing dynamic pricing and superior guest experiences.
- Strong performing properties (Top 25%) earn $3,383 or more, indicating effective management and desirable locations/amenities.
- Typical properties (Median) generate around $2,117 per month, representing the average market performance.
- Entry-level properties (Bottom 25%) see earnings around $1,057, often with potential for optimization.
Average Monthly Airbnb Earnings Trend in Comares
Comares Airbnb Occupancy Rate Trends (2025)
Maximize your bookings by understanding the Comares STR occupancy trends. Seasonal demand shifts significantly influence how often properties are booked. Typically, Augustsees the highest demand (peak season occupancy), while March experiences the lowest (low season). Effective strategies, like adjusting minimum stays or offering promotions, can boost occupancy during slower periods. Here's how different property tiers perform in Comares:
- Best-in-class properties (Top 10%) achieve 89%+ occupancy, indicating high desirability and potentially optimized availability.
- Strong performing properties (Top 25%) maintain 76% or higher occupancy, suggesting good market fit and guest satisfaction.
- Typical properties (Median) have an occupancy rate around 51%.
- Entry-level properties (Bottom 25%) average 28% occupancy, potentially facing higher vacancy.
Average Monthly Occupancy Rate Trend in Comares
Average Daily Rate (ADR) Airbnb Trends in Comares (2025)
Effective short term rental pricing strategy in Comares involves understanding monthly ADR fluctuations. The Average Daily Rate (ADR) for Airbnb in Comares typically peaks in July and dips lowest during February. Leveraging Airbnb dynamic pricing tools or strategies based on this seasonality can significantly boost revenue. Here's a look at the typical nightly rates achieved:
- Best-in-class properties (Top 10%) command rates of $228+ per night, often due to premium features or locations.
- Strong performing properties (Top 25%) achieve nightly rates of $166 or more.
- Typical properties (Median) charge around $122 per night.
- Entry-level properties (Bottom 25%) earn around $89 per night.
Average Daily Rate (ADR) Trend by Month in Comares
Get Live Comares Market Intelligence 👇

Explore Real-time Analytics
Airbnb Seasonality Analysis & Trends in Comares (2025)
Peak Season (July, August, September)
- Revenue averages $3,841 per month
- Occupancy rates average 66.7%
- Daily rates average $173
Shoulder Season
- Revenue averages $2,191 per month
- Occupancy maintains around 50.3%
- Daily rates hold near $141
Low Season (February, March, December)
- Revenue drops to average $1,196 per month
- Occupancy decreases to average 36.6%
- Daily rates adjust to average $122
Seasonality Insights for Comares
- The Airbnb seasonality in Comares shows highly seasonal trends requiring careful strategy. While the sections above show seasonal averages, it's also insightful to look at the extremes:
- During the high season, the absolute peak month showcases Comares's highest earning potential, with monthly revenues capable of climbing to $4,299, occupancy reaching a high of 71.1%, and ADRs peaking at $180.
- Conversely, the slowest single month of the year, typically falling within the low season, marks the market's lowest point. In this month, revenue might dip to $1,087, occupancy could drop to 32.9%, and ADRs may adjust down to $121.
- Understanding both the seasonal averages and these monthly peaks and troughs in revenue, occupancy, and ADR is crucial for maximizing your Airbnb profit potential in Comares.
Seasonal Strategies for Maximizing Profit
- Peak Season: Maximize revenue through premium pricing and potentially longer minimum stays. Ensure high availability.
- Low Season: Offer competitive pricing, special promotions (e.g., extended stay discounts), and flexible cancellation policies. Target off-season travelers like remote workers or budget-conscious guests.
- Shoulder Seasons: Implement dynamic pricing that balances peak and low rates. Target weekend travelers or specific events. Offer slightly more flexible terms than peak season.
- Regularly analyze your own performance against these Comares seasonality benchmarks and adjust your pricing and availability strategy accordingly.
Best Areas for Airbnb Investment in Comares (2025)
Exploring the top neighborhoods for short-term rentals in Comares? This section highlights key areas, outlining why they are attractive for hosts and guests, along with notable local attractions. Consider these locations based on your target guest profile and investment strategy.
| Neighborhood / Area | Why Host Here? (Target Guests & Appeal) | Key Attractions & Landmarks |
|---|---|---|
| Centro Histórico de Comares | Charming historical center with traditional Andalusian architecture, narrow streets, and stunning views of the surrounding mountains. A great spot for visitors looking for authentic cultural experiences. | Church of Nuestra Señora de la Asunción, Comares Castle, Mirador de los Cazadores, Local festivals and events, Andalusian gastronomy |
| La Axarquía | Region known for its beautiful landscapes, hiking trails, and proximity to the Mediterranean coast. Attracts nature lovers and those looking for outdoor activities. | Torre del Mar beach, Natural park of Sierras de Tejeda, Almijara and Alhama, Hiking and biking trails, Breathtaking views of the countryside, Local wineries |
| Málaga Coast | Short drive from Comares, offering beautiful beaches and a vibrant coastal atmosphere. Popular with beachgoers and those seeking a relaxed seaside experience. | Beaches of Nerja, Balcon de Europa, Water sports and beach activities, Charming coastal towns, Nearby golf courses |
| Cueva del Tesoro | Famous natural caves located near Comares, known for their stunning formations and legend. A unique attraction for tourists interested in nature and geology. | Guided tours of the caves, Stalactites and stalagmites, Educational exhibits, Natural beauty |
| Walking Trails | The lush landscapes surrounding Comares offer excellent hiking and walking trails, ideal for visitors looking to explore the natural beauty of the region. | Various hiking routes, Scenic viewpoints, Wildlife observation, Guided nature tours |
| Cultural Events | Comares hosts various cultural events and festivals throughout the year, making it an engaging place for visitors to experience local traditions. | Fiestas de San Isidro, Local art and craft fairs, Folklore performances, Food festivals |
| Local Gastronomy | The area is known for its rich culinary traditions, attracting food lovers and those eager to explore authentic Spanish cuisine. | Tapas bars, Local wine and olive oil tastings, Cooking classes, Traditional restaurants |
| Adventure Activities | The region offers opportunities for adventure sports, attracting thrill-seekers and those looking for unique experiences during their stay. | Rock climbing, Canyoning, Mountain biking, Horseback riding |
Understanding Airbnb License Requirements & STR Laws in Comares (2025)
Yes, Comares, Andalusia, Spain enforces high STR regulations. Obtaining a license and ensuring compliance is almost certainly required according to current 2025 STR laws. Always verify the latest short term rental regulations and Airbnb license requirements directly with local government authorities for Comares to ensure full compliance before hosting.
(Source: AirROI data, 2025, based on 87% licensed listings)
Top Performing Airbnb Properties in Comares (2025)
Benchmark your potential! Explore examples of top-performing Airbnb properties in Comaresbased on Trailing Twelve Month (TTM) revenue. Analyze their characteristics, revenue, occupancy rate, and ADR to understand what drives success in this market.

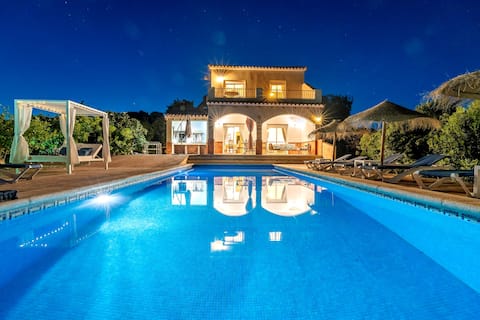
Villa Palomeras, Heated pool, Petfriendly,AC,BBQ
Entire Place • 5 bedrooms
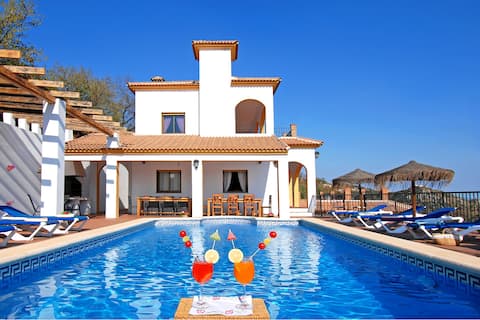
Villa Botin,Heated Pool, Wifi, A/C,BBQ, Sea View !
Entire Place • 4 bedrooms
Villa José 2, Heated pool, Wifi, A/C, Sea View !
Entire Place • 5 bedrooms
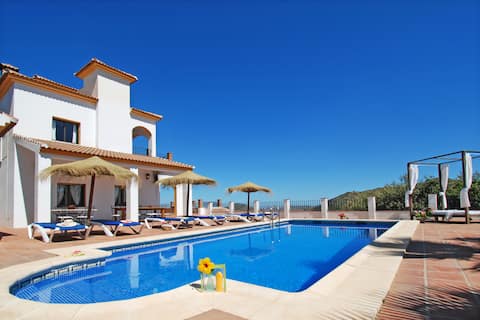
Villa José 1 , Heated pool, A/C, wifi, Sea views !
Entire Place • 5 bedrooms
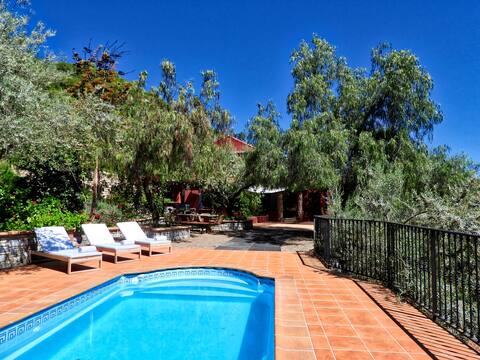
Casa Alambique, beautiful villa with pool & games
Entire Place • 4 bedrooms
"Finca Volando" in the mountains of Málaga
Entire Place • 6 bedrooms
Note: Performance varies based on location, size, amenities, seasonality, and management quality. Data reflects the past 12 months.
Top Performing Airbnb Hosts in Comares (2025)
Learn from the best! This table showcases top-performing Airbnb hosts in Comares based on the number of properties managed and estimated total revenue over the past year. Analyze their scale and performance metrics.
| Host Name | Properties | Grossing Revenue | Stay Reviews | Avg Rating |
|---|---|---|---|---|
| Comares Holiday Properties S.L | 7 | $347,532 | 220 | 4.73/5.0 |
| Susan | 2 | $49,753 | 294 | 4.95/5.0 |
| Angus And Sylvia | 2 | $49,447 | 206 | 4.97/5.0 |
| Karin | 2 | $48,477 | 17 | 5.00/5.0 |
| Daniel | 1 | $44,969 | 42 | 4.90/5.0 |
| Alina | 1 | $44,288 | 30 | 4.97/5.0 |
| David | 4 | $42,775 | 62 | 3.64/5.0 |
| Villa Rental Comares | 1 | $39,199 | 30 | 4.80/5.0 |
| José Antonio | 1 | $37,144 | 17 | 4.59/5.0 |
| Simon | 1 | $36,798 | 31 | 4.94/5.0 |
Analyzing the strategies of top hosts, such as their property selection, pricing, and guest communication, can offer valuable lessons for optimizing your own Airbnb operations in Comares.
Dive Deeper: Advanced Comares STR Market Data (2025)
Ready to unlock more insights? AirROI provides access to advanced metrics and comprehensive Airbnb data for Comares. Explore detailed analytics beyond this report to refine your investment strategy, optimize pricing, and maximize your vacation rental profits.
Explore Advanced MetricsComares Short-Term Rental Market Composition (2025): Property & Room Types
Room Type Distribution
Property Type Distribution
Market Composition Insights for Comares
- The Comares Airbnb market composition is heavily skewed towards Entire Home/Apt listings, which make up 96.8% of the 62 active rentals. This indicates strong guest preference for privacy and space.
- Looking at the property type distribution in Comares, House properties are the most common (87.1%), reflecting the local real estate landscape.
- Houses represent a significant 87.1% portion, catering likely to families or larger groups.
- Smaller segments like hotel/boutique (combined 3.2%) offer potential for unique stay experiences.
Comares Airbnb Room Capacity Analysis (2025): Bedroom Distribution
Distribution of Listings by Number of Bedrooms
Room Capacity Insights for Comares
- The dominant room capacity in Comares is 3 bedrooms listings, making up 33.9% of the market. This suggests a strong demand for properties suitable for families or small groups.
- Together, 3 bedrooms and 1 bedroom properties represent 53.3% of the active Airbnb listings in Comares, indicating a high concentration in these sizes.
- A significant 62.9% of listings offer 3+ bedrooms, catering to larger groups and families seeking more space in Comares.
Comares Vacation Rental Guest Capacity Trends (2025)
Distribution of Listings by Guest Capacity
Guest Capacity Insights for Comares
- The most common guest capacity trend in Comares vacation rentals is listings accommodating 8+ guests (35.5%). This suggests the primary traveler segment is likely larger groups.
- Properties designed for 8+ guests and 6 guests dominate the Comares STR market, accounting for 59.7% of listings.
- 64.5% of properties accommodate 6+ guests, serving the market segment for larger families or group travel in Comares.
- On average, properties in Comares are equipped to host 5.7 guests.
Comares Airbnb Booking Patterns (2025): Available vs. Booked Days
Available Days Distribution
Booked Days Distribution
Booking Pattern Insights for Comares
- The most common availability pattern in Comares falls within the 271-366 days range, representing 29% of listings. This suggests many properties have significant open periods on their calendars.
- Approximately 58.0% of listings show high availability (181+ days open annually), indicating potential for increased bookings or specific owner usage patterns.
- For booked days, the 181-270 days range is most frequent in Comares (30.6%), reflecting common guest stay durations or potential owner blocking patterns.
- A notable 43.5% of properties secure long booking periods (181+ days booked per year), highlighting successful long-term rental strategies or significant owner usage.
Comares Airbnb Minimum Stay Requirements Analysis
Distribution of Listings by Minimum Night Requirement
1 Night
2 listings
3.6% of total
2 Nights
10 listings
17.9% of total
3 Nights
5 listings
8.9% of total
4-6 Nights
9 listings
16.1% of total
7-29 Nights
25 listings
44.6% of total
30+ Nights
5 listings
8.9% of total
Key Insights
- The most prevalent minimum stay requirement in Comares is 7-29 Nights, adopted by 44.6% of listings. This highlights the market's preference for shorter, flexible bookings.
Recommendations
- Align with the market by considering a 7-29 Nights minimum stay, as 44.6% of Comares hosts use this setting.
- If feasible, allowing 1-night stays, especially midweek or during low season, could capture last-minute bookings, as only 3.6% currently do.
- Explore offering discounts for stays of 30+ nights to attract the 8.9% of the market seeking extended stays.
- Adjust minimum nights based on seasonality – potentially shorter during low season and longer during peak demand periods in Comares.
Comares Airbnb Cancellation Policy Trends Analysis (2025)
Super Strict 60 Days
10 listings
17.9% of total
Flexible
4 listings
7.1% of total
Moderate
4 listings
7.1% of total
Firm
22 listings
39.3% of total
Strict
16 listings
28.6% of total
Cancellation Policy Insights for Comares
- The prevailing Airbnb cancellation policy trend in Comares is Firm, used by 39.3% of listings.
- A majority (67.9%) of hosts in Comares utilize Firm or Strict policies, indicating a market where hosts prioritize booking security.
Recommendations for Hosts
- Consider adopting a Firm policy to align with the 39.3% market standard in Comares.
- Regularly review your cancellation policy against competitors and market demand shifts in Comares.
Comares STR Booking Lead Time Analysis (2025)
Average Booking Lead Time by Month
Booking Lead Time Insights for Comares
- The overall average booking lead time for vacation rentals in Comares is 95 days.
- Guests book furthest in advance for stays during May (average 122 days), likely coinciding with peak travel demand or local events.
- The shortest booking windows occur for stays in March (average 75 days), indicating more last-minute travel plans during this time.
- Seasonally, Summer (107 days avg.) sees the longest lead times, while Fall (95 days avg.) has the shortest, reflecting typical travel planning cycles.
Recommendations for Hosts
- Use the overall average lead time (95 days) as a baseline for your pricing and availability strategy in Comares.
- For May stays, consider implementing length-of-stay discounts or slightly higher rates for bookings made less than 122 days out to capitalize on advance planning.
- Target marketing efforts for the Summer season well in advance (at least 107 days) to capture early planners.
- Monitor your own booking lead times against these Comares averages to identify opportunities for dynamic pricing adjustments.
Popular & Essential Airbnb Amenities in Comares (2025)
Amenity Prevalence
Amenity Insights for Comares
- Essential amenities in Comares that guests expect include: Refrigerator, Washer, Kitchen, Dishes and silverware, Wifi, Cooking basics, Hot water. Lacking these (any) could significantly impact bookings.
- Popular amenities like Coffee maker, Essentials, Hair dryer are common but not universal. Offering these can provide a competitive edge.
Recommendations for Hosts
- Ensure your listing includes all essential amenities for Comares: Refrigerator, Washer, Kitchen, Dishes and silverware, Wifi, Cooking basics, Hot water.
- Prioritize adding missing essentials: Refrigerator, Washer, Kitchen, Dishes and silverware, Wifi, Cooking basics, Hot water.
- Consider adding popular differentiators like Coffee maker or Essentials to increase appeal.
- Highlight unique or less common amenities you offer (e.g., hot tub, dedicated workspace, EV charger) in your listing description and photos.
- Regularly check competitor amenities in Comares to stay competitive.
Comares Airbnb Guest Demographics & Profile Analysis (2025)
Guest Profile Summary for Comares
- The typical guest profile for Airbnb in Comares consists of predominantly international visitors (94%), with top international origins including Netherlands, typically belonging to the Post-2000s (Gen Z/Alpha) group (50%), primarily speaking English or German.
- Domestic travelers account for 6.0% of guests.
- Key international markets include United Kingdom (29.6%) and Netherlands (15.9%).
- Top languages spoken are English (39.5%) followed by German (15.1%).
- A significant demographic segment is the Post-2000s (Gen Z/Alpha) group, representing 50% of guests.
Recommendations for Hosts
- Focus marketing internationally, particularly towards travelers from Netherlands.
- Tailor amenities and listing descriptions to appeal to the dominant Post-2000s (Gen Z/Alpha) demographic (e.g., highlight fast WiFi, smart home features, local guides).
- Highlight unique local experiences or amenities relevant to the primary guest profile.
- Consider seasonal promotions aligned with peak travel times for key origin markets.
Nearby Short-Term Rental Market Comparison
How does the Comares Airbnb market stack up against its neighbors? Compare key performance metrics like average monthly revenue, ADR, and occupancy rates in surrounding areas to understand the broader regional STR landscape.
| Market | Active Properties | Monthly Revenue | Daily Rate | Avg. Occupancy |
|---|---|---|---|---|
| Alhaurín de la Torre | 203 | $3,368 | $287.14 | 47% |
| Benahavís | 492 | $3,047 | $494.00 | 40% |
| Alhaurín el Grande | 281 | $3,026 | $290.27 | 45% |
| Cártama | 56 | $2,829 | $300.39 | 43% |
| Marbella | 4,981 | $2,613 | $321.31 | 43% |
| Málaga | 7,038 | $2,217 | $162.86 | 54% |
| Coín | 113 | $2,208 | $261.43 | 43% |
| San Roque | 334 | $2,207 | $325.49 | 40% |
| Seville | 6,518 | $2,195 | $155.35 | 51% |
| Moclinejo | 10 | $2,155 | $231.35 | 51% |