Cazalla de la Sierra Airbnb Market Analysis 2025: Short Term Rental Data & Vacation Rental Statistics in Andalusia, Spain
Is Airbnb profitable in Cazalla de la Sierra in 2025? Explore comprehensive Airbnb analytics for Cazalla de la Sierra, Andalusia, Spain to uncover income potential. This 2025 STR market report for Cazalla de la Sierra, based on AirROI data from April 2024 to March 2025, reveals key trends in the niche market of 27 active listings.
Whether you're considering an Airbnb investment in Cazalla de la Sierra, optimizing your existing vacation rental, or exploring rental arbitrage opportunities, understanding the Cazalla de la Sierra Airbnb data is crucial. Navigating the high regulation landscape is key to maximizing your short term rental income potential. Let's dive into the specifics.
Key Cazalla de la Sierra Airbnb Performance Metrics Overview
Monthly Airbnb Revenue Variations & Income Potential in Cazalla de la Sierra (2025)
Understanding the monthly revenue variations for Airbnb listings in Cazalla de la Sierra is key to maximizing your short term rental income potential. Seasonality significantly impacts earnings. Our analysis, based on data from the past 12 months, shows that the peak revenue month for STRs in Cazalla de la Sierra is typically August, while March often presents the lowest earnings, highlighting opportunities for strategic pricing adjustments during shoulder and low seasons. Explore the typical Airbnb income in Cazalla de la Sierra across different performance tiers:
- Best-in-class properties (Top 10%) achieve $4,648+ monthly, often utilizing dynamic pricing and superior guest experiences.
- Strong performing properties (Top 25%) earn $1,857 or more, indicating effective management and desirable locations/amenities.
- Typical properties (Median) generate around $914 per month, representing the average market performance.
- Entry-level properties (Bottom 25%) see earnings around $470, often with potential for optimization.
Average Monthly Airbnb Earnings Trend in Cazalla de la Sierra
Cazalla de la Sierra Airbnb Occupancy Rate Trends (2025)
Maximize your bookings by understanding the Cazalla de la Sierra STR occupancy trends. Seasonal demand shifts significantly influence how often properties are booked. Typically, Augustsees the highest demand (peak season occupancy), while March experiences the lowest (low season). Effective strategies, like adjusting minimum stays or offering promotions, can boost occupancy during slower periods. Here's how different property tiers perform in Cazalla de la Sierra:
- Best-in-class properties (Top 10%) achieve 53%+ occupancy, indicating high desirability and potentially optimized availability.
- Strong performing properties (Top 25%) maintain 36% or higher occupancy, suggesting good market fit and guest satisfaction.
- Typical properties (Median) have an occupancy rate around 24%.
- Entry-level properties (Bottom 25%) average 14% occupancy, potentially facing higher vacancy.
Average Monthly Occupancy Rate Trend in Cazalla de la Sierra
Average Daily Rate (ADR) Airbnb Trends in Cazalla de la Sierra (2025)
Effective short term rental pricing strategy in Cazalla de la Sierra involves understanding monthly ADR fluctuations. The Average Daily Rate (ADR) for Airbnb in Cazalla de la Sierra typically peaks in August and dips lowest during March. Leveraging Airbnb dynamic pricing tools or strategies based on this seasonality can significantly boost revenue. Here's a look at the typical nightly rates achieved:
- Best-in-class properties (Top 10%) command rates of $311+ per night, often due to premium features or locations.
- Strong performing properties (Top 25%) achieve nightly rates of $240 or more.
- Typical properties (Median) charge around $154 per night.
- Entry-level properties (Bottom 25%) earn around $101 per night.
Average Daily Rate (ADR) Trend by Month in Cazalla de la Sierra
Get Live Cazalla de la Sierra Market Intelligence 👇

Explore Real-time Analytics
Airbnb Seasonality Analysis & Trends in Cazalla de la Sierra (2025)
Peak Season (August, July, December)
- Revenue averages $2,458 per month
- Occupancy rates average 38.8%
- Daily rates average $197
Shoulder Season
- Revenue averages $1,677 per month
- Occupancy maintains around 24.8%
- Daily rates hold near $193
Low Season (January, March, April)
- Revenue drops to average $1,192 per month
- Occupancy decreases to average 22.0%
- Daily rates adjust to average $189
Seasonality Insights for Cazalla de la Sierra
- The Airbnb seasonality in Cazalla de la Sierra shows highly seasonal trends requiring careful strategy. While the sections above show seasonal averages, it's also insightful to look at the extremes:
- During the high season, the absolute peak month showcases Cazalla de la Sierra's highest earning potential, with monthly revenues capable of climbing to $2,805, occupancy reaching a high of 45.2%, and ADRs peaking at $200.
- Conversely, the slowest single month of the year, typically falling within the low season, marks the market's lowest point. In this month, revenue might dip to $1,029, occupancy could drop to 18.4%, and ADRs may adjust down to $182.
- Understanding both the seasonal averages and these monthly peaks and troughs in revenue, occupancy, and ADR is crucial for maximizing your Airbnb profit potential in Cazalla de la Sierra.
Seasonal Strategies for Maximizing Profit
- Peak Season: Maximize revenue through premium pricing and potentially longer minimum stays. Ensure high availability.
- Low Season: Offer competitive pricing, special promotions (e.g., extended stay discounts), and flexible cancellation policies. Target off-season travelers like remote workers or budget-conscious guests.
- Shoulder Seasons: Implement dynamic pricing that balances peak and low rates. Target weekend travelers or specific events. Offer slightly more flexible terms than peak season.
- Regularly analyze your own performance against these Cazalla de la Sierra seasonality benchmarks and adjust your pricing and availability strategy accordingly.
Best Areas for Airbnb Investment in Cazalla de la Sierra (2025)
Exploring the top neighborhoods for short-term rentals in Cazalla de la Sierra? This section highlights key areas, outlining why they are attractive for hosts and guests, along with notable local attractions. Consider these locations based on your target guest profile and investment strategy.
| Neighborhood / Area | Why Host Here? (Target Guests & Appeal) | Key Attractions & Landmarks |
|---|---|---|
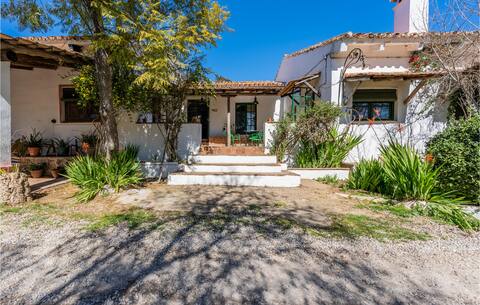
| Cazalla de la Sierra Town Center | The historic center of Cazalla de la Sierra, known for its picturesque streets and local charm. A perfect spot for tourists interested in exploring authentic Andalusian culture and history. | Iglesia de Santa María, Plaza de España, Monasterio de la Cartuja, Pueblo de Cazalla, Museo de la Semana Santa |
| Sierra Norte Natural Park | A stunning natural area offering breathtaking landscapes and outdoor activities. Ideal for nature lovers and adventure seekers looking to explore hiking trails and enjoy the beautiful scenery. | Hiking Trails, Wildlife Viewing, Nature Photography, Outdoor Sports, Cultural Heritage Sites |
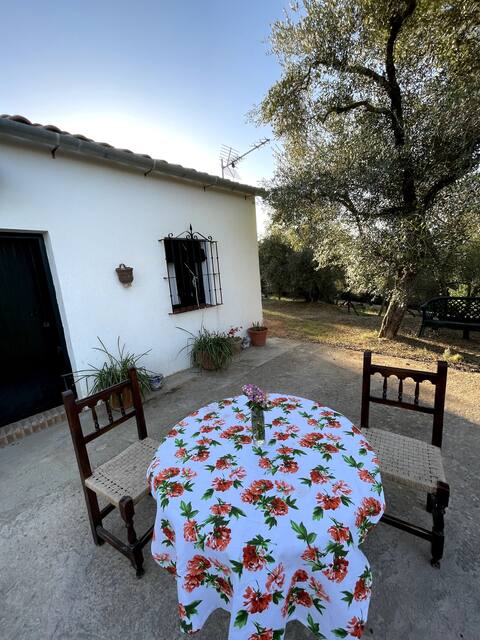
| Cazalla de la Sierra Olive Groves | Surrounding olive groves provide a rural escape and authentic local experience. Guests can enjoy the tranquility of the countryside and partake in olive oil tasting tours. | Olive Oil Mills, Tasting Tours, Rural Retreats, Scenic Views, Cultural Experiences |
| Laguna de la Cijara | A serene lagoon perfect for fishing, kayaking, and bird watching. Offers a peaceful environment for guests looking to unwind in nature and enjoy water activities. | Fishing Spots, Kayaking, Bird Watching, Scenic Picnicking, Natural Reserve |
| Cazalla de la Sierra Vineyards | This area is known for its wines and vineyards. Great for wine enthusiasts wanting to explore local wine production and enjoy vineyard tours. | Local Wineries, Wine Tasting Events, Vineyard Tours, Wine Festivals, Gastronomy Tours |
| Cazalla Adventure Activities | Provides various adventure sports such as climbing, mountain biking, and horseback riding. Perfect for adrenaline seekers and active travelers. | Climbing Routes, Mountain Biking Trails, Horse Riding Tours, Adventure Parks, Outdoor Challenges |
| Local Festivals - Cazalla de la Sierra | Cazalla hosts several local festivals throughout the year, bringing culture and excitement to the town. An excellent opportunity for guests to experience local traditions. | Semana Santa, Feria de Cazalla, Cultural Events, Local Gastronomy, Artisan Markets |
| Historical Sites around Cazalla | Renowned for its historical sites, offering a glimpse into the region's rich past. An attractive option for history buffs and cultural tourists. | Castillo de Cazalla, Ancient Ruins, Historical Museums, Cultural Heritage Trails, Archaeological Sites |
Understanding Airbnb License Requirements & STR Laws in Cazalla de la Sierra (2025)
Yes, Cazalla de la Sierra, Andalusia, Spain enforces high STR regulations. Obtaining a license and ensuring compliance is almost certainly required according to current 2025 STR laws. Always verify the latest short term rental regulations and Airbnb license requirements directly with local government authorities for Cazalla de la Sierra to ensure full compliance before hosting.
(Source: AirROI data, 2025, based on 81% licensed listings)
Top Performing Airbnb Properties in Cazalla de la Sierra (2025)
Benchmark your potential! Explore examples of top-performing Airbnb properties in Cazalla de la Sierrabased on Trailing Twelve Month (TTM) revenue. Analyze their characteristics, revenue, occupancy rate, and ADR to understand what drives success in this market.
Stunning home in Cazalla de la Sierra with WiFi
Entire Place • 7 bedrooms

Casa Rural Villa Manuela
Entire Place • 4 bedrooms
Farmhouse El Chorrillo Cazalla de la Sierra
Entire Place • 4 bedrooms

House of the Garden
Entire Place • 1 bedroom
Villa María, cottage in Cazalla de la Sierra.
Entire Place • 1 bedroom
Casa de Campo
Entire Place • 3 bedrooms
Note: Performance varies based on location, size, amenities, seasonality, and management quality. Data reflects the past 12 months.
Top Performing Airbnb Hosts in Cazalla de la Sierra (2025)
Learn from the best! This table showcases top-performing Airbnb hosts in Cazalla de la Sierra based on the number of properties managed and estimated total revenue over the past year. Analyze their scale and performance metrics.
| Host Name | Properties | Grossing Revenue | Stay Reviews | Avg Rating |
|---|---|---|---|---|
| Host #141514717 | 1 | $90,406 | 0 | 0.00/5.0 |
| Victoria | 2 | $52,972 | 44 | 4.86/5.0 |
| Maria Pilar | 1 | $52,808 | 6 | 5.00/5.0 |
| El Lagar De Viña Vieja | 3 | $43,802 | 81 | 4.60/5.0 |
| Villa María | 1 | $19,519 | 8 | 4.38/5.0 |
| Alejandro | 1 | $18,886 | 6 | 4.50/5.0 |
| Arantxa | 1 | $16,347 | 3 | 5.00/5.0 |
| Leonor | 1 | $14,058 | 37 | 4.68/5.0 |
| Cecilia | 1 | $13,111 | 5 | 4.60/5.0 |
| Monte | 1 | $10,433 | 19 | 5.00/5.0 |
Analyzing the strategies of top hosts, such as their property selection, pricing, and guest communication, can offer valuable lessons for optimizing your own Airbnb operations in Cazalla de la Sierra.
Dive Deeper: Advanced Cazalla de la Sierra STR Market Data (2025)
Ready to unlock more insights? AirROI provides access to advanced metrics and comprehensive Airbnb data for Cazalla de la Sierra. Explore detailed analytics beyond this report to refine your investment strategy, optimize pricing, and maximize your vacation rental profits.
Explore Advanced MetricsCazalla de la Sierra Short-Term Rental Market Composition (2025): Property & Room Types
Room Type Distribution
Property Type Distribution
Market Composition Insights for Cazalla de la Sierra
- The Cazalla de la Sierra Airbnb market composition is heavily skewed towards Entire Home/Apt listings, which make up 100% of the 27 active rentals. This indicates strong guest preference for privacy and space.
- Looking at the property type distribution in Cazalla de la Sierra, House properties are the most common (92.6%), reflecting the local real estate landscape.
- Houses represent a significant 92.6% portion, catering likely to families or larger groups.
- Smaller segments like apartment/condo, outdoor/unique (combined 7.4%) offer potential for unique stay experiences.
Cazalla de la Sierra Airbnb Room Capacity Analysis (2025): Bedroom Distribution
Distribution of Listings by Number of Bedrooms
Room Capacity Insights for Cazalla de la Sierra
- The dominant room capacity in Cazalla de la Sierra is 4 bedrooms listings, making up 25.9% of the market. This suggests a strong demand for properties suitable for families or small groups.
- Together, 4 bedrooms and 3 bedrooms properties represent 51.8% of the active Airbnb listings in Cazalla de la Sierra, indicating a high concentration in these sizes.
- A significant 66.6% of listings offer 3+ bedrooms, catering to larger groups and families seeking more space in Cazalla de la Sierra.
Cazalla de la Sierra Vacation Rental Guest Capacity Trends (2025)
Distribution of Listings by Guest Capacity
Guest Capacity Insights for Cazalla de la Sierra
- The most common guest capacity trend in Cazalla de la Sierra vacation rentals is listings accommodating 8+ guests (48.1%). This suggests the primary traveler segment is likely larger groups.
- Properties designed for 8+ guests and 6 guests dominate the Cazalla de la Sierra STR market, accounting for 74.0% of listings.
- 74.0% of properties accommodate 6+ guests, serving the market segment for larger families or group travel in Cazalla de la Sierra.
- On average, properties in Cazalla de la Sierra are equipped to host 6.4 guests.
Cazalla de la Sierra Airbnb Booking Patterns (2025): Available vs. Booked Days
Available Days Distribution
Booked Days Distribution
Booking Pattern Insights for Cazalla de la Sierra
- The most common availability pattern in Cazalla de la Sierra falls within the 271-366 days range, representing 59.3% of listings. This suggests many properties have significant open periods on their calendars.
- Approximately 96.3% of listings show high availability (181+ days open annually), indicating potential for increased bookings or specific owner usage patterns.
- For booked days, the 91-180 days range is most frequent in Cazalla de la Sierra (44.4%), reflecting common guest stay durations or potential owner blocking patterns.
- A notable 3.7% of properties secure long booking periods (181+ days booked per year), highlighting successful long-term rental strategies or significant owner usage.
Cazalla de la Sierra Airbnb Minimum Stay Requirements Analysis
Distribution of Listings by Minimum Night Requirement
1 Night
3 listings
11.5% of total
2 Nights
17 listings
65.4% of total
4-6 Nights
1 listings
3.8% of total
30+ Nights
5 listings
19.2% of total
Key Insights
- The most prevalent minimum stay requirement in Cazalla de la Sierra is 2 Nights, adopted by 65.4% of listings. This highlights the market's preference for shorter, flexible bookings.
- A strong majority (76.9%) of the Cazalla de la Sierra Airbnb data shows acceptance of very short stays (1-2 nights), indicating a dynamic, high-turnover market.
- A significant segment (19.2%) caters to monthly stays (30+ nights) in Cazalla de la Sierra, pointing to opportunities in the extended-stay market.
Recommendations
- Align with the market by considering a 2 Nights minimum stay, as 65.4% of Cazalla de la Sierra hosts use this setting.
- If feasible, allowing 1-night stays, especially midweek or during low season, could capture last-minute bookings, as only 11.5% currently do.
- A 2-night minimum appears standard (65.4%). Consider this for weekends or peak periods.
- Explore offering discounts for stays of 30+ nights to attract the 19.2% of the market seeking extended stays.
- Adjust minimum nights based on seasonality – potentially shorter during low season and longer during peak demand periods in Cazalla de la Sierra.
Cazalla de la Sierra Airbnb Cancellation Policy Trends Analysis (2025)
Flexible
5 listings
21.7% of total
Moderate
3 listings
13% of total
Firm
8 listings
34.8% of total
Strict
7 listings
30.4% of total
Cancellation Policy Insights for Cazalla de la Sierra
- The prevailing Airbnb cancellation policy trend in Cazalla de la Sierra is Firm, used by 34.8% of listings.
- A majority (65.2%) of hosts in Cazalla de la Sierra utilize Firm or Strict policies, indicating a market where hosts prioritize booking security.
Recommendations for Hosts
- Consider adopting a Firm policy to align with the 34.8% market standard in Cazalla de la Sierra.
- With 30.4% using Strict terms, this is a viable option in Cazalla de la Sierra, particularly for high-value properties or during peak demand periods.
- Regularly review your cancellation policy against competitors and market demand shifts in Cazalla de la Sierra.
Cazalla de la Sierra STR Booking Lead Time Analysis (2025)
Average Booking Lead Time by Month
Booking Lead Time Insights for Cazalla de la Sierra
- The overall average booking lead time for vacation rentals in Cazalla de la Sierra is 40 days.
- Guests book furthest in advance for stays during August (average 81 days), likely coinciding with peak travel demand or local events.
- The shortest booking windows occur for stays in October (average 24 days), indicating more last-minute travel plans during this time.
- Seasonally, Summer (60 days avg.) sees the longest lead times, while Winter (38 days avg.) has the shortest, reflecting typical travel planning cycles.
Recommendations for Hosts
- Use the overall average lead time (40 days) as a baseline for your pricing and availability strategy in Cazalla de la Sierra.
- For August stays, consider implementing length-of-stay discounts or slightly higher rates for bookings made less than 81 days out to capitalize on advance planning.
- Target marketing efforts for the Summer season well in advance (at least 60 days) to capture early planners.
- Monitor your own booking lead times against these Cazalla de la Sierra averages to identify opportunities for dynamic pricing adjustments.
Popular & Essential Airbnb Amenities in Cazalla de la Sierra (2025)
Amenity Prevalence
Amenity Insights for Cazalla de la Sierra
- Essential amenities in Cazalla de la Sierra that guests expect include: Kitchen, TV. Lacking these (any) could significantly impact bookings.
- Popular amenities like Indoor fireplace, Refrigerator, Essentials are common but not universal. Offering these can provide a competitive edge.
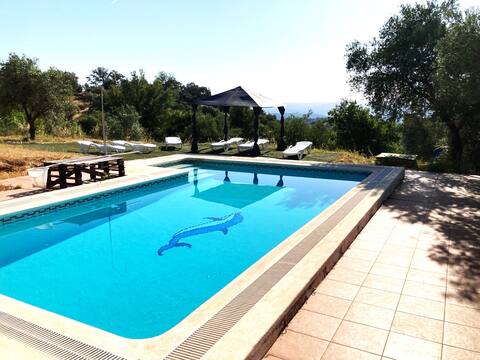
- A pool is a highly desired but not standard amenity, making it a key feature for attracting guests seeking leisure in Cazalla de la Sierra.
Recommendations for Hosts
- Ensure your listing includes all essential amenities for Cazalla de la Sierra: Kitchen, TV.
- Consider adding popular differentiators like Indoor fireplace or Refrigerator to increase appeal.
- Highlight unique or less common amenities you offer (e.g., hot tub, dedicated workspace, EV charger) in your listing description and photos.
- Regularly check competitor amenities in Cazalla de la Sierra to stay competitive.
Cazalla de la Sierra Airbnb Guest Demographics & Profile Analysis (2025)
Guest Profile Summary for Cazalla de la Sierra
- The typical guest profile for Airbnb in Cazalla de la Sierra consists of a mix of domestic (64%) and international guests, often arriving from nearby Seville, typically belonging to the Post-2000s (Gen Z/Alpha) group (50%), primarily speaking English or Spanish.
- Domestic travelers account for 63.6% of guests.
- Key international markets include Spain (63.6%) and United Kingdom (10.9%).
- Top languages spoken are English (37.3%) followed by Spanish (30.5%).
- A significant demographic segment is the Post-2000s (Gen Z/Alpha) group, representing 50% of guests.
Recommendations for Hosts
- Target domestic marketing efforts towards travelers from Seville and Málaga.
- Tailor amenities and listing descriptions to appeal to the dominant Post-2000s (Gen Z/Alpha) demographic (e.g., highlight fast WiFi, smart home features, local guides).
- Highlight unique local experiences or amenities relevant to the primary guest profile.
- Consider seasonal promotions aligned with peak travel times for key origin markets.
Nearby Short-Term Rental Market Comparison
How does the Cazalla de la Sierra Airbnb market stack up against its neighbors? Compare key performance metrics like average monthly revenue, ADR, and occupancy rates in surrounding areas to understand the broader regional STR landscape.
| Market | Active Properties | Monthly Revenue | Daily Rate | Avg. Occupancy |
|---|---|---|---|---|
| Alhaurín de la Torre | 203 | $3,368 | $287.14 | 47% |
| Gelves | 22 | $3,120 | $185.84 | 53% |
| Benahavís | 492 | $3,047 | $494.00 | 40% |
| Alhaurín el Grande | 281 | $3,026 | $290.27 | 45% |
| Cártama | 56 | $2,829 | $300.39 | 43% |
| Monesterio | 18 | $2,729 | $248.38 | 35% |
| Marbella | 4,981 | $2,613 | $321.31 | 43% |
| El Castillo de las Guardas | 13 | $2,500 | $247.20 | 38% |
| Guillena | 34 | $2,397 | $273.55 | 36% |
| Valencina de la Concepción | 33 | $2,230 | $200.81 | 49% |