Castilleja de la Cuesta Airbnb Market Analysis 2025: Short Term Rental Data & Vacation Rental Statistics in Andalusia, Spain
Is Airbnb profitable in Castilleja de la Cuesta in 2025? Explore comprehensive Airbnb analytics for Castilleja de la Cuesta, Andalusia, Spain to uncover income potential. This 2025 STR market report for Castilleja de la Cuesta, based on AirROI data from April 2024 to March 2025, reveals key trends in the niche market of 17 active listings.
Whether you're considering an Airbnb investment in Castilleja de la Cuesta, optimizing your existing vacation rental, or exploring rental arbitrage opportunities, understanding the Castilleja de la Cuesta Airbnb data is crucial. Navigating the high regulation landscape is key to maximizing your short term rental income potential. Let's dive into the specifics.
Key Castilleja de la Cuesta Airbnb Performance Metrics Overview
Monthly Airbnb Revenue Variations & Income Potential in Castilleja de la Cuesta (2025)
Understanding the monthly revenue variations for Airbnb listings in Castilleja de la Cuesta is key to maximizing your short term rental income potential. Seasonality significantly impacts earnings. Our analysis, based on data from the past 12 months, shows that the peak revenue month for STRs in Castilleja de la Cuesta is typically May, while January often presents the lowest earnings, highlighting opportunities for strategic pricing adjustments during shoulder and low seasons. Explore the typical Airbnb income in Castilleja de la Cuesta across different performance tiers:
- Best-in-class properties (Top 10%) achieve $2,959+ monthly, often utilizing dynamic pricing and superior guest experiences.
- Strong performing properties (Top 25%) earn $2,315 or more, indicating effective management and desirable locations/amenities.
- Typical properties (Median) generate around $1,520 per month, representing the average market performance.
- Entry-level properties (Bottom 25%) see earnings around $846, often with potential for optimization.
Average Monthly Airbnb Earnings Trend in Castilleja de la Cuesta
Castilleja de la Cuesta Airbnb Occupancy Rate Trends (2025)
Maximize your bookings by understanding the Castilleja de la Cuesta STR occupancy trends. Seasonal demand shifts significantly influence how often properties are booked. Typically, Maysees the highest demand (peak season occupancy), while January experiences the lowest (low season). Effective strategies, like adjusting minimum stays or offering promotions, can boost occupancy during slower periods. Here's how different property tiers perform in Castilleja de la Cuesta:
- Best-in-class properties (Top 10%) achieve 81%+ occupancy, indicating high desirability and potentially optimized availability.
- Strong performing properties (Top 25%) maintain 72% or higher occupancy, suggesting good market fit and guest satisfaction.
- Typical properties (Median) have an occupancy rate around 47%.
- Entry-level properties (Bottom 25%) average 25% occupancy, potentially facing higher vacancy.
Average Monthly Occupancy Rate Trend in Castilleja de la Cuesta
Average Daily Rate (ADR) Airbnb Trends in Castilleja de la Cuesta (2025)
Effective short term rental pricing strategy in Castilleja de la Cuesta involves understanding monthly ADR fluctuations. The Average Daily Rate (ADR) for Airbnb in Castilleja de la Cuesta typically peaks in April and dips lowest during February. Leveraging Airbnb dynamic pricing tools or strategies based on this seasonality can significantly boost revenue. Here's a look at the typical nightly rates achieved:
- Best-in-class properties (Top 10%) command rates of $231+ per night, often due to premium features or locations.
- Strong performing properties (Top 25%) achieve nightly rates of $158 or more.
- Typical properties (Median) charge around $109 per night.
- Entry-level properties (Bottom 25%) earn around $74 per night.
Average Daily Rate (ADR) Trend by Month in Castilleja de la Cuesta
Get Live Castilleja de la Cuesta Market Intelligence 👇

Explore Real-time Analytics
Airbnb Seasonality Analysis & Trends in Castilleja de la Cuesta (2025)
Peak Season (May, April, July)
- Revenue averages $2,408 per month
- Occupancy rates average 57.0%
- Daily rates average $138
Shoulder Season
- Revenue averages $1,707 per month
- Occupancy maintains around 50.2%
- Daily rates hold near $130
Low Season (January, February, March)
- Revenue drops to average $1,169 per month
- Occupancy decreases to average 36.2%
- Daily rates adjust to average $114
Seasonality Insights for Castilleja de la Cuesta
- The Airbnb seasonality in Castilleja de la Cuesta shows highly seasonal trends requiring careful strategy. While the sections above show seasonal averages, it's also insightful to look at the extremes:
- During the high season, the absolute peak month showcases Castilleja de la Cuesta's highest earning potential, with monthly revenues capable of climbing to $2,647, occupancy reaching a high of 62.6%, and ADRs peaking at $142.
- Conversely, the slowest single month of the year, typically falling within the low season, marks the market's lowest point. In this month, revenue might dip to $983, occupancy could drop to 30.7%, and ADRs may adjust down to $112.
- Understanding both the seasonal averages and these monthly peaks and troughs in revenue, occupancy, and ADR is crucial for maximizing your Airbnb profit potential in Castilleja de la Cuesta.
Seasonal Strategies for Maximizing Profit
- Peak Season: Maximize revenue through premium pricing and potentially longer minimum stays. Ensure high availability.
- Low Season: Offer competitive pricing, special promotions (e.g., extended stay discounts), and flexible cancellation policies. Target off-season travelers like remote workers or budget-conscious guests.
- Shoulder Seasons: Implement dynamic pricing that balances peak and low rates. Target weekend travelers or specific events. Offer slightly more flexible terms than peak season.
- Regularly analyze your own performance against these Castilleja de la Cuesta seasonality benchmarks and adjust your pricing and availability strategy accordingly.
Best Areas for Airbnb Investment in Castilleja de la Cuesta (2025)
Exploring the top neighborhoods for short-term rentals in Castilleja de la Cuesta? This section highlights key areas, outlining why they are attractive for hosts and guests, along with notable local attractions. Consider these locations based on your target guest profile and investment strategy.
| Neighborhood / Area | Why Host Here? (Target Guests & Appeal) | Key Attractions & Landmarks |
|---|---|---|
| Centro de Castilleja de la Cuesta | The heart of the town with historic architecture and easy access to local shops, cafes, and communal activities. Ideal for travelers looking to experience local culture. | Plaza de España, Iglesia de San Juan Bautista, Parque de la Calle Real, Mercado de Abastos, Rutas de senderismo cercanas |
| La Campiña | A residential area known for its tranquility and green spaces. Attractive to families and those seeking a peaceful retreat near urban amenities. | Parque de la Campiña, Caminos rurales for walking and cycling, Vistas del campo, Local festivities, Tradicional arquitectura andaluza |
| Carrer de la Paz | This street is known for its local shops and friendly atmosphere. It is a great location for guests wanting to explore the local flavor and community. | Restaurantes locales, Tiendas de artesanía, Eventos culturales, Plaza de la Paz, Cafés al aire libre |
| El Terrón | A tranquil suburban area, perfect for families or longer stays, away from the hustle of the center, yet close enough to enjoy city life. | Parque El Terrón, Escuelas locales, Viviendas unifamiliares con encanto, Rutas de senderismo, Parques infantiles |
| San Juan de Dios | Known for its vibrant local life and convenience, this area is popular among tourists for its dining and nightlife options. | Cafés y bares, Pequeñas tiendas, Tradiciones locales, Arte mural, Eventos comunitarios |
| Avenida de Andalucia | A main thoroughfare that offers easy access to the rest of the municipality and beyond, making it ideal for those needing transport links. | Transporte público accesible, Centros comerciales cercanos, Rutas de autobús, Cafeterías, Restaurantes |
| Calle Real | A pedestrian-friendly street filled with shops, restaurants, and local culture. A hotspot for visitors looking to mingle with locals. | Tiendas de souvenirs, Restaurantes típicos, Eventos festivos, Música en vivo, Actividades culturales |
| Parque de la Música | A community park that hosts concerts and events throughout the year, appealing to tourists interested in cultural activities. | Conciertos al aire libre, Eventos comunitarios, Caminatas recreativas, Zonas de juegos, Cafeterías |
Understanding Airbnb License Requirements & STR Laws in Castilleja de la Cuesta (2025)
Yes, Castilleja de la Cuesta, Andalusia, Spain enforces high STR regulations. Obtaining a license and ensuring compliance is almost certainly required according to current 2025 STR laws. Always verify the latest short term rental regulations and Airbnb license requirements directly with local government authorities for Castilleja de la Cuesta to ensure full compliance before hosting.
(Source: AirROI data, 2025, based on 94% licensed listings)
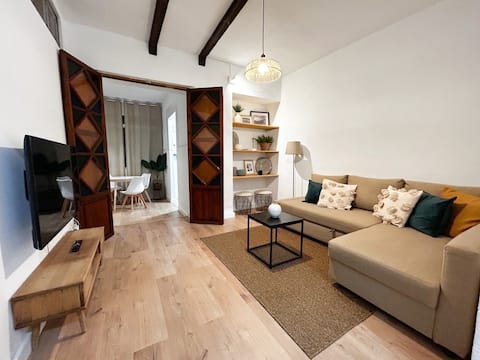
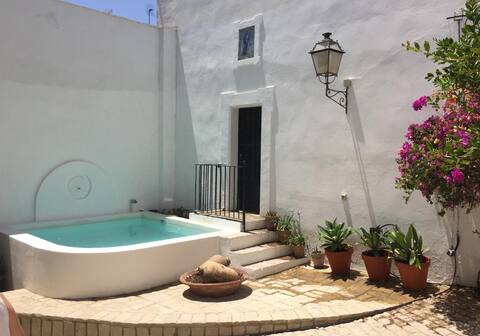
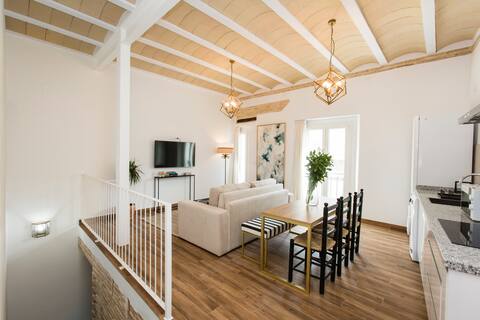
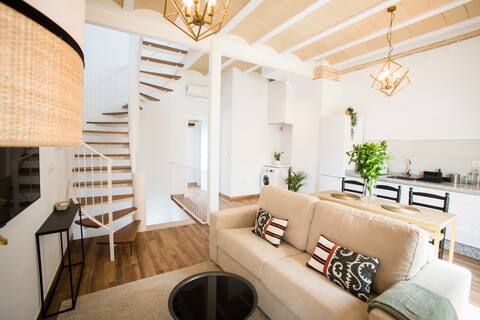
Top Performing Airbnb Properties in Castilleja de la Cuesta (2025)
Benchmark your potential! Explore examples of top-performing Airbnb properties in Castilleja de la Cuestabased on Trailing Twelve Month (TTM) revenue. Analyze their characteristics, revenue, occupancy rate, and ADR to understand what drives success in this market.

Un Oasis en Sevilla - Your place to disconnect
Entire Place • 3 bedrooms
Plaza apartment
Entire Place �• 1 bedroom
Casa Con Piscina 5 minutes from Seville
Entire Place • 2 bedrooms
Lovely 2 Bedroom Terrace Apartment
Entire Place • 2 bedrooms

Seville. Castilleja Cuesta near downtown Seville
Entire Place • 5 bedrooms
Lovely apartment with terrace and views
Entire Place • 1 bedroom
Note: Performance varies based on location, size, amenities, seasonality, and management quality. Data reflects the past 12 months.
Top Performing Airbnb Hosts in Castilleja de la Cuesta (2025)
Learn from the best! This table showcases top-performing Airbnb hosts in Castilleja de la Cuesta based on the number of properties managed and estimated total revenue over the past year. Analyze their scale and performance metrics.
| Host Name | Properties | Grossing Revenue | Stay Reviews | Avg Rating |
|---|---|---|---|---|
| Judit | 4 | $85,660 | 235 | 4.87/5.0 |
| José Maria | 1 | $48,543 | 10 | 5.00/5.0 |
| José Antonio | 2 | $34,896 | 19 | 2.50/5.0 |
| Nacho | 1 | $26,272 | 21 | 4.71/5.0 |
| Jose Carlos | 1 | $25,501 | 70 | 4.74/5.0 |
| Ruud | 1 | $17,263 | 5 | 5.00/5.0 |
| Carmen | 1 | $14,670 | 21 | 4.95/5.0 |
| Rafael | 1 | $12,636 | 17 | 5.00/5.0 |
| Juan | 1 | $10,879 | 209 | 4.64/5.0 |
| Holi- Rent | 1 | $10,846 | 27 | 4.67/5.0 |
Analyzing the strategies of top hosts, such as their property selection, pricing, and guest communication, can offer valuable lessons for optimizing your own Airbnb operations in Castilleja de la Cuesta.
Dive Deeper: Advanced Castilleja de la Cuesta STR Market Data (2025)
Ready to unlock more insights? AirROI provides access to advanced metrics and comprehensive Airbnb data for Castilleja de la Cuesta. Explore detailed analytics beyond this report to refine your investment strategy, optimize pricing, and maximize your vacation rental profits.
Explore Advanced MetricsCastilleja de la Cuesta Short-Term Rental Market Composition (2025): Property & Room Types
Room Type Distribution
Property Type Distribution
Market Composition Insights for Castilleja de la Cuesta
- The Castilleja de la Cuesta Airbnb market composition is heavily skewed towards Entire Home/Apt listings, which make up 88.2% of the 17 active rentals. This indicates strong guest preference for privacy and space.
- Looking at the property type distribution in Castilleja de la Cuesta, Apartment/Condo properties are the most common (52.9%), reflecting the local real estate landscape.
- Houses represent a significant 41.2% portion, catering likely to families or larger groups.
- The presence of 5.9% Hotel/Boutique listings indicates integration with traditional hospitality.
Castilleja de la Cuesta Airbnb Room Capacity Analysis (2025): Bedroom Distribution
Distribution of Listings by Number of Bedrooms
Room Capacity Insights for Castilleja de la Cuesta
- The dominant room capacity in Castilleja de la Cuesta is 1 bedroom listings, making up 35.3% of the market. This suggests a strong demand for properties suitable for couples or solo travelers.
- Together, 1 bedroom and 2 bedrooms properties represent 58.8% of the active Airbnb listings in Castilleja de la Cuesta, indicating a high concentration in these sizes.
- A significant 29.4% of listings offer 3+ bedrooms, catering to larger groups and families seeking more space in Castilleja de la Cuesta.
Castilleja de la Cuesta Vacation Rental Guest Capacity Trends (2025)
Distribution of Listings by Guest Capacity
Guest Capacity Insights for Castilleja de la Cuesta
- The most common guest capacity trend in Castilleja de la Cuesta vacation rentals is listings accommodating 6 guests (29.4%). This suggests the primary traveler segment is likely larger groups.
- Properties designed for 6 guests and 2 guests dominate the Castilleja de la Cuesta STR market, accounting for 47.0% of listings.
- 41.2% of properties accommodate 6+ guests, serving the market segment for larger families or group travel in Castilleja de la Cuesta.
- On average, properties in Castilleja de la Cuesta are equipped to host 4.3 guests.
Castilleja de la Cuesta Airbnb Booking Patterns (2025): Available vs. Booked Days
Available Days Distribution
Booked Days Distribution
Booking Pattern Insights for Castilleja de la Cuesta
- The most common availability pattern in Castilleja de la Cuesta falls within the 91-180 days range, representing 35.3% of listings. This suggests many properties have significant open periods on their calendars.
- Approximately 58.8% of listings show high availability (181+ days open annually), indicating potential for increased bookings or specific owner usage patterns.
- For booked days, the 91-180 days range is most frequent in Castilleja de la Cuesta (35.3%), reflecting common guest stay durations or potential owner blocking patterns.
- A notable 41.2% of properties secure long booking periods (181+ days booked per year), highlighting successful long-term rental strategies or significant owner usage.
Castilleja de la Cuesta Airbnb Minimum Stay Requirements Analysis
Distribution of Listings by Minimum Night Requirement
1 Night
3 listings
18.8% of total
2 Nights
10 listings
62.5% of total
3 Nights
2 listings
12.5% of total
30+ Nights
1 listings
6.3% of total
Key Insights
- The most prevalent minimum stay requirement in Castilleja de la Cuesta is 2 Nights, adopted by 62.5% of listings. This highlights the market's preference for shorter, flexible bookings.
- A strong majority (81.3%) of the Castilleja de la Cuesta Airbnb data shows acceptance of very short stays (1-2 nights), indicating a dynamic, high-turnover market.
Recommendations
- Align with the market by considering a 2 Nights minimum stay, as 62.5% of Castilleja de la Cuesta hosts use this setting.
- If feasible, allowing 1-night stays, especially midweek or during low season, could capture last-minute bookings, as only 18.8% currently do.
- A 2-night minimum appears standard (62.5%). Consider this for weekends or peak periods.
- Explore offering discounts for stays of 30+ nights to attract the 6.3% of the market seeking extended stays.
- Adjust minimum nights based on seasonality – potentially shorter during low season and longer during peak demand periods in Castilleja de la Cuesta.
Castilleja de la Cuesta Airbnb Cancellation Policy Trends Analysis (2025)
Flexible
3 listings
18.8% of total
Moderate
6 listings
37.5% of total
Firm
4 listings
25% of total
Strict
3 listings
18.8% of total
Cancellation Policy Insights for Castilleja de la Cuesta
- The prevailing Airbnb cancellation policy trend in Castilleja de la Cuesta is Moderate, used by 37.5% of listings.
- There's a relatively balanced mix between guest-friendly (56.3%) and stricter (43.8%) policies, offering choices for different guest needs.
Recommendations for Hosts
- Consider adopting a Moderate policy to align with the 37.5% market standard in Castilleja de la Cuesta.
- Regularly review your cancellation policy against competitors and market demand shifts in Castilleja de la Cuesta.
Castilleja de la Cuesta STR Booking Lead Time Analysis (2025)
Average Booking Lead Time by Month
Booking Lead Time Insights for Castilleja de la Cuesta
- The overall average booking lead time for vacation rentals in Castilleja de la Cuesta is 65 days.
- Guests book furthest in advance for stays during July (average 102 days), likely coinciding with peak travel demand or local events.
- The shortest booking windows occur for stays in August (average 49 days), indicating more last-minute travel plans during this time.
- Seasonally, Spring (92 days avg.) sees the longest lead times, while Winter (63 days avg.) has the shortest, reflecting typical travel planning cycles.
Recommendations for Hosts
- Use the overall average lead time (65 days) as a baseline for your pricing and availability strategy in Castilleja de la Cuesta.
- For July stays, consider implementing length-of-stay discounts or slightly higher rates for bookings made less than 102 days out to capitalize on advance planning.
- Target marketing efforts for the Spring season well in advance (at least 92 days) to capture early planners.
- Monitor your own booking lead times against these Castilleja de la Cuesta averages to identify opportunities for dynamic pricing adjustments.
Popular & Essential Airbnb Amenities in Castilleja de la Cuesta (2025)
Amenity Prevalence
Amenity Insights for Castilleja de la Cuesta
- Essential amenities in Castilleja de la Cuesta that guests expect include: Wifi, Air conditioning, Bed linens, TV, Hangers, Dishes and silverware, Patio or balcony. Lacking these (any) could significantly impact bookings.
- Popular amenities like Hair dryer, Cooking basics, Heating are common but not universal. Offering these can provide a competitive edge.
Recommendations for Hosts
- Ensure your listing includes all essential amenities for Castilleja de la Cuesta: Wifi, Air conditioning, Bed linens, TV, Hangers, Dishes and silverware, Patio or balcony.
- Consider adding popular differentiators like Hair dryer or Cooking basics to increase appeal.
- Highlight unique or less common amenities you offer (e.g., hot tub, dedicated workspace, EV charger) in your listing description and photos.
- Regularly check competitor amenities in Castilleja de la Cuesta to stay competitive.
Castilleja de la Cuesta Airbnb Guest Demographics & Profile Analysis (2025)
Guest Profile Summary for Castilleja de la Cuesta
- The typical guest profile for Airbnb in Castilleja de la Cuesta consists of predominantly international visitors (81%), with top international origins including France, typically belonging to the Post-2000s (Gen Z/Alpha) group (50%), primarily speaking English or Spanish.
- Domestic travelers account for 19.4% of guests.
- Key international markets include Spain (19.4%) and France (18.7%).
- Top languages spoken are English (38%) followed by Spanish (16.6%).
- A significant demographic segment is the Post-2000s (Gen Z/Alpha) group, representing 50% of guests.
Recommendations for Hosts
- Focus marketing internationally, particularly towards travelers from France.
- Tailor amenities and listing descriptions to appeal to the dominant Post-2000s (Gen Z/Alpha) demographic (e.g., highlight fast WiFi, smart home features, local guides).
- Highlight unique local experiences or amenities relevant to the primary guest profile.
- Consider seasonal promotions aligned with peak travel times for key origin markets.
Nearby Short-Term Rental Market Comparison
How does the Castilleja de la Cuesta Airbnb market stack up against its neighbors? Compare key performance metrics like average monthly revenue, ADR, and occupancy rates in surrounding areas to understand the broader regional STR landscape.
| Market | Active Properties | Monthly Revenue | Daily Rate | Avg. Occupancy |
|---|---|---|---|---|
| Gelves | 22 | $3,120 | $185.84 | 53% |
| Benahavís | 492 | $3,047 | $494.00 | 40% |
| Monesterio | 18 | $2,729 | $248.38 | 35% |
| El Castillo de las Guardas | 13 | $2,500 | $247.20 | 38% |
| Guillena | 34 | $2,397 | $273.55 | 36% |
| São Brás de Alportel | 109 | $2,302 | $257.04 | 46% |
| Valencina de la Concepción | 33 | $2,230 | $200.81 | 49% |
| San Roque | 334 | $2,207 | $325.49 | 40% |
| Seville | 6,518 | $2,195 | $155.35 | 51% |
| Benadalid | 14 | $2,084 | $307.70 | 41% |