Casabermeja Airbnb Market Analysis 2025: Short Term Rental Data & Vacation Rental Statistics in Andalusia, Spain
Is Airbnb profitable in Casabermeja in 2025? Explore comprehensive Airbnb analytics for Casabermeja, Andalusia, Spain to uncover income potential. This 2025 STR market report for Casabermeja, based on AirROI data from April 2024 to March 2025, reveals key trends in the niche market of 54 active listings.
Whether you're considering an Airbnb investment in Casabermeja, optimizing your existing vacation rental, or exploring rental arbitrage opportunities, understanding the Casabermeja Airbnb data is crucial. Navigating the high regulation landscape is key to maximizing your short term rental income potential. Let's dive into the specifics.
Key Casabermeja Airbnb Performance Metrics Overview
Monthly Airbnb Revenue Variations & Income Potential in Casabermeja (2025)
Understanding the monthly revenue variations for Airbnb listings in Casabermeja is key to maximizing your short term rental income potential. Seasonality significantly impacts earnings. Our analysis, based on data from the past 12 months, shows that the peak revenue month for STRs in Casabermeja is typically August, while March often presents the lowest earnings, highlighting opportunities for strategic pricing adjustments during shoulder and low seasons. Explore the typical Airbnb income in Casabermeja across different performance tiers:
- Best-in-class properties (Top 10%) achieve $5,280+ monthly, often utilizing dynamic pricing and superior guest experiences.
- Strong performing properties (Top 25%) earn $3,236 or more, indicating effective management and desirable locations/amenities.
- Typical properties (Median) generate around $1,594 per month, representing the average market performance.
- Entry-level properties (Bottom 25%) see earnings around $828, often with potential for optimization.
Average Monthly Airbnb Earnings Trend in Casabermeja
Casabermeja Airbnb Occupancy Rate Trends (2025)
Maximize your bookings by understanding the Casabermeja STR occupancy trends. Seasonal demand shifts significantly influence how often properties are booked. Typically, Augustsees the highest demand (peak season occupancy), while March experiences the lowest (low season). Effective strategies, like adjusting minimum stays or offering promotions, can boost occupancy during slower periods. Here's how different property tiers perform in Casabermeja:
- Best-in-class properties (Top 10%) achieve 77%+ occupancy, indicating high desirability and potentially optimized availability.
- Strong performing properties (Top 25%) maintain 58% or higher occupancy, suggesting good market fit and guest satisfaction.
- Typical properties (Median) have an occupancy rate around 34%.
- Entry-level properties (Bottom 25%) average 16% occupancy, potentially facing higher vacancy.
Average Monthly Occupancy Rate Trend in Casabermeja
Average Daily Rate (ADR) Airbnb Trends in Casabermeja (2025)
Effective short term rental pricing strategy in Casabermeja involves understanding monthly ADR fluctuations. The Average Daily Rate (ADR) for Airbnb in Casabermeja typically peaks in August and dips lowest during October. Leveraging Airbnb dynamic pricing tools or strategies based on this seasonality can significantly boost revenue. Here's a look at the typical nightly rates achieved:
- Best-in-class properties (Top 10%) command rates of $403+ per night, often due to premium features or locations.
- Strong performing properties (Top 25%) achieve nightly rates of $245 or more.
- Typical properties (Median) charge around $128 per night.
- Entry-level properties (Bottom 25%) earn around $60 per night.
Average Daily Rate (ADR) Trend by Month in Casabermeja
Get Live Casabermeja Market Intelligence 👇
Explore Real-time Analytics
Airbnb Seasonality Analysis & Trends in Casabermeja (2025)
Peak Season (August, April, June)
- Revenue averages $3,882 per month
- Occupancy rates average 49.1%
- Daily rates average $186
Shoulder Season
- Revenue averages $2,477 per month
- Occupancy maintains around 38.6%
- Daily rates hold near $183
Low Season (January, March, November)
- Revenue drops to average $1,306 per month
- Occupancy decreases to average 25.2%
- Daily rates adjust to average $184
Seasonality Insights for Casabermeja
- The Airbnb seasonality in Casabermeja shows highly seasonal trends requiring careful strategy. While the sections above show seasonal averages, it's also insightful to look at the extremes:
- During the high season, the absolute peak month showcases Casabermeja's highest earning potential, with monthly revenues capable of climbing to $4,049, occupancy reaching a high of 62.9%, and ADRs peaking at $194.
- Conversely, the slowest single month of the year, typically falling within the low season, marks the market's lowest point. In this month, revenue might dip to $1,089, occupancy could drop to 19.9%, and ADRs may adjust down to $174.
- Understanding both the seasonal averages and these monthly peaks and troughs in revenue, occupancy, and ADR is crucial for maximizing your Airbnb profit potential in Casabermeja.
Seasonal Strategies for Maximizing Profit
- Peak Season: Maximize revenue through premium pricing and potentially longer minimum stays. Ensure high availability.
- Low Season: Offer competitive pricing, special promotions (e.g., extended stay discounts), and flexible cancellation policies. Target off-season travelers like remote workers or budget-conscious guests.
- Shoulder Seasons: Implement dynamic pricing that balances peak and low rates. Target weekend travelers or specific events. Offer slightly more flexible terms than peak season.
- Regularly analyze your own performance against these Casabermeja seasonality benchmarks and adjust your pricing and availability strategy accordingly.
Best Areas for Airbnb Investment in Casabermeja (2025)
Exploring the top neighborhoods for short-term rentals in Casabermeja? This section highlights key areas, outlining why they are attractive for hosts and guests, along with notable local attractions. Consider these locations based on your target guest profile and investment strategy.
| Neighborhood / Area | Why Host Here? (Target Guests & Appeal) | Key Attractions & Landmarks |
|---|---|---|
| Casabermeja Town Center | The heart of Casabermeja, known for its charming streets and local Andalusian culture. It attracts visitors looking for an authentic Spanish village experience while still being close to larger cities like Malaga. | Iglesia de Nuestra Señora del Socorro, Paseo de los Montes, local tapas bars, traditional markets, Cerro de las Tres Cruces |
| El Torcal | An incredible natural park located just outside Casabermeja, famous for its unique limestone formations. Attracts nature lovers and hikers seeking outdoor adventures. | Torcal de Antequera, hiking trails, wildlife watching, scenic viewpoints, prehistoric rock formations |
| La Hoya | A rural location with stunning countryside views, offering a peaceful retreat for tourists looking to escape the city. Ideal for those wanting tranquility and nature. | vineyards, agricultural experiences, local festivals, scenic walks, cycling paths |
| Malaga Beaches | Close proximity to the coastal city of Malaga, which has beautiful beaches and a vibrant nightlife. Perfect for tourists who want the combination of beach and local cultural experiences. | La Malagueta Beach, Picasso Museum, Malaga Cathedral, Bodega Antigua Casa de Guardia, Muelle Uno |
| Antequera | Nearby historical town known for its rich history and monumental sites. Attracts tourists interested in history and culture, being a UNESCO World Heritage site. | El Torcal de Antequera, Dolmen de Menga, Antequera Castle, Central Market, Plaza de España |
| Villanueva de la Concepción | A small village offering a glimpse into rural Andalusian life, known for its hospitality and local customs. It serves as a unique experience for visitors. | local fairs, traditional cuisine, nature walks, friendly locals, artisanal shops |
| Caminito del Rey | Famous for its stunning natural scenery and challenging walkways, this area draws adventure tourists and those interested in breathtaking views and outdoor activities. | Caminito del Rey hike, Gaitanes Gorge, El Chorro Waterfall, climbing experiences, scenic overlooks |
| Sierra de Chimenea | A mountainous area perfect for ecotourism and outdoor activities. Attracts adventure seekers and those wanting to explore the natural beauty of Andalusia. | hiking, birdwatching, stargazing, tranquil getaways, nature photography |
Understanding Airbnb License Requirements & STR Laws in Casabermeja (2025)
Yes, Casabermeja, Andalusia, Spain enforces high STR regulations. Obtaining a license and ensuring compliance is almost certainly required according to current 2025 STR laws. Always verify the latest short term rental regulations and Airbnb license requirements directly with local government authorities for Casabermeja to ensure full compliance before hosting.
(Source: AirROI data, 2025, based on 67% licensed listings)
Top Performing Airbnb Properties in Casabermeja (2025)
Benchmark your potential! Explore examples of top-performing Airbnb properties in Casabermejabased on Trailing Twelve Month (TTM) revenue. Analyze their characteristics, revenue, occupancy rate, and ADR to understand what drives success in this market.

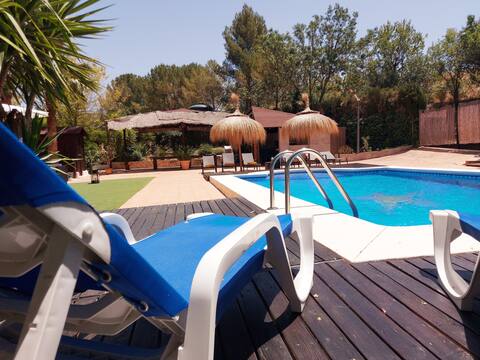
Casa rural Paradise Holidays
Entire Place • 4 bedrooms

Wood Paradise
Entire Place • 3 bedrooms
Molino del Hortelano Casabermeja by Ruralidays
Entire Place • 4 bedrooms
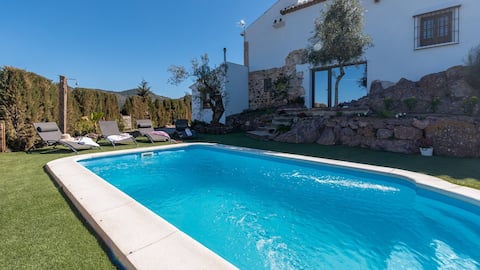
La Plazuela heated pool
Entire Place • 6 bedrooms
El Molinillo. The Senses Experience II
Entire Place • 4 bedrooms
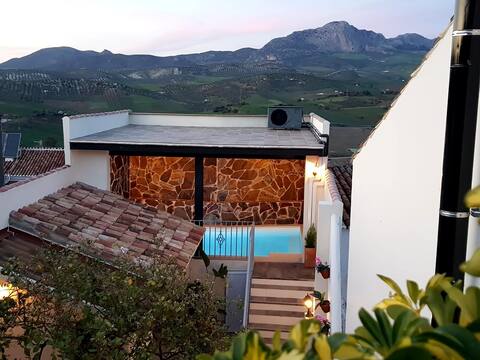
House Mirador Palomos in Casabermeja, Malaga
Entire Place • 7 bedrooms
Note: Performance varies based on location, size, amenities, seasonality, and management quality. Data reflects the past 12 months.
Top Performing Airbnb Hosts in Casabermeja (2025)
Learn from the best! This table showcases top-performing Airbnb hosts in Casabermeja based on the number of properties managed and estimated total revenue over the past year. Analyze their scale and performance metrics.
| Host Name | Properties | Grossing Revenue | Stay Reviews | Avg Rating |
|---|---|---|---|---|
| Miguel | 5 | $154,505 | 81 | 4.91/5.0 |
| Holidu | 1 | $124,726 | 14 | 4.71/5.0 |
| Ruralidays | 3 | $88,227 | 4 | 1.67/5.0 |
| Antonio | 1 | $71,501 | 95 | 4.97/5.0 |
| Maria | 2 | $63,492 | 49 | 4.96/5.0 |
| Paola Mirador De Los Palomos | 1 | $47,936 | 8 | 5.00/5.0 |
| Host #542558012 | 3 | $46,117 | 1 | 0.00/5.0 |
| Peter | 1 | $44,932 | 51 | 4.98/5.0 |
| Cubo'S Holiday Homes. | 4 | $43,577 | 47 | 3.53/5.0 |
| Ana | 1 | $42,950 | 73 | 5.00/5.0 |
Analyzing the strategies of top hosts, such as their property selection, pricing, and guest communication, can offer valuable lessons for optimizing your own Airbnb operations in Casabermeja.
Dive Deeper: Advanced Casabermeja STR Market Data (2025)
Ready to unlock more insights? AirROI provides access to advanced metrics and comprehensive Airbnb data for Casabermeja. Explore detailed analytics beyond this report to refine your investment strategy, optimize pricing, and maximize your vacation rental profits.
Explore Advanced MetricsCasabermeja Short-Term Rental Market Composition (2025): Property & Room Types
Room Type Distribution
Property Type Distribution
Market Composition Insights for Casabermeja
- The Casabermeja Airbnb market composition is heavily skewed towards Entire Home/Apt listings, which make up 88.9% of the 54 active rentals. This indicates strong guest preference for privacy and space.
- Looking at the property type distribution in Casabermeja, House properties are the most common (61.1%), reflecting the local real estate landscape.
- Houses represent a significant 61.1% portion, catering likely to families or larger groups.
- The presence of 9.3% Hotel/Boutique listings indicates integration with traditional hospitality.
- Smaller segments like unique stays (combined 3.7%) offer potential for unique stay experiences.
Casabermeja Airbnb Room Capacity Analysis (2025): Bedroom Distribution
Distribution of Listings by Number of Bedrooms
Room Capacity Insights for Casabermeja
- The dominant room capacity in Casabermeja is 1 bedroom listings, making up 37% of the market. This suggests a strong demand for properties suitable for couples or solo travelers.
- Together, 1 bedroom and 5+ bedrooms properties represent 59.2% of the active Airbnb listings in Casabermeja, indicating a high concentration in these sizes.
- A significant 46.3% of listings offer 3+ bedrooms, catering to larger groups and families seeking more space in Casabermeja.
Casabermeja Vacation Rental Guest Capacity Trends (2025)
Distribution of Listings by Guest Capacity
Guest Capacity Insights for Casabermeja
- The most common guest capacity trend in Casabermeja vacation rentals is listings accommodating 8+ guests (42.6%). This suggests the primary traveler segment is likely larger groups.
- Properties designed for 8+ guests and 2 guests dominate the Casabermeja STR market, accounting for 70.4% of listings.
- 59.3% of properties accommodate 6+ guests, serving the market segment for larger families or group travel in Casabermeja.
- On average, properties in Casabermeja are equipped to host 5.5 guests.
Casabermeja Airbnb Booking Patterns (2025): Available vs. Booked Days
Available Days Distribution
Booked Days Distribution
Booking Pattern Insights for Casabermeja
- The most common availability pattern in Casabermeja falls within the 271-366 days range, representing 48.1% of listings. This suggests many properties have significant open periods on their calendars.
- Approximately 79.6% of listings show high availability (181+ days open annually), indicating potential for increased bookings or specific owner usage patterns.
- For booked days, the 91-180 days range is most frequent in Casabermeja (29.6%), reflecting common guest stay durations or potential owner blocking patterns.
- A notable 22.3% of properties secure long booking periods (181+ days booked per year), highlighting successful long-term rental strategies or significant owner usage.
Casabermeja Airbnb Minimum Stay Requirements Analysis
Distribution of Listings by Minimum Night Requirement
1 Night
16 listings
32% of total
2 Nights
10 listings
20% of total
3 Nights
7 listings
14% of total
4-6 Nights
11 listings
22% of total
30+ Nights
6 listings
12% of total
Key Insights
- The most prevalent minimum stay requirement in Casabermeja is 1 Night, adopted by 32% of listings. This highlights the market's preference for shorter, flexible bookings.
- A significant segment (12%) caters to monthly stays (30+ nights) in Casabermeja, pointing to opportunities in the extended-stay market.
Recommendations
- Align with the market by considering a 1 Night minimum stay, as 32% of Casabermeja hosts use this setting.
- Explore offering discounts for stays of 30+ nights to attract the 12% of the market seeking extended stays.
- Adjust minimum nights based on seasonality – potentially shorter during low season and longer during peak demand periods in Casabermeja.
Casabermeja Airbnb Cancellation Policy Trends Analysis (2025)
Super Strict 30 Days
1 listings
2.6% of total
Super Strict 60 Days
1 listings
2.6% of total
Flexible
2 listings
5.1% of total
Moderate
9 listings
23.1% of total
Firm
9 listings
23.1% of total
Strict
17 listings
43.6% of total
Cancellation Policy Insights for Casabermeja
- The prevailing Airbnb cancellation policy trend in Casabermeja is Strict, used by 43.6% of listings.
- A majority (66.7%) of hosts in Casabermeja utilize Firm or Strict policies, indicating a market where hosts prioritize booking security.
Recommendations for Hosts
- Consider adopting a Strict policy to align with the 43.6% market standard in Casabermeja.
- With 43.6% using Strict terms, this is a viable option in Casabermeja, particularly for high-value properties or during peak demand periods.
- Regularly review your cancellation policy against competitors and market demand shifts in Casabermeja.
Casabermeja STR Booking Lead Time Analysis (2025)
Average Booking Lead Time by Month
Booking Lead Time Insights for Casabermeja
- The overall average booking lead time for vacation rentals in Casabermeja is 75 days.
- Guests book furthest in advance for stays during June (average 117 days), likely coinciding with peak travel demand or local events.
- The shortest booking windows occur for stays in February (average 40 days), indicating more last-minute travel plans during this time.
- Seasonally, Summer (96 days avg.) sees the longest lead times, while Winter (54 days avg.) has the shortest, reflecting typical travel planning cycles.
Recommendations for Hosts
- Use the overall average lead time (75 days) as a baseline for your pricing and availability strategy in Casabermeja.
- For June stays, consider implementing length-of-stay discounts or slightly higher rates for bookings made less than 117 days out to capitalize on advance planning.
- Target marketing efforts for the Summer season well in advance (at least 96 days) to capture early planners.
- Monitor your own booking lead times against these Casabermeja averages to identify opportunities for dynamic pricing adjustments.
Popular & Essential Airbnb Amenities in Casabermeja (2025)
Amenity Prevalence
Amenity Insights for Casabermeja
- Popular amenities like Wifi, Kitchen, TV are common but not universal. Offering these can provide a competitive edge.
- A pool is a highly desired but not standard amenity, making it a key feature for attracting guests seeking leisure in Casabermeja.
- Warning: Wifi is not universally provided but is considered essential globally. Ensure reliable Wifi is offered.
Recommendations for Hosts
- Consider adding popular differentiators like Wifi or Kitchen to increase appeal.
- Highlight unique or less common amenities you offer (e.g., hot tub, dedicated workspace, EV charger) in your listing description and photos.
- Regularly check competitor amenities in Casabermeja to stay competitive.
Casabermeja Airbnb Guest Demographics & Profile Analysis (2025)
Guest Profile Summary for Casabermeja
- The typical guest profile for Airbnb in Casabermeja consists of predominantly international visitors (78%), with top international origins including France, typically belonging to the Post-2000s (Gen Z/Alpha) group (50%), primarily speaking English or Spanish.
- Domestic travelers account for 21.8% of guests.
- Key international markets include Spain (21.8%) and France (17.3%).
- Top languages spoken are English (36.4%) followed by Spanish (16.4%).
- A significant demographic segment is the Post-2000s (Gen Z/Alpha) group, representing 50% of guests.
Recommendations for Hosts
- Focus marketing internationally, particularly towards travelers from France.
- Tailor amenities and listing descriptions to appeal to the dominant Post-2000s (Gen Z/Alpha) demographic (e.g., highlight fast WiFi, smart home features, local guides).
- Highlight unique local experiences or amenities relevant to the primary guest profile.
- Consider seasonal promotions aligned with peak travel times for key origin markets.
Nearby Short-Term Rental Market Comparison
How does the Casabermeja Airbnb market stack up against its neighbors? Compare key performance metrics like average monthly revenue, ADR, and occupancy rates in surrounding areas to understand the broader regional STR landscape.
| Market | Active Properties | Monthly Revenue | Daily Rate | Avg. Occupancy |
|---|---|---|---|---|
| Alhaurín de la Torre | 203 | $3,368 | $287.14 | 47% |
| Benahavís | 492 | $3,047 | $494.00 | 40% |
| Alhaurín el Grande | 281 | $3,026 | $290.27 | 45% |
| Cártama | 56 | $2,829 | $300.39 | 43% |
| Marbella | 4,981 | $2,613 | $321.31 | 43% |
| Málaga | 7,038 | $2,217 | $162.86 | 54% |
| Coín | 113 | $2,208 | $261.43 | 43% |
| San Roque | 334 | $2,207 | $325.49 | 40% |
| Seville | 6,518 | $2,195 | $155.35 | 51% |
| Moclinejo | 10 | $2,155 | $231.35 | 51% |